You are not logged in.
This means you
CAN ONLY VIEW reports that were published prior to Sunday, February 25, 2024.
You
MUST UPGRADE YOUR MEMBERSHIP if you want to see any current reports.
AFTER MARKET UPDATE - WEDNESDAY, JULY 8TH, 2020
Previous After Market Report Next After Market Report >>>
|
|
|
|
DOW |
+177.10 |
26,067.28 |
+0.68% |
|
Volume |
1,017,021,314 |
+6% |
|
Volume |
3,962,647,100 |
-8% |
|
NASDAQ |
+148.61 |
10,492.50 |
+1.44% |
|
Advancers |
1,727 |
59% |
|
Advancers |
1,856 |
58% |
|
S&P 500 |
+24.62 |
3,169.94 |
+0.78% |
|
Decliners |
1,208 |
41% |
|
Decliners |
1,355 |
42% |
|
Russell 2000 |
+11.41 |
1,427.40 |
+0.81% |
|
52 Wk Highs |
79 |
|
|
52 Wk Highs |
142 |
|
|
S&P 600 |
+3.33 |
818.56 |
+0.41% |
|
52 Wk Lows |
11 |
|
|
52 Wk Lows |
22 |
|
|
 |
Stock Continue Rally With Greater Leadership
Kenneth J. Gruneisen - Passed the CAN SLIM® Master's Exam
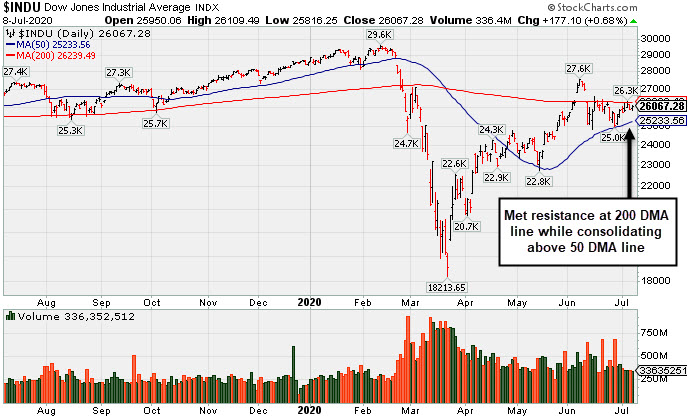
The Dow rose 177 points. The S&P 500 gained 0.8%, resuming its upward trajectory after snapping a five-session winning streak on Tuesday. The Tech-heavy Nasdaq Composite outpaced its peers with a 1.4% advance. Breadth was positive as advancers led decliners by almost a 3-2 margin on the NYSE and on the Nasdaq exchange. The reported volume totals were mixed, higher than the prior session on the NYSE and lower on the Nasdaq exchange. There were 68 high-ranked companies from the Leaders List that hit new 52-week highs and were listed on the BreakOuts Page, versus the total of 58 on the prior session. New 52-week highs totals expanded and solidly outnumbered new 52-week lows totals on both exchanges. The major indices are in a confirmed uptrend (M criteria). Any sustainable rally requires a healthy crop of new leaders, so it remains ever-important to see substantial new highs totals.Charts used courtesy of www.stockcharts.com
PICTURED: The Dow Jones Industrial Average is -11.8% off its record high and -8.7% year-to-date.
Stocks finished firmly higher on Wednesday, as Tech and internet-related stocks extended their outperformance. However, gains were capped as investors continued to assess COVID-19 updates and consider economic recovery prospects. The U.S. recorded a new single-day record of confirmed coronavirus cases yesterday and surpassed 3 million in total infections.
Six of 11 S&P 500 sectors ended in positive territory. The FAANG cohort helped to prop up equity markets, with all members minus Google parent Alphabet (GOOGL +0.92%) closing at fresh all-time highs. In M&A news, National General Holdings Corp. (NGHC +65.80%) gapped up after agreeing to be acquired by Allstate (ALL -4.78%). Private equity firm KKR (KKR +10.00%) rose after entering into a deal to purchase Global Atlantic Financial Group, which would expand the company’s existing insurance business. Elsewhere, HSBC (HSBC -2.07%), which derives the majority of its pre-tax income from Hong Kong, fell after a report suggested that leaders in Washington discussed destabilizing the region’s currency peg as a way of retaliating against China.
Treasuries declined, with the yield on the 10-year note up two basis points to 0.65%. On the data front, MBA mortgage applications rebounded 2.2% in the week ended July 3 from the prior period’s 1.8% decline. In commodities, WTI crude rose 0.6% to $40.87/barrel despite the official government report showing a 5.6 million barrel rise in weekly U.S. crude stockpiles. COMEX gold climbed 0.5% to $1,818.20/ounce, near an 11-year high.
|
 Kenneth J. Gruneisen started out as a licensed stockbroker in August 1987, a couple of months prior to the historic stock market crash that took the Dow Jones Industrial Average down -22.6% in a single day. He has published daily fact-based fundamental and technical analysis on high-ranked stocks online for two decades. Through FACTBASEDINVESTING.COM, Kenneth provides educational articles, news, market commentary, and other information regarding proven investment systems that work in good times and bad.
Comments contained in the body of this report are technical opinions only and are not necessarily those of Gruneisen Growth Corp. The material herein has been obtained from sources believed to be reliable and accurate, however, its accuracy and completeness cannot be guaranteed. Our firm, employees, and customers may effect transactions, including transactions contrary to any recommendation herein, or have positions in the securities mentioned herein or options with respect thereto. Any recommendation contained in this report may not be suitable for all investors and it is not to be deemed an offer or solicitation on our part with respect to the purchase or sale of any securities. |
|
 |
Commodity, Retail, Tech, and Financial Groups Rose
Kenneth J. Gruneisen - Passed the CAN SLIM® Master's Exam
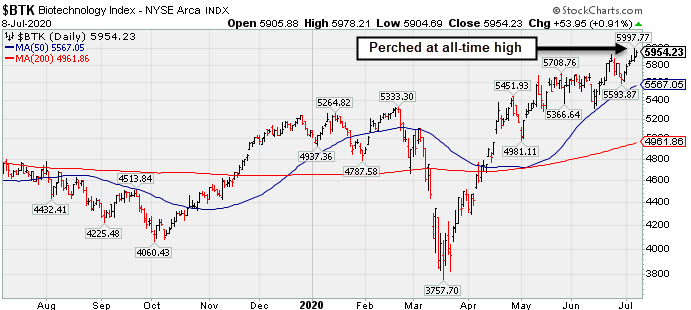
The Retail Index ($RLX +1.75%) ratcheted higher as the Broker/Dealer Index ($XBD +1.83%) and the Bank Index ($BKX +0.90%) both posted gains. The tech sector had a positive bias as the Semiconductor Index ($SOX +1.48%) and the Networking Index ($NWX +1.27%) both outpaced the Biotech Index ($BTK +0.90%). Commodity-linked groups also had a positive bias as the Integrated Oil Index ($XOI +0.30%) and the Oil Services Index ($OSX +0.72%) both edged higher, meanwhile, the Gold & Silver Index ($XAU +2.73%) again was a standout gainer.
PICTURED: The Biotech Index ($BTK +0.90%) is perched at a new all-time high. It recently found support when consolidating above its 50-day moving average (DMA) line.
| Oil Services |
$OSX |
32.96 |
+0.23 |
+0.70% |
-57.90% |
| Integrated Oil |
$XOI |
754.94 |
+2.25 |
+0.30% |
-40.58% |
| Semiconductor |
$SOX |
2,049.76 |
+29.99 |
+1.48% |
+10.82% |
| Networking |
$NWX |
542.79 |
+6.78 |
+1.27% |
-6.96% |
| Broker/Dealer |
$XBD |
276.77 |
+4.98 |
+1.83% |
-4.69% |
| Retail |
$RLX |
3,203.25 |
+54.94 |
+1.75% |
+30.78% |
| Gold & Silver |
$XAU |
136.58 |
+3.63 |
+2.73% |
+27.74% |
| Bank |
$BKX |
72.13 |
+0.64 |
+0.90% |
-36.37% |
| Biotech |
$BTK |
5,954.23 |
+53.95 |
+0.91% |
+17.50% |
|
|
|
 |
Best Ever Close With Volume-Driven Gain Approaching Pivot Point
Kenneth J. Gruneisen - Passed the CAN SLIM® Master's Exam
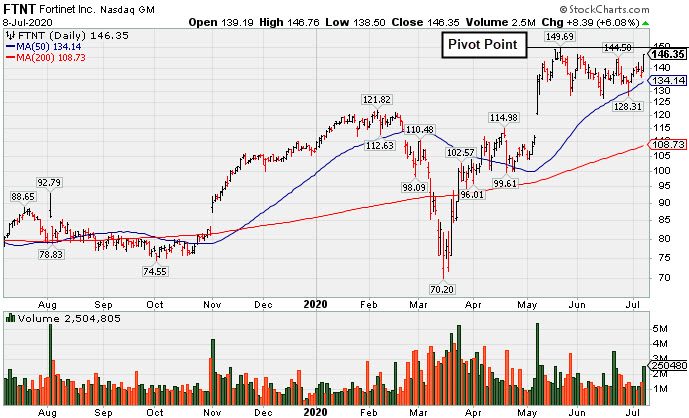
Fortinet Inc (FTNT +$8.39 or +6.08% to $146.35) posted a solid volume-driven gain for a best ever close today, rising above the recent high and toward its pivot point. It found prompt support at its 50-day moving average (DMA) line ($134.14) and above the prior low ($126.88 on 6/15/20) during the recent consolidation. Subsequent gains above the pivot point backed by at least +40% above average volume are needed to trigger a new (or add-on) technical buy signal.
FTNT was last shown in this FSU section on 6/15/20 with an annotated graph under the headline, "Managed a 'Positive Reversal' After Brief Dip Below 'Max Buy' Level". Bullish action came after reporting earnings +30% on +22% sales revenues for the Mar '20 quarter, its 9th consecutive quarterly comparison with earnings above the +25% minimum guideline (C criteria). Annual earnings (A criteria) have been improving since FY '14, also helping it match with the fact-based investment system's guidelines.
The number of top-rated funds owning its shares rose from 960 in Jun '18 to 1,633 in Jun '20, a reassuring sign concerning the I criteria. Its current Up/Down Volume ratio of 1.4 is an unbiased indication its shares have been neutral concerning accumulation/distribution over the past 50 days. It has a Timeliness rating of A and Sponsorship rating of B.
Charts courtesy of www.stockcharts.com
 |
|
|
Color Codes Explained :
Y - Better candidates highlighted by our
staff of experts.
G - Previously featured
in past reports as yellow but may no longer be buyable under the
guidelines.
***Last / Change / Volume data in this table is the closing quote data***
Symbol/Exchange
Company Name
Industry Group |
PRICE |
CHANGE
(%Change) |
Day High |
Volume
(% DAV)
(% 50 day avg vol) |
52 Wk Hi
% From Hi |
Featured
Date |
Price
Featured |
Pivot Featured |
|
Max Buy |
 FTNT
-
NASDAQ
FTNT
-
NASDAQ
Fortinet Inc
Computer Sftwr-Security
|
$146.35
|
+8.39
6.08% |
$146.76
|
2,495,825
149.00% of 50 DAV
50 DAV is 1,675,000
|
$149.69
-2.23%
|
6/22/2020
|
$142.68
|
PP = $149.79
|
|
MB = $157.28
|
 Most Recent Note - 7/8/2020 6:03:12 PM
Y - Posted a solid volume-driven gain for a best ever close today, rising above the recent high toward its pivot point. Found prompt support at its 50 DMA line ($134.14) and above the prior low ($126.88 on 6/15/20). Subsequent gains above the pivot point backed by at least +40% above average volume are needed to trigger a new (or add-on) technical buy signal. See the latest FSU analysis for more details and a new annotated graph.
>>> FEATURED STOCK ARTICLE : Best Ever Close With Volume-Driven Gain Approaching Pivot Point - 7/8/2020 |
View all notes |
Set NEW NOTE alert |
Company Profile |
SEC
News |
Chart |
Request a new note
C
A
S
I |
EBS
-
NYSE
Emergent Biosolutions
DRUGS - Biotechnology
|
$94.41
|
+4.94
5.52% |
$94.96
|
865,011
132.06% of 50 DAV
50 DAV is 655,000
|
$93.58
0.89%
|
7/7/2020
|
$89.47
|
PP = $93.68
|
|
MB = $98.36
|
Most Recent Note - 7/8/2020 12:35:50 PM
Y - Hitting a new all-time high with today's 7th consecutive gain. Color code was changed to yellow with a new pivot point cited based on its 6/01/20 high plus 10 cents. Recent gains above the 50 DMA line helped its outlook improve. No resistance remains due to overhead supply. Fundamentals remain strong.
>>> FEATURED STOCK ARTICLE : Still Below 50-Day Moving Average Following Damaging Gap Down - 6/16/2020 |
View all notes |
Set NEW NOTE alert |
Company Profile |
SEC
News |
Chart |
Request a new note
C
A
S
I |
NBIX
-
NASDAQ
Neurocrine Biosciences
DRUGS - Biotechnology
|
$130.11
|
+2.15
1.68% |
$130.76
|
497,862
55.44% of 50 DAV
50 DAV is 898,000
|
$131.00
-0.68%
|
5/19/2020
|
$123.71
|
PP = $119.75
|
|
MB = $125.74
|
Most Recent Note - 7/6/2020 6:01:56 PM
G - Color code is changed to green after rising back above its "max buy" level. Prior highs in the $119 area define important near-term support to watch above its 50 DMA line ($116.72). Fundamentals remain strong.
>>> FEATURED STOCK ARTICLE : Pulled Back Below "Max Buy" Level With Loss on Average Volume - 6/30/2020 |
View all notes |
Set NEW NOTE alert |
Company Profile |
SEC
News |
Chart |
Request a new note
C
A
S
I |
BMRN
-
NASDAQ
Biomarin Pharmaceutical
DRUGS - Drug Manufacturers - Other
|
$128.73
|
+0.75
0.59% |
$129.38
|
1,059,062
62.96% of 50 DAV
50 DAV is 1,682,000
|
$129.89
-0.89%
|
6/17/2020
|
$110.95
|
PP = $112.67
|
|
MB = $118.30
|
Most Recent Note - 7/7/2020 6:19:50 PM
G - Posted a 5th consecutive gain today for another new all-time high, getting very extended from any sound base. Stubbornly held its ground after a streak of gains for new highs marked by heavy volume. Reported strong results for the Mar '20 quarter and recent comparisons showed improved earnings increases. Annual earnings (A criteria) history has been strong. Prior high ($112.57) defines initial support to watch on pullbacks.
>>> FEATURED STOCK ARTICLE : Hit New 52-Week High But Closed Below Pivot After 3-Weeks Tight - 6/17/2020 |
View all notes |
Set NEW NOTE alert |
Company Profile |
SEC
News |
Chart |
Request a new note
C
A
S
I |
AMD
-
NASDAQ
Advanced Micro Devices
ELECTRONICS - Semiconductor - Broad Line
|
$53.43
|
+0.50
0.94% |
$53.47
|
35,355,543
62.74% of 50 DAV
50 DAV is 56,354,000
|
$59.27
-9.85%
|
6/9/2020
|
$55.41
|
PP = $56.98
|
|
MB = $59.83
|
Most Recent Note - 7/6/2020 5:52:05 PM
G - Rebounded near its 50 DMA line ($53.59) with below average volume behind today's gain. Subsequent gains above the 50 DMA line are needed for its outlook to improve. Met stubborn resistance in the $57-59 area.
>>> FEATURED STOCK ARTICLE : Slump Below 50-Day Average Toward Prior Low Raises Concerns - 6/26/2020 |
View all notes |
Set NEW NOTE alert |
Company Profile |
SEC
News |
Chart |
Request a new note
C
A
S
I |
Symbol/Exchange
Company Name
Industry Group |
PRICE |
CHANGE
(%Change) |
Day High |
Volume
(% DAV)
(% 50 day avg vol) |
52 Wk Hi
% From Hi |
Featured
Date |
Price
Featured |
Pivot Featured |
|
Max Buy |
TREX
-
NYSE
Trex Company Inc
MATERIALS and CONSTRUCTION - General Building Materials
|
$128.28
|
+1.96
1.55% |
$129.46
|
927,539
86.93% of 50 DAV
50 DAV is 1,067,000
|
$132.84
-3.43%
|
6/26/2020
|
$109.05
|
PP = $132.94
|
|
MB = $139.59
|
Most Recent Note - 7/6/2020 5:55:05 PM
Y - Quietly perched within close striking distance of its all-time high. Subsequent volume-driven gains for new highs may trigger a new (or add-on) technical buy signal. Important near-term support is at its 50 DMA line ($116.58). Fundamentals remain strong. See the latest FSU analysis for more details and a new annotated graph
>>> FEATURED STOCK ARTICLE : Quietly Perched Near All-Time High After Forming a New Base - 7/6/2020 |
View all notes |
Set NEW NOTE alert |
Company Profile |
SEC
News |
Chart |
Request a new note
C
A
S
I |
NFLX
-
NASDAQ
Netflix Inc
SPECIALTY RETAIL - Music and Video Stores
|
$502.78
|
+9.62
1.95% |
$505.10
|
5,614,797
88.86% of 50 DAV
50 DAV is 6,319,000
|
$504.82
-0.40%
|
5/14/2020
|
$441.95
|
PP = $449.62
|
|
MB = $472.10
|
Most Recent Note - 7/6/2020 5:53:16 PM
G - Hit another new all-time high with today's volume-driven gain, getting extended from any sound base. Found support near its 50 DMA line ($437) during recent consolidations.
>>> FEATURED STOCK ARTICLE : Powered to New High on Prior Session With Volume Driven Gain - 7/2/2020 |
View all notes |
Set NEW NOTE alert |
Company Profile |
SEC
News |
Chart |
Request a new note
C
A
S
I |
CHGG
-
NYSE
Chegg Inc
Consumer Svcs-Education
|
$72.79
|
+1.55
2.18% |
$73.78
|
2,138,236
45.72% of 50 DAV
50 DAV is 4,677,000
|
$72.75
0.05%
|
6/17/2020
|
$63.71
|
PP = $68.08
|
|
MB = $71.48
|
Most Recent Note - 7/6/2020 5:57:39 PM
Y - Hit a new all-time high as it posted a 7th consecutive gain today with near average volume. Disciplined investors may note that the recent gains above the pivot point were not backed by the at least +40% above average volume necessary to trigger a convincing technical buy signal. Confirming gains above the pivot point backed by volume would be a reassuring sign of fresh institutional buying demand.
>>> FEATURED STOCK ARTICLE : Formed a Flat Base Perched Within Striking Distance of 52-Week High - 6/18/2020 |
View all notes |
Set NEW NOTE alert |
Company Profile |
SEC
News |
Chart |
Request a new note
C
A
S
I |
LGIH
-
NASDAQ
L G I Homes Inc
Bldg-Resident/Comml
|
$102.73
|
+5.06
5.18% |
$103.21
|
671,254
164.52% of 50 DAV
50 DAV is 408,000
|
$99.73
3.01%
|
7/7/2020
|
$99.19
|
PP = $95.82
|
|
MB = $100.61
|
Most Recent Note - 7/8/2020 12:56:13 PM
Y - Hitting another new 52-week high with today's 4th consecutive gain. Finished strong after highlighted in yellow in the prior mid-day report with a pivot point cited based on its 2/21/20 high plus 10 cents. Its gain and strong close above the pivot point was backed by +53% above average volume triggering a convincing technical buy signal. Went through a deep consolidation below its 200 DMA line and rebounded impressively in recent months. Reported earnings +129% on +58% sales revenues for the Mar '20 quarter versus the year ago period, its 3rd consecutive quarterly comparison above the +25% minimum earnings guideline (C criteria). Annual earnings history has been strong. See the latest FSU analysis for more details and an annotated graph.
>>> FEATURED STOCK ARTICLE : Breakout to New High Backed by 53% Above Average Volume - 7/7/2020 |
View all notes |
Set NEW NOTE alert |
Company Profile |
SEC
News |
Chart |
Request a new note
C
A
S
I |
NOW
-
NYSE
Servicenow Inc
Computer Sftwr-Enterprse
|
$425.20
|
+13.46
3.27% |
$426.78
|
1,506,673
74.70% of 50 DAV
50 DAV is 2,017,000
|
$425.00
0.05%
|
4/30/2020
|
$343.05
|
PP = $363.05
|
|
MB = $381.20
|
Most Recent Note - 7/8/2020 6:10:36 PM
G - Posted a quiet gain today for another new all-time high. It has not formed a sound base. Its 50 DMA line ($384) defines important near-term support to watch on pullbacks.
>>> FEATURED STOCK ARTICLE : Hovering Near All-Time High With Volume Totals Cooling - 6/25/2020 |
View all notes |
Set NEW NOTE alert |
Company Profile |
SEC
News |
Chart |
Request a new note
C
A
S
I |
Symbol/Exchange
Company Name
Industry Group |
PRICE |
CHANGE
(%Change) |
Day High |
Volume
(% DAV)
(% 50 day avg vol) |
52 Wk Hi
% From Hi |
Featured
Date |
Price
Featured |
Pivot Featured |
|
Max Buy |
TEAM
-
NASDAQ
Atlassian Corp Plc Cl A
Comp Sftwr-Spec Enterprs
|
$195.88
|
+5.44
2.86% |
$197.06
|
1,534,069
79.86% of 50 DAV
50 DAV is 1,921,000
|
$196.35
-0.24%
|
7/7/2020
|
$190.44
|
PP = $191.82
|
|
MB = $201.41
|
Most Recent Note - 7/7/2020 6:25:25 PM
Y - Stalled after quietly touching a new all-time high on the prior session. Color code is changed to yellow with new pivot point cited based on its 6/01/20 high plus 10 cents after an orderly consolidation above its 50 DMA line ($176). Subsequent gains above the pivot point backed by at least +40% above average volume may trigger a new (or add-on) technical buy signal.
>>> FEATURED STOCK ARTICLE : 50-Day Moving Average Defines Important Near-Term Support - 6/29/2020 |
View all notes |
Set NEW NOTE alert |
Company Profile |
SEC
News |
Chart |
Request a new note
C
A
S
I |
TTD
-
NASDAQ
The Trade Desk Inc Cl A
Comml Svcs-Advertising
|
$462.49
|
+11.78
2.61% |
$465.36
|
1,247,417
58.62% of 50 DAV
50 DAV is 2,128,000
|
$466.00
-0.75%
|
6/3/2020
|
$340.61
|
PP = $327.35
|
|
MB = $343.72
|
Most Recent Note - 7/8/2020 6:08:29 PM
G - Hit yet another new 52-week high with today's 6th consecutive gain, getting very extended from any sound base. Its 50 DMA line ($346.58) defines near-term support above prior highs in the $327 area.
>>> FEATURED STOCK ARTICLE : Pullback Breaks Streak of 8 Straight Gains Into New High Ground - 6/24/2020 |
View all notes |
Set NEW NOTE alert |
Company Profile |
SEC
News |
Chart |
Request a new note
C
A
S
I |
DOCU
-
NASDAQ
Docusign Inc
Computer Sftwr-Enterprse
|
$206.35
|
+8.60
4.35% |
$206.55
|
6,207,075
124.09% of 50 DAV
50 DAV is 5,002,000
|
$202.65
1.83%
|
6/10/2020
|
$149.73
|
PP = $152.10
|
|
MB = $159.71
|
Most Recent Note - 7/7/2020 5:58:20 PM
G - Hit yet another new all-time high today. Very extended from any sound base. Its 50 DMA line ($141.64) defines near-term support to watch on pullbacks. DOCU is now priced +111% above its 200 DMA price, and it is taught in the Certification that a stock trading +70-100% or more above the 200 DMA is to be recognized as a "sell signal".
>>> FEATURED STOCK ARTICLE : Rally From Ascending Base Leaves Stock Very Extended - 7/1/2020 |
View all notes |
Set NEW NOTE alert |
Company Profile |
SEC
News |
Chart |
Request a new note
C
A
S
I |
PING
-
NYSE
Ping Identity Hldg Corp
Computer Sftwr-Security
|
$32.88
|
+1.26
3.98% |
$33.25
|
1,420,700
106.50% of 50 DAV
50 DAV is 1,334,000
|
$35.36
-7.01%
|
6/1/2020
|
$29.24
|
PP = $29.90
|
|
MB = $31.40
|
Most Recent Note - 7/8/2020 6:12:28 PM
G - Posted a solid gain today after pulling back near its "max buy" level while encountering distributional pressure. Prior highs in the $29 area define initial support to watch.
>>> FEATURED STOCK ARTICLE : Gain for Recent New High Backed by +71% Above Average Volume - 6/22/2020 |
View all notes |
Set NEW NOTE alert |
Company Profile |
SEC
News |
Chart |
Request a new note
C
A
S
I |
AAXN
-
NASDAQ
Axon Enterprise Inc
Security/Sfty
|
$96.93
|
+0.87
0.91% |
$99.00
|
661,384
48.56% of 50 DAV
50 DAV is 1,362,000
|
$104.90
-7.60%
|
5/8/2020
|
$84.86
|
PP = $90.20
|
|
MB = $94.71
|
Most Recent Note - 7/7/2020 6:26:44 PM
G - Pulled back today with below average volume, yet it remains above its "max buy" level. Completed a new Public Offering on 6/17/20. Prior highs in the $90-91 area have acted as support following a powerful breakout. More damaging losses would raise concerns and trigger a technical sell signal.
>>> FEATURED STOCK ARTICLE : Completed New Pubic Offering and Found Support Near Prior High - 6/19/2020 |
View all notes |
Set NEW NOTE alert |
Company Profile |
SEC
News |
Chart |
Request a new note
C
A
S
I |
Symbol/Exchange
Company Name
Industry Group |
PRICE |
CHANGE
(%Change) |
Day High |
Volume
(% DAV)
(% 50 day avg vol) |
52 Wk Hi
% From Hi |
Featured
Date |
Price
Featured |
Pivot Featured |
|
Max Buy |
GDDY
-
NYSE
Godaddy Inc
Computer Sftwr-Enterprse
|
$70.88
|
+1.14
1.63% |
$71.58
|
2,058,257
132.60% of 50 DAV
50 DAV is 1,552,200
|
$84.49
-16.11%
|
6/2/2020
|
$79.62
|
PP = $82.40
|
|
MB = $86.52
|
Most Recent Note - 7/8/2020 6:06:36 PM
Still sputtering after violating its 50 DMA line ($75.20). Its Relative Strength rating has slumped to 72, below the 80+ minimum guideline for buy candidates. A rebound above the 50 DMA line is needed for its outlook to improve. Met stubborn resistance in the $82-84 area. It will be dropped from the Featured Stocks list tonight.
>>> FEATURED STOCK ARTICLE : Hit a New 52-Week High With Today's 8th Consecutive Gain - 6/23/2020 |
View all notes |
Set NEW NOTE alert |
Company Profile |
SEC
News |
Chart |
Request a new note
C
A
S
I |
|
|
|
THESE ARE NOT BUY RECOMMENDATIONS!
Comments contained in the body of this report are technical
opinions only. The material herein has been obtained
from sources believed to be reliable and accurate, however,
its accuracy and completeness cannot be guaranteed.
This site is not an investment advisor, hence it does
not endorse or recommend any securities or other investments.
Any recommendation contained in this report may not
be suitable for all investors and it is not to be deemed
an offer or solicitation on our part with respect to
the purchase or sale of any securities. All trademarks,
service marks and trade names appearing in this report
are the property of their respective owners, and are
likewise used for identification purposes only.
This report is a service available
only to active Paid Premium Members.
You may opt-out of receiving report notifications
at any time. Questions or comments may be submitted
by writing to Premium Membership Services 665 S.E. 10 Street, Suite 201 Deerfield Beach, FL 33441-5634 or by calling 1-800-965-8307
or 954-785-1121.
|
|
|