You are not logged in.
This means you
CAN ONLY VIEW reports that were published prior to Tuesday, February 20, 2024.
You
MUST UPGRADE YOUR MEMBERSHIP if you want to see any current reports.
AFTER MARKET UPDATE - MONDAY, JULY 6TH, 2020
Previous After Market Report Next After Market Report >>>
|
|
|
|
DOW |
+459.67 |
26,287.03 |
+1.78% |
|
Volume |
1,056,112,253 |
+18% |
|
Volume |
4,503,538,500 |
+13% |
|
NASDAQ |
+227.09 |
10,434.72 |
+2.22% |
|
Advancers |
2,062 |
70% |
|
Advancers |
2,187 |
65% |
|
S&P 500 |
+49.71 |
3,179.72 |
+1.59% |
|
Decliners |
902 |
30% |
|
Decliners |
1,176 |
35% |
|
Russell 2000 |
+11.02 |
1,442.88 |
+0.77% |
|
52 Wk Highs |
96 |
|
|
52 Wk Highs |
220 |
|
|
S&P 600 |
+7.94 |
831.89 |
+0.96% |
|
52 Wk Lows |
3 |
|
|
52 Wk Lows |
19 |
|
|
 |
Major Indices Rose With Greater Volume and More Leadership
Kenneth J. Gruneisen - Passed the CAN SLIM® Master's Exam
The Dow gained 459 points, while the S&P 500 rose 1.6%. The Nasdaq Composite advanced 2.2% to another record high. Breadth was positive as advancers led decliners by more than a 2-1 margin on the NYSE and by nearly 2-1 on the Nasdaq exchange. The reported volume totals were higher than the prior session on the NYSE and on the Nasdaq exchange as traders returned from the long weekend celebrating Independence Day . There were 90 high-ranked companies from the Leaders List that hit new 52-week highs and were listed on the BreakOuts Page, versus the total of 79 on the prior session. New 52-week highs totals expanded and solidly outnumbered new 52-week lows totals on both exchanges. The major indices are in a confirmed uptrend (M criteria). Any sustainable rally requires a healthy crop of new leaders, so it remains ever-important to see substantial new highs totals.Charts used courtesy of www.stockcharts.com
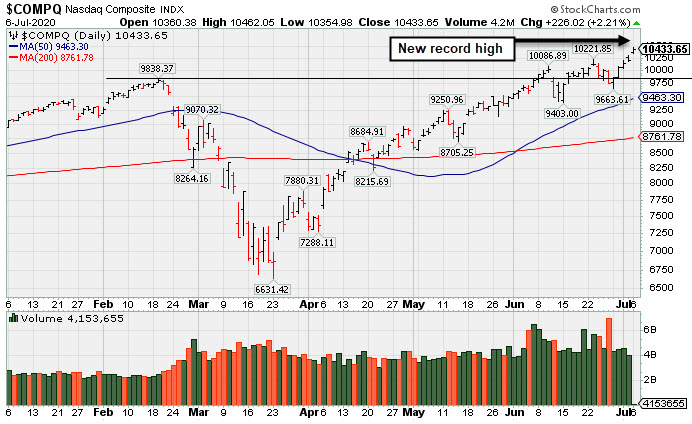
PICTURED: The Nasdaq Composite Index hit a new record high with a 4th consecutive gain and the tech-heavy index is +16.3% year-to-date.
Stocks finished firmly higher on Monday as data reports continued to support expectations for a strong economic recovery despite a recent uptick in COVID-19 cases in several pockets of the United States. Bullish sentiment from Beijing overnight also lifted the mood, with China’s Shanghai Composite notching its best single-session surge since 2015 after a state-owned newspaper published an editorial highlighting the importance of fostering a “healthy” bull market.
On the data front, a report from the Institute for Supply Management (ISM) showed the U.S. services sector rebounded into expansionary territory last month to its best level since February. Treasuries weakened slightly, with the yield on the 10-year note up one basis point to 0.68%.
Ten of 11 S&P 500 sectors closed in positive territory, with Utilities the sole laggard. Consumer Discretionary shares paced gains, with Amazon (AMZN +5.77%) surpassing the $3,000 mark for the first time. Tech and related names also outperformed. Square (SQ +4.92%) ended near the session low after hitting a new all-time high while extending a recent rally driven by more consumers utilizing the electronic payment company’s tools from home. Elsewhere, Tesla (TSLA +13.48%) jumped on the heels of an analyst price target increase. In M&A news, Berkshire Hathaway (BRKB +2.18%) class B shares were up after the conglomerate agreed to acquire Dominion Energy’s (D -11.00%) natural gas pipeline and storage asserts in a deal worth nearly $10 billion. Meanwhile, Uber Technologies (UBER +6.00%) rose after announcing a $2.65 billion all-stock deal to buy food-delivery service Postmates.
|
 Kenneth J. Gruneisen started out as a licensed stockbroker in August 1987, a couple of months prior to the historic stock market crash that took the Dow Jones Industrial Average down -22.6% in a single day. He has published daily fact-based fundamental and technical analysis on high-ranked stocks online for two decades. Through FACTBASEDINVESTING.COM, Kenneth provides educational articles, news, market commentary, and other information regarding proven investment systems that work in good times and bad.
Comments contained in the body of this report are technical opinions only and are not necessarily those of Gruneisen Growth Corp. The material herein has been obtained from sources believed to be reliable and accurate, however, its accuracy and completeness cannot be guaranteed. Our firm, employees, and customers may effect transactions, including transactions contrary to any recommendation herein, or have positions in the securities mentioned herein or options with respect thereto. Any recommendation contained in this report may not be suitable for all investors and it is not to be deemed an offer or solicitation on our part with respect to the purchase or sale of any securities. |
|
 |
Retail, Financial, Tech, and Commodity-Linked Groups Rose
Kenneth J. Gruneisen - Passed the CAN SLIM® Master's Exam
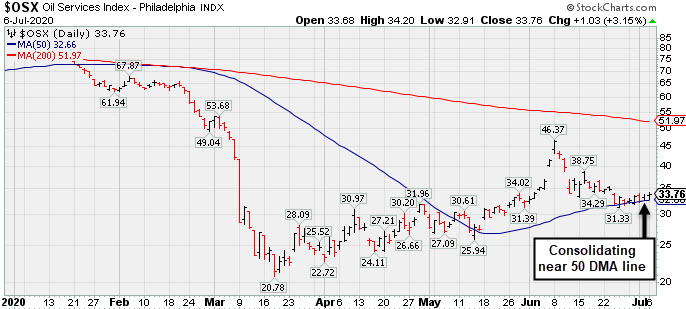
The Retail Index ($RLX +3.57%) posted a standout gain as the Broker/Dealer Index ($XBD +2.61%) and the Bank Index ($BKX +1.82%) also finished the session meaningfully higher. The tech sector had a positive bias as the Semiconductor Index ($SOX +2.67%) and the Networking Index ($NWX +2.48%) set a strong pace and the Biotech Index ($BTK +0.71%) also edged higher. Commodity-linked groups had a positive bias as the Integrated Oil Index ($XOI +0.77%) was outpaced by the Oil Services Index ($OSX +3.15%) and the Gold & Silver Index ($XAU +2.04%).
PICTURED: The Oil Services Index ($OSX +3.15%) is consolidating near its 50-day moving average (DMA) line.
| Oil Services |
$OSX |
33.76 |
+1.03 |
+3.15% |
-56.88% |
| Integrated Oil |
$XOI |
782.29 |
+6.00 |
+0.77% |
-38.43% |
| Semiconductor |
$SOX |
2,046.61 |
+53.00 |
+2.66% |
+10.65% |
| Networking |
$NWX |
553.63 |
+13.39 |
+2.48% |
-5.11% |
| Broker/Dealer |
$XBD |
276.43 |
+7.04 |
+2.61% |
-4.81% |
| Retail |
$RLX |
3,199.31 |
+110.16 |
+3.57% |
+30.62% |
| Gold & Silver |
$XAU |
129.65 |
+2.59 |
+2.04% |
+21.26% |
| Bank |
$BKX |
73.89 |
+1.32 |
+1.82% |
-34.82% |
| Biotech |
$BTK |
5,861.78 |
+41.15 |
+0.71% |
+15.68% |
|
|
|
 |
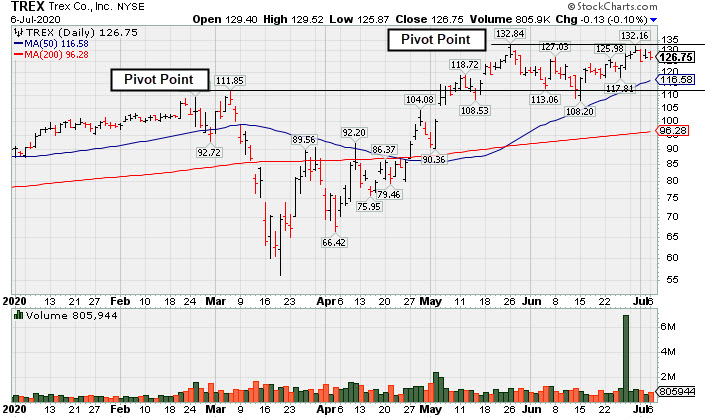
Quietly Perched Near All-Time High After Forming a New Base
Kenneth J. Gruneisen - Passed the CAN SLIM® Master's Exam
Trex Company Inc (TREX -$0.13 or -0.10% to $126.75) ended slightly lower today with a small loss on light volume. It has been challenging its all-time high. Subsequent volume-driven gains for new highs may trigger a new (or add-on) technical buy signal. Important near-term support is at its 50-day moving average (DMA) line ($116.58).
Fundamentals remain strong. It has earned the highest possible 99 Earnings Per Share Rating. TREX reported earnings +35% on +12% sales revenues for the Mar '20 quarter versus the year ago period, its 3rd consecutive quarterly comparison above the +25% minimum earnings guideline (C criteria). Annual earnings (A criteria) growth has been strong. The company hails from the General Building Materials industry group which currently has a Group Relative Strength Rating of B+.
The company has a new CEO as of 4/29/20. It has a small supply (S criteria) of only 57.9 million shares outstanding. The number of top-rated funds owning its shares rose from 540 in Jun '19 to 668 in Jun '20, a reassuring sign concerning the I criteria. Its current Up/Down Volume Ratio of 1.9 is an unbiased indication its shares have been under accumulation over the past 50 days. It has a Timeliness rating of A and a Sponsorship Rating of C.
|
|
|
Color Codes Explained :
Y - Better candidates highlighted by our
staff of experts.
G - Previously featured
in past reports as yellow but may no longer be buyable under the
guidelines.
***Last / Change / Volume data in this table is the closing quote data***
Symbol/Exchange
Company Name
Industry Group |
PRICE |
CHANGE
(%Change) |
Day High |
Volume
(% DAV)
(% 50 day avg vol) |
52 Wk Hi
% From Hi |
Featured
Date |
Price
Featured |
Pivot Featured |
|
Max Buy |
 FTNT
-
NASDAQ
FTNT
-
NASDAQ
Fortinet Inc
Computer Sftwr-Security
|
$139.70
|
+1.26
0.91% |
$142.66
|
1,235,227
72.92% of 50 DAV
50 DAV is 1,694,000
|
$149.69
-6.67%
|
6/22/2020
|
$142.68
|
PP = $149.79
|
|
MB = $157.28
|
 Most Recent Note - 7/6/2020 5:59:58 PM
Y - Quietly consolidating after finding prompt support at its 50 DMA line ($132.64) and above the prior low ($126.88 on 6/15/20). Subsequent gains above the pivot point backed by at least +40% above average volume are needed to trigger a new (or add-on) technical buy signal.
>>> FEATURED STOCK ARTICLE : Managed a "Positive Reversal" After Brief Dip Below "Max Buy" Level - 6/15/2020 |
View all notes |
Set NEW NOTE alert |
Company Profile |
SEC
News |
Chart |
Request a new note
C
A
S
I |
EBS
-
NYSE
Emergent Biosolutions
DRUGS - Biotechnology
|
$85.77
|
+1.69
2.01% |
$88.80
|
603,859
90.26% of 50 DAV
50 DAV is 669,000
|
$93.58
-8.35%
|
6/1/2020
|
$72.10
|
PP = $90.10
|
|
MB = $94.61
|
Most Recent Note - 7/6/2020 5:58:55 PM
G - Posted a 5th consecutive gain today with near average volume. Recent gains above the 50 DMA line helped its outlook improve. Still faces resistance due to overhead supply up to the $93 level. Fundamentals remain strong.
>>> FEATURED STOCK ARTICLE : Still Below 50-Day Moving Average Following Damaging Gap Down - 6/16/2020 |
View all notes |
Set NEW NOTE alert |
Company Profile |
SEC
News |
Chart |
Request a new note
C
A
S
I |
NBIX
-
NASDAQ
Neurocrine Biosciences
DRUGS - Biotechnology
|
$127.66
|
+2.29
1.83% |
$129.44
|
653,564
71.82% of 50 DAV
50 DAV is 910,000
|
$131.00
-2.55%
|
5/19/2020
|
$123.71
|
PP = $119.75
|
|
MB = $125.74
|
Most Recent Note - 7/6/2020 6:01:56 PM
G - Color code is changed to green after rising back above its "max buy" level. Prior highs in the $119 area define important near-term support to watch above its 50 DMA line ($116.72). Fundamentals remain strong.
>>> FEATURED STOCK ARTICLE : Pulled Back Below "Max Buy" Level With Loss on Average Volume - 6/30/2020 |
View all notes |
Set NEW NOTE alert |
Company Profile |
SEC
News |
Chart |
Request a new note
C
A
S
I |
BMRN
-
NASDAQ
Biomarin Pharmaceutical
DRUGS - Drug Manufacturers - Other
|
$127.71
|
+0.93
0.73% |
$128.42
|
1,261,632
74.56% of 50 DAV
50 DAV is 1,692,000
|
$128.77
-0.82%
|
6/17/2020
|
$110.95
|
PP = $112.67
|
|
MB = $118.30
|
Most Recent Note - 7/1/2020 6:16:01 PM
G - Posted a solid volume-driven gain today for another new all-time high, getting very extended from any sound base. Stubbornly held its ground after a streak of gains for new highs marked by heavy volume. Reported strong results for the Mar '20 quarter and recent comparisons showed improved earnings increases. Annual earnings (A criteria) history has been strong. Prior high ($112.57) defines initial support to watch on pullbacks.
>>> FEATURED STOCK ARTICLE : Hit New 52-Week High But Closed Below Pivot After 3-Weeks Tight - 6/17/2020 |
View all notes |
Set NEW NOTE alert |
Company Profile |
SEC
News |
Chart |
Request a new note
C
A
S
I |
AMD
-
NASDAQ
Advanced Micro Devices
ELECTRONICS - Semiconductor - Broad Line
|
$53.40
|
+1.06
2.03% |
$53.52
|
36,623,756
63.33% of 50 DAV
50 DAV is 57,826,000
|
$59.27
-9.90%
|
6/9/2020
|
$55.41
|
PP = $56.98
|
|
MB = $59.83
|
Most Recent Note - 7/6/2020 5:52:05 PM
G - Rebounded near its 50 DMA line ($53.59) with below average volume behind today's gain. Subsequent gains above the 50 DMA line are needed for its outlook to improve. Met stubborn resistance in the $57-59 area.
>>> FEATURED STOCK ARTICLE : Slump Below 50-Day Average Toward Prior Low Raises Concerns - 6/26/2020 |
View all notes |
Set NEW NOTE alert |
Company Profile |
SEC
News |
Chart |
Request a new note
C
A
S
I |
Symbol/Exchange
Company Name
Industry Group |
PRICE |
CHANGE
(%Change) |
Day High |
Volume
(% DAV)
(% 50 day avg vol) |
52 Wk Hi
% From Hi |
Featured
Date |
Price
Featured |
Pivot Featured |
|
Max Buy |
TREX
-
NYSE
Trex Company Inc
MATERIALS and CONSTRUCTION - General Building Materials
|
$126.75
|
-0.13
-0.10% |
$129.52
|
805,944
75.53% of 50 DAV
50 DAV is 1,067,000
|
$132.84
-4.58%
|
6/26/2020
|
$109.05
|
PP = $132.94
|
|
MB = $139.59
|
Most Recent Note - 7/6/2020 5:55:05 PM
Y - Quietly perched within close striking distance of its all-time high. Subsequent volume-driven gains for new highs may trigger a new (or add-on) technical buy signal. Important near-term support is at its 50 DMA line ($116.58). Fundamentals remain strong. See the latest FSU analysis for more details and a new annotated graph
>>> FEATURED STOCK ARTICLE : Quietly Perched Near All-Time High After Forming a New Base - 7/6/2020 |
View all notes |
Set NEW NOTE alert |
Company Profile |
SEC
News |
Chart |
Request a new note
C
A
S
I |
NFLX
-
NASDAQ
Netflix Inc
SPECIALTY RETAIL - Music and Video Stores
|
$493.81
|
+16.92
3.55% |
$499.50
|
7,787,126
119.78% of 50 DAV
50 DAV is 6,501,000
|
$492.28
0.31%
|
5/14/2020
|
$441.95
|
PP = $449.62
|
|
MB = $472.10
|
Most Recent Note - 7/6/2020 5:53:16 PM
G - Hit another new all-time high with today's volume-driven gain, getting extended from any sound base. Found support near its 50 DMA line ($437) during recent consolidations.
>>> FEATURED STOCK ARTICLE : Powered to New High on Prior Session With Volume Driven Gain - 7/2/2020 |
View all notes |
Set NEW NOTE alert |
Company Profile |
SEC
News |
Chart |
Request a new note
C
A
S
I |
CHGG
-
NYSE
Chegg Inc
Consumer Svcs-Education
|
$71.27
|
+1.07
1.52% |
$72.75
|
4,489,916
97.90% of 50 DAV
50 DAV is 4,586,000
|
$71.24
0.04%
|
6/17/2020
|
$63.71
|
PP = $68.08
|
|
MB = $71.48
|
Most Recent Note - 7/6/2020 5:57:39 PM
Y - Hit a new all-time high as it posted a 7th consecutive gain today with near average volume. Disciplined investors may note that the recent gains above the pivot point were not backed by the at least +40% above average volume necessary to trigger a convincing technical buy signal. Confirming gains above the pivot point backed by volume would be a reassuring sign of fresh institutional buying demand.
>>> FEATURED STOCK ARTICLE : Formed a Flat Base Perched Within Striking Distance of 52-Week High - 6/18/2020 |
View all notes |
Set NEW NOTE alert |
Company Profile |
SEC
News |
Chart |
Request a new note
C
A
S
I |
NOW
-
NYSE
Servicenow Inc
Computer Sftwr-Enterprse
|
$416.44
|
+2.23
0.54% |
$425.00
|
1,770,042
87.89% of 50 DAV
50 DAV is 2,014,000
|
$424.84
-1.98%
|
4/30/2020
|
$343.05
|
PP = $363.05
|
|
MB = $381.20
|
Most Recent Note - 7/6/2020 6:03:08 PM
G - Perched at its all-time high. It has not formed a sound base. Its 50 DMA line ($379) defines important near-term support to watch on pullbacks.
>>> FEATURED STOCK ARTICLE : Hovering Near All-Time High With Volume Totals Cooling - 6/25/2020 |
View all notes |
Set NEW NOTE alert |
Company Profile |
SEC
News |
Chart |
Request a new note
C
A
S
I |
TEAM
-
NASDAQ
Atlassian Corp Plc Cl A
Comp Sftwr-Spec Enterprs
|
$190.47
|
+0.39
0.21% |
$196.35
|
1,751,896
91.72% of 50 DAV
50 DAV is 1,910,000
|
$191.72
-0.65%
|
5/4/2020
|
$159.70
|
PP = $156.22
|
|
MB = $164.03
|
Most Recent Note - 7/1/2020 6:14:22 PM
G - Posted a big gain today with below average volume while building on an orderly consolidation above its 50 DMA line ($174). The next important near-term support is the prior low ($163.72 on 6/05/20).
>>> FEATURED STOCK ARTICLE : 50-Day Moving Average Defines Important Near-Term Support - 6/29/2020 |
View all notes |
Set NEW NOTE alert |
Company Profile |
SEC
News |
Chart |
Request a new note
C
A
S
I |
Symbol/Exchange
Company Name
Industry Group |
PRICE |
CHANGE
(%Change) |
Day High |
Volume
(% DAV)
(% 50 day avg vol) |
52 Wk Hi
% From Hi |
Featured
Date |
Price
Featured |
Pivot Featured |
|
Max Buy |
TTD
-
NASDAQ
The Trade Desk Inc Cl A
Comml Svcs-Advertising
|
$447.08
|
+4.15
0.94% |
$466.00
|
2,843,558
132.44% of 50 DAV
50 DAV is 2,147,000
|
$455.81
-1.92%
|
6/3/2020
|
$340.61
|
PP = $327.35
|
|
MB = $343.72
|
Most Recent Note - 7/2/2020 1:05:24 PM
G - Hitting yet another new 52-week high today, getting very extended from any sound base. Its 50 DMA line ($335) defines near-term support above prior highs in the $327 area.
>>> FEATURED STOCK ARTICLE : Pullback Breaks Streak of 8 Straight Gains Into New High Ground - 6/24/2020 |
View all notes |
Set NEW NOTE alert |
Company Profile |
SEC
News |
Chart |
Request a new note
C
A
S
I |
DOCU
-
NASDAQ
Docusign Inc
Computer Sftwr-Enterprse
|
$190.66
|
-0.33
-0.17% |
$199.45
|
6,475,084
133.26% of 50 DAV
50 DAV is 4,859,000
|
$199.49
-4.43%
|
6/10/2020
|
$149.73
|
PP = $152.10
|
|
MB = $159.71
|
Most Recent Note - 7/2/2020 12:53:05 PM
G - Spiking to a new all-time high today with above average volume. Very extended from any sound base. Its 50 DMA line ($138) defines near-term support to watch. DOCU is now priced +114% above its 200 DMA price, and it is taught in the Certification that a stock trading +70-100% or more above the 200 DMA is to be recognized as a "sell signal".
>>> FEATURED STOCK ARTICLE : Rally From Ascending Base Leaves Stock Very Extended - 7/1/2020 |
View all notes |
Set NEW NOTE alert |
Company Profile |
SEC
News |
Chart |
Request a new note
C
A
S
I |
PING
-
NYSE
Ping Identity Hldg Corp
Computer Sftwr-Security
|
$32.84
|
+0.35
1.08% |
$33.97
|
913,662
70.17% of 50 DAV
50 DAV is 1,302,000
|
$35.36
-7.13%
|
6/1/2020
|
$29.24
|
PP = $29.90
|
|
MB = $31.40
|
Most Recent Note - 7/1/2020 6:12:42 PM
G - Posted a solid gain today with below average volume and it is extended from the previously noted base. Prior highs in the $29 area define initial support to watch.
>>> FEATURED STOCK ARTICLE : Gain for Recent New High Backed by +71% Above Average Volume - 6/22/2020 |
View all notes |
Set NEW NOTE alert |
Company Profile |
SEC
News |
Chart |
Request a new note
C
A
S
I |
AAXN
-
NASDAQ
Axon Enterprise Inc
Security/Sfty
|
$99.64
|
-0.70
-0.70% |
$102.40
|
653,361
48.29% of 50 DAV
50 DAV is 1,353,000
|
$104.90
-5.01%
|
5/8/2020
|
$84.86
|
PP = $90.20
|
|
MB = $94.71
|
Most Recent Note - 7/2/2020 5:28:41 PM
G - Posted a 3rd consecutive small gain today with light volume. Completed a new Public Offering on 6/17/20. Prior highs in the $90-91 area have acted as support following a powerful breakout. More damaging losses would raise concerns and trigger a technical sell signal.
>>> FEATURED STOCK ARTICLE : Completed New Pubic Offering and Found Support Near Prior High - 6/19/2020 |
View all notes |
Set NEW NOTE alert |
Company Profile |
SEC
News |
Chart |
Request a new note
C
A
S
I |
GDDY
-
NYSE
Godaddy Inc
Computer Sftwr-Enterprse
|
$70.57
|
-0.73
-1.02% |
$72.40
|
1,791,907
118.60% of 50 DAV
50 DAV is 1,510,900
|
$84.49
-16.48%
|
6/2/2020
|
$79.62
|
PP = $82.40
|
|
MB = $86.52
|
Most Recent Note - 7/2/2020 5:24:03 PM
G - Slumped further today and met resistance after violating its 50 DMA line ($75) with damaging volume-driven losses. A prompt rebound above the 50 DMA line is needed to help its outlook improve. Subsequent gains above the pivot point backed by at least +40% above average volume are needed to clinch a convincing technical buy signal. It previously met stubborn resistance in the $82-84 area.
>>> FEATURED STOCK ARTICLE : Hit a New 52-Week High With Today's 8th Consecutive Gain - 6/23/2020 |
View all notes |
Set NEW NOTE alert |
Company Profile |
SEC
News |
Chart |
Request a new note
C
A
S
I |
Symbol/Exchange
Company Name
Industry Group |
PRICE |
CHANGE
(%Change) |
Day High |
Volume
(% DAV)
(% 50 day avg vol) |
52 Wk Hi
% From Hi |
Featured
Date |
Price
Featured |
Pivot Featured |
|
Max Buy |
|
|
|
THESE ARE NOT BUY RECOMMENDATIONS!
Comments contained in the body of this report are technical
opinions only. The material herein has been obtained
from sources believed to be reliable and accurate, however,
its accuracy and completeness cannot be guaranteed.
This site is not an investment advisor, hence it does
not endorse or recommend any securities or other investments.
Any recommendation contained in this report may not
be suitable for all investors and it is not to be deemed
an offer or solicitation on our part with respect to
the purchase or sale of any securities. All trademarks,
service marks and trade names appearing in this report
are the property of their respective owners, and are
likewise used for identification purposes only.
This report is a service available
only to active Paid Premium Members.
You may opt-out of receiving report notifications
at any time. Questions or comments may be submitted
by writing to Premium Membership Services 665 S.E. 10 Street, Suite 201 Deerfield Beach, FL 33441-5634 or by calling 1-800-965-8307
or 954-785-1121.
|
|
|