You are not logged in.
This means you
CAN ONLY VIEW reports that were published prior to Tuesday, February 20, 2024.
You
MUST UPGRADE YOUR MEMBERSHIP if you want to see any current reports.
AFTER MARKET UPDATE - WEDNESDAY, JULY 3RD, 2019
Previous After Market Report Next After Market Report >>>
|
|
|
|
DOW |
+179.32 |
26,966.00 |
+0.67% |
|
Volume |
506,721,880 |
-31% |
|
Volume |
1,536,144,234 |
-20% |
|
NASDAQ |
+61.14 |
8,170.23 |
+0.75% |
|
Advancers |
2,078 |
73% |
|
Advancers |
1,976 |
66% |
|
S&P 500 |
+22.81 |
2,995.82 |
+0.77% |
|
Decliners |
760 |
27% |
|
Decliners |
1,025 |
34% |
|
Russell 2000 |
+11.58 |
1,572.12 |
+0.74% |
|
52 Wk Highs |
244 |
|
|
52 Wk Highs |
163 |
|
|
S&P 600 |
+6.46 |
954.92 |
+0.68% |
|
52 Wk Lows |
22 |
|
|
52 Wk Lows |
45 |
|
|
 |
Major Indices Extend Rally for New Record Highs
Kenneth J. Gruneisen - Passed the CAN SLIM® Master's Exam
The Dow added 179 points to an all-time high of 26,966. The S&P 500 and Nasdaq Composite both climbed 0.8%, with each index notching a new record closing level. Thanks to the 1PM close, ahead of Independence Day, the volume totals reported were lighter on the NYSE and on the Nasdaq exchange. Breadth was positive as advancers led decliners by almost a 3-1 margin on the NYSE and nearly 2-1 on the Nasdaq exchange. There were 86 high-ranked companies from the Leaders List hit new 52-week highs and were listed on the BreakOuts Page, versus the total of 54 on the prior session. New 52-week highs totals expanded and easily outnumbered new 52-week lows on the NYSE and Nasdaq exchange. The major indices (M criteria) are in a "confirmed uptrend" under the fact-based system. The Featured Stocks Page provides the most timely analysis on high-ranked leaders. Charts used courtesy of www.stockcharts.com
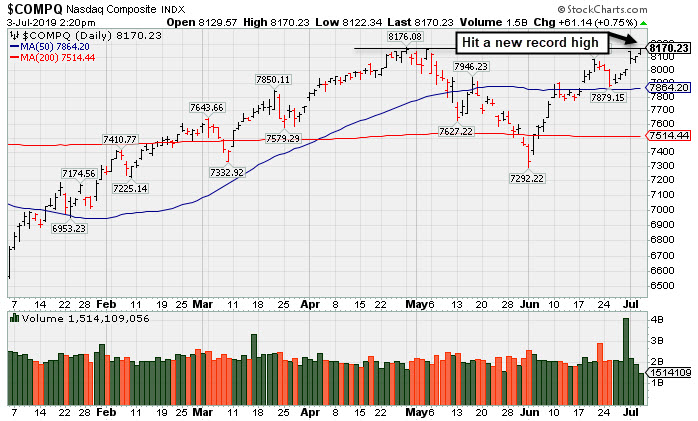
PICTURED: The Nasdaq Composite Index posted 6th consecutive gain and quietly finished at a new record high.
Stocks and Treasuries both advanced Wednesday as investors digested a slew of economic data releases during an abbreviated session. Trade relations were also in focus after White House trade advisor Peter Navarro suggested that negotiating a new deal with China “is a very complicated process,” and it “will take time.”
On the data front, ISM’s gauge of the U.S. service sector in June declined more than expected to the weakest level in nearly two years. A separate survey showed private payrolls increased by 102,000 in June, below projections of 140,000. An additional report showed the U.S. trade balance widened to a five-month high in May as imports surged the most since 2015. Another release showed factory orders fell 0.7% in May, below expectations of a 0.6% dip. Amid the soft data updates, the yield on the 10-year note fell three basis points to 1.95%, the lowest level since 2016.
All 11 S&P 500 sectors finished in positive territory amid light trading volume. In corporate news, Symantec (SYMC +14.39%) on news that the company has been engaged in takeover talks with Broadcom (AVGO). Tesla (TSLA +4.59%) rose after the electric car maker beat previous production and delivery records during the second quarter.
In commodities, WTI crude added 0.9% to $56.76/barrel despite a government report revealing U.S. crude inventories dropped less-than-anticipated last week. COMEX gold climbed 0.8% to $1,419.70/ounce. |
 Kenneth J. Gruneisen started out as a licensed stockbroker in August 1987, a couple of months prior to the historic stock market crash that took the Dow Jones Industrial Average down -22.6% in a single day. He has published daily fact-based fundamental and technical analysis on high-ranked stocks online for two decades. Through FACTBASEDINVESTING.COM, Kenneth provides educational articles, news, market commentary, and other information regarding proven investment systems that work in good times and bad.
Comments contained in the body of this report are technical opinions only and are not necessarily those of Gruneisen Growth Corp. The material herein has been obtained from sources believed to be reliable and accurate, however, its accuracy and completeness cannot be guaranteed. Our firm, employees, and customers may effect transactions, including transactions contrary to any recommendation herein, or have positions in the securities mentioned herein or options with respect thereto. Any recommendation contained in this report may not be suitable for all investors and it is not to be deemed an offer or solicitation on our part with respect to the purchase or sale of any securities. |
|
 |
Retail, Financial, Networking, and Biotech Indexes Rose
Kenneth J. Gruneisen - Passed the CAN SLIM® Master's Exam
The Retail Index ($RLX +0.62%), Broker/Dealer Index ($XBD +0.72%), and Bank Index ($BKX +0.73%) each ended the session higher. The Semiconductor Index ($SOX -0.43%) lost ground while the Biotech Index ($BTK +0.81%) and the Networking Index ($NWX +0.47%) both posted gains. Commodity-linked groups had a quiet day as the Gold & Silver Index ($XAU +0.24%) and the Integrated Oil Index ($XOI +0.26%) both ended slightly higher while the Oil Services Index ($OSX -0.03%) finished flat.
Charts courtesy of www.stockcharts.com
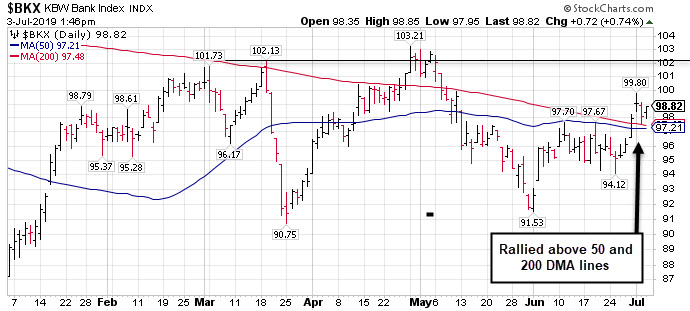 PICTURED 1: The Bank Index ($BKX +0.73%) posted a big gain on the shortened session, and its technical stance recently improved as it rebounded above its 50-day (blue) and 200-day (red) moving average (DMA) lines which are converging. It rallied to a new 2019 high in April, but rather than challenging a longer-term downward trendline it stalled and slumped back near the prior low..
Charts courtesy of www.stockcharts.com
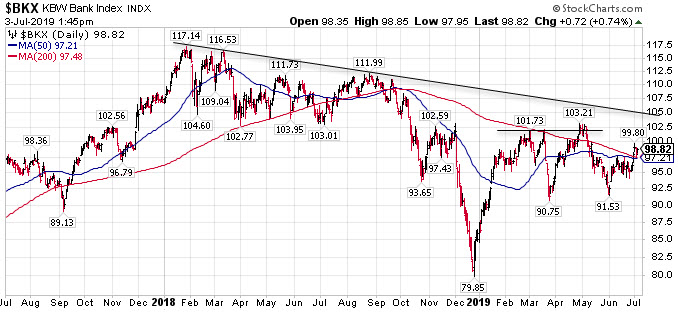 PICTURED 2: The Bank Index's 2-year chart illustrates where it is in relation to the longer-term downward trendline connecting the old 2018 highs. Our long-time readers know the importance of the financial indices as "leading indicators" because, as we have emphasized numerous times in years past, historic studies have shown that the major indices are prone to their most severe downdrafts when the financial indexes are already weak. From this point forward, further strengthening and continued progress for financial stocks will be very critical to the market rally. Meanwhile, any deterioration toward prior lows would not bode well for the broader market outlook.
| Oil Services |
$OSX |
79.30 |
-0.02 |
-0.03% |
-1.61% |
| Integrated Oil |
$XOI |
1,259.42 |
+3.28 |
+0.26% |
+8.66% |
| Semiconductor |
$SOX |
1,470.49 |
-6.34 |
-0.43% |
+27.30% |
| Networking |
$NWX |
578.55 |
+2.72 |
+0.47% |
+18.39% |
| Broker/Dealer |
$XBD |
269.60 |
+1.92 |
+0.72% |
+13.59% |
| Retail |
$RLX |
2,413.33 |
+14.84 |
+0.62% |
+23.67% |
| Gold & Silver |
$XAU |
84.05 |
+0.20 |
+0.24% |
+18.95% |
| Bank |
$BKX |
98.81 |
+0.71 |
+0.72% |
+15.18% |
| Biotech |
$BTK |
4,834.60 |
+39.04 |
+0.81% |
+14.54% |
|
|
|
 |
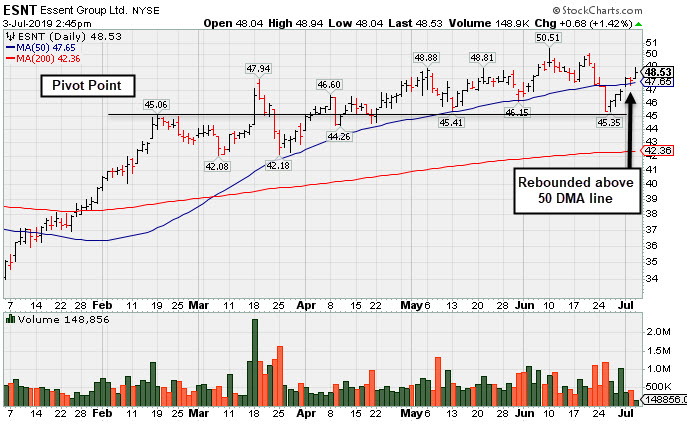
Rebounded Above 50 Day Moving Average After Violation
Kenneth J. Gruneisen - Passed the CAN SLIM® Master's Exam
Essent Group Ltd (ESNT +$0.83 or +1.73% to $48.68) rebounded above its 50-day moving average (DMA) line ($47.66) reassuringly after damaging volume-driven losses violated that important short-term average during the recent consolidation. It faces very little resistance due to overhead supply up to the $50 level.
It endured distributional pressure after last shown in this FSU section on 6/05/19 with an annotated graph under the headline, "Still Hovering Not Far From 52-Week High". Fundamental concerns were raised after It reported earnings +15% on +20% sales revenues for the Mar '19 quarter, breaking the prior streak of 4 consecutive comparisons above the +25% minimum earnings guideline (C criteria).
Its annual earnings (A criteria) history has been good since its $17 IPO on 10/31/13. ESNT was highlighted in yellow with new pivot point cited based on its 2/19/19 high in the 3/18/19 mid-day report (read here). The number of top-rated funds owning its shares rose from 317 in Mar '16 to 626 in Mar '19, a reassuring sign concerning the I criteria. Its current Up/Down Volume Ratio of 1.5 is an unbiased indication its shares have been under accumulation over the past 50 days.
|
|
|
Color Codes Explained :
Y - Better candidates highlighted by our
staff of experts.
G - Previously featured
in past reports as yellow but may no longer be buyable under the
guidelines.
***Last / Change / Volume data in this table is the closing quote data***
Symbol/Exchange
Company Name
Industry Group |
PRICE |
CHANGE
(%Change) |
Day High |
Volume
(% DAV)
(% 50 day avg vol) |
52 Wk Hi
% From Hi |
Featured
Date |
Price
Featured |
Pivot Featured |
|
Max Buy |
 SPSC
-
NASDAQ
SPSC
-
NASDAQ
S P S Commerce Inc
COMPUTER SOFTWARE and SERVICES - Application Software
|
$103.67
|
+0.93
0.91% |
$103.96
|
56,568
34.92% of 50 DAV
50 DAV is 162,000
|
$115.00
-9.85%
|
6/7/2019
|
$107.72
|
PP = $115.10
|
|
MB = $120.86
|
Most Recent Note - 7/1/2019
G - Recent lows in the $98-99 area define important near-term support to watch.Still sputtering below its 50 DMA line ($104.32). A rebound and subsequent volume-driven gains above the pivot point are needed to trigger a new (or add-on) technical buy signal. Faces some resistance due to overhead supply up to the $115 level. Fundamentals remain strong.
>>> FEATURED STOCK ARTICLE : Base Building Now Above 50-Day Moving Average Line - 6/7/2019 |
View all notes |
Set NEW NOTE alert |
Company Profile |
SEC
News |
Chart |
Request a new note
C
A
S
I |
EPAM
-
NYSE
Epam Systems Inc
COMPUTER SOFTWARE and SERVICES - Information Technology Service
|
$177.39
|
+0.26
0.15% |
$177.76
|
400,640
82.27% of 50 DAV
50 DAV is 487,000
|
$180.55
-1.75%
|
5/9/2019
|
$169.25
|
PP = $180.55
|
|
MB = $189.58
|
Most Recent Note - 7/1/2019 5:20:54 PM
Y - Gapped up today for a 4th consecutive gain but ended in the lower third of its intra-day range after challenging its 52-week high. Recently found support near its 50 DMA line ($172.59). Subsequent gains above the pivot point backed by at least +40% above average volume may trigger a new (or add-on) technical buy signal.
>>> FEATURED STOCK ARTICLE : Perched Near Pivot Point After a New Flat Base - 6/13/2019 |
View all notes |
Set NEW NOTE alert |
Company Profile |
SEC
News |
Chart |
Request a new note
C
A
S
I |
ENV
-
NYSE
Envestnet Inc
FINANCIAL SERVICES - Diversified Investments
|
$70.34
|
+0.86
1.24% |
$70.62
|
106,513
35.62% of 50 DAV
50 DAV is 299,000
|
$72.67
-3.21%
|
3/15/2019
|
$66.05
|
PP = $64.90
|
|
MB = $68.15
|
Most Recent Note - 7/2/2019 5:33:46 PM
G - Rebounded above its 50 DMA line ($68.94) with today's 4th consecutive gain. Prior lows in the $65-66 area define the next important near-term support to watch. Recently reported earnings +5% on +1% sales revenues for the Mar '19 quarter, below the +25% minimum earnings guideline (C criteria). See the latest FSU analysis for more details and a new annotated graph.
>>> FEATURED STOCK ARTICLE : Rebounded Above 50-Day Moving Average Line - 7/2/2019 |
View all notes |
Set NEW NOTE alert |
Company Profile |
SEC
News |
Chart |
Request a new note
C
A
S
I |
LHCG
-
NASDAQ
L H C Group Inc
HEALTH SERVICES - Home Health Care
|
$120.95
|
+0.53
0.44% |
$122.69
|
104,656
45.50% of 50 DAV
50 DAV is 230,000
|
$123.00
-1.67%
|
7/1/2019
|
$110.94
|
PP = $122.20
|
|
MB = $128.31
|
Most Recent Note - 7/1/2019 1:06:13 PM
Y - Touched a new all-time high earlier today following 4 consecutive gains marked by volume. Another new pivot point is cited based on its 5/20/19 high plus 10 cents. Subsequent gains above its pivot point backed by at least +40% above average volume may trigger a new (or add-on) technical buy signal. Its 50 DMA line ($114.57) defines near-term support above recent lows. Fundamentals remain strong.
>>> FEATURED STOCK ARTICLE : Prior Gains Lacked Volume; 50-Day Moving Average Defines Support - 6/17/2019 |
View all notes |
Set NEW NOTE alert |
Company Profile |
SEC
News |
Chart |
Request a new note
C
A
S
I |
ENSG
-
NASDAQ
Ensign Group Inc
HEALTH SERVICES - Long-Term Care Facilities
|
$57.84
|
+0.31
0.54% |
$57.94
|
97,954
31.70% of 50 DAV
50 DAV is 309,000
|
$58.88
-1.77%
|
4/30/2019
|
$51.46
|
PP = $53.30
|
|
MB = $55.97
|
Most Recent Note - 7/1/2019 5:16:54 PM
G - Touched a new high today. Its 50 DMA line ($54.24) and recent low ($52.34 on 5/31/19) define near-term support to watch. Recently reported earnings +22% on +12% sales revenues for the Mar '19 quarter, below the +25% minimum earnings guideline (C criteria), raising fundamental concerns. See the latest FSU analysis for more details and a new annotated graph.
>>> FEATURED STOCK ARTICLE : Nursing Facility Operator Touched New High - 7/1/2019 |
View all notes |
Set NEW NOTE alert |
Company Profile |
SEC
News |
Chart |
Request a new note
C
A
S
I |
Symbol/Exchange
Company Name
Industry Group |
PRICE |
CHANGE
(%Change) |
Day High |
Volume
(% DAV)
(% 50 day avg vol) |
52 Wk Hi
% From Hi |
Featured
Date |
Price
Featured |
Pivot Featured |
|
Max Buy |
CHDN
-
NASDAQ
Churchill Downs Inc
LEISURE - Gaming Activities
|
$118.03
|
+0.89
0.76% |
$118.71
|
113,907
33.11% of 50 DAV
50 DAV is 344,000
|
$117.77
0.22%
|
6/5/2019
|
$108.87
|
PP = $104.96
|
|
MB = $110.21
|
Most Recent Note - 7/1/2019 12:59:03 PM
G - Challenging its all-time high with today's 4th consecutive gain. Prior highs in the $104 area define initial support to watch above its 50 DMA line ($103). Share price was impacted by a 3:1 split when noted on 1/28/19.
>>> FEATURED STOCK ARTICLE : Consolidating Near 50-Day Moving Average - 6/29/2018 |
View all notes |
Set NEW NOTE alert |
Company Profile |
SEC
News |
Chart |
Request a new note
C
A
S
I |
WWD
-
NASDAQ
Woodward Inc
MANUFACTURING - Diversified Machinery
|
$114.88
|
+1.02
0.90% |
$115.41
|
250,428
44.17% of 50 DAV
50 DAV is 567,000
|
$116.46
-1.36%
|
6/18/2019
|
$112.34
|
PP = $114.65
|
|
MB = $120.38
|
Most Recent Note - 6/28/2019 5:57:36 PM
Y - Churned heavy volume today without making price progress, yet it remains perched near its all-time high. Subsequent gains above the pivot point backed by at least +40% above average volume may clinch a convincing technical buy signal. Fundamentals remain strong.
>>> FEATURED STOCK ARTICLE : High Ranked Industrial Firm Perched Near All-Time High - 6/18/2019 |
View all notes |
Set NEW NOTE alert |
Company Profile |
SEC
News |
Chart |
Request a new note
C
A
S
I |
LULU
-
NASDAQ
Lululemon Athletica
MANUFACTURING - Textile Manufacturing
|
$183.99
|
+3.13
1.73% |
$184.47
|
1,170,639
53.90% of 50 DAV
50 DAV is 2,172,000
|
$190.52
-3.43%
|
6/13/2019
|
$174.48
|
PP = $179.60
|
|
MB = $188.58
|
Most Recent Note - 7/1/2019
Y - Consolidating near the prior high ($179.50 on 4/24/19) and above its 50 DMA line ($175.11) which defines important support above the prior low ($160.88 on 5/29/19). Reported Apr '19 quarterly earnings +35% on +20% sales revenues versus the ear ago period.
>>> FEATURED STOCK ARTICLE : Perched Near High Following Another Strong Earnings Report - 6/14/2019 |
View all notes |
Set NEW NOTE alert |
Company Profile |
SEC
News |
Chart |
Request a new note
C
A
S
I |
ULTA
-
NASDAQ
Ulta Beauty Inc
SPECIALTY RETAIL - Specialty Retail, Other
|
$345.43
|
+4.10
1.20% |
$346.00
|
328,347
42.87% of 50 DAV
50 DAV is 766,000
|
$365.54
-5.50%
|
3/15/2019
|
$341.27
|
PP = $322.59
|
|
MB = $338.72
|
Most Recent Note - 7/1/2019 1:20:47 PM
G - Reversed today's early gain slumping back below its 50 DMA line ($343.94). Recently noted action indicative of distributional pressure after wedging higher with gains backed by lackluster volume as touched a new all-time high. Reported earnings +17% on +13% sales revenues for the Apr '19 quarter, below the +25% minimum earnings guideline (C criteria), raising fundamental concerns.
>>> FEATURED STOCK ARTICLE : Sputtering Below 50-Day Moving Average Following Sub Par Earnings - 6/6/2019 |
View all notes |
Set NEW NOTE alert |
Company Profile |
SEC
News |
Chart |
Request a new note
C
A
S
I |
ESNT
-
NYSE
Essent Group Ltd
Finance-MrtgandRel Svc
|
$48.68
|
+0.83
1.73% |
$48.94
|
206,363
32.70% of 50 DAV
50 DAV is 631,000
|
$50.51
-3.62%
|
3/18/2019
|
$45.84
|
PP = $45.06
|
|
MB = $47.31
|
 Most Recent Note - 7/3/2019 2:59:27 PM
G - Rebounded further above its 50 DMA line ($47.66 ) and little resistance remains due to overhead supply. Recently reported earnings +15% on +20% sales revenues for the Mar '19 quarter, below the +25% minimum earnings guideline (C criteria), raising fundamental concerns.
>>> FEATURED STOCK ARTICLE : Rebounded Above 50 Day Moving Average After Violation - 7/3/2019 |
View all notes |
Set NEW NOTE alert |
Company Profile |
SEC
News |
Chart |
Request a new note
C
A
S
I |
Symbol/Exchange
Company Name
Industry Group |
PRICE |
CHANGE
(%Change) |
Day High |
Volume
(% DAV)
(% 50 day avg vol) |
52 Wk Hi
% From Hi |
Featured
Date |
Price
Featured |
Pivot Featured |
|
Max Buy |
NOW
-
NYSE
Servicenow Inc
Computer Sftwr-Enterprse
|
$293.15
|
+4.84
1.68% |
$294.23
|
1,074,540
60.16% of 50 DAV
50 DAV is 1,786,000
|
$292.98
0.06%
|
4/22/2019
|
$242.64
|
PP = $251.75
|
|
MB = $264.34
|
Most Recent Note - 7/1/2019 1:09:35 PM
G - Perched near its all-time high, extended from an sound base. Its 50 DMA line ($269) defines near-term support to watch. Recently reported earnings +20% on +34% sales revenues for the Mar '19 quarter, below the +25% minimum earnings guideline (C criteria), raising fundamental concerns.
>>> FEATURED STOCK ARTICLE : Pulling Back After Wedging to New Highs - 6/26/2019 |
View all notes |
Set NEW NOTE alert |
Company Profile |
SEC
News |
Chart |
Request a new note
C
A
S
I |
VEEV
-
NYSE
Veeva Systems Inc Cl A
Computer Sftwr-Medical
|
$168.68
|
+2.08
1.25% |
$168.73
|
763,148
50.04% of 50 DAV
50 DAV is 1,525,000
|
$173.65
-2.86%
|
5/30/2019
|
$154.32
|
PP = $145.80
|
|
MB = $153.09
|
Most Recent Note - 7/2/2019 5:36:24 PM
G -Posted a 4th consecutive gain today. It remains very extended from any sound base. Its 50 DMA line ($150.78) defines near-term support. Reported earnings +52% on +25% sales revenues for the Apr '19 quarter, marking its 5th strong quarter with earnings above the +25% minimum guideline (C criteria).
>>> FEATURED STOCK ARTICLE : Halted Slide After 4 Volume-Driven Losses From High - 6/27/2019 |
View all notes |
Set NEW NOTE alert |
Company Profile |
SEC
News |
Chart |
Request a new note
C
A
S
I |
PAYC
-
NYSE
Paycom Software Inc
COMPUTER SOFTWARE and SERVICES - Application Software
|
$235.74
|
+2.82
1.21% |
$237.39
|
409,454
51.25% of 50 DAV
50 DAV is 799,000
|
$233.43
0.99%
|
2/6/2019
|
$171.66
|
PP = $164.18
|
|
MB = $172.39
|
Most Recent Note - 7/2/2019 5:42:28 PM
G - Posted a 4th consecutive gain today and ended near its all-time high. Its 50 DMA line ($211) defines near-term support to watch above the recent low ($194.84 on 6/03/19). Reported earnings +25% on +30% sales revenues for the Mar '19 quarter.
>>> FEATURED STOCK ARTICLE : Perched Near High Extended From Any Sound Base - 6/28/2019 |
View all notes |
Set NEW NOTE alert |
Company Profile |
SEC
News |
Chart |
Request a new note
C
A
S
I |
PYPL
-
NASDAQ
Paypal Holdings Inc
Finance-CrdtCard/PmtPr
|
$117.68
|
+1.51
1.30% |
$117.72
|
3,007,376
52.16% of 50 DAV
50 DAV is 5,766,000
|
$119.95
-1.89%
|
1/24/2019
|
$92.56
|
PP = $93.80
|
|
MB = $98.49
|
Most Recent Note - 7/2/2019 5:35:06 PM
G - Posted a 3rd consecutive gain and it remains perched near its all-time high. Did not form a sound base, yet promptly rebounded after violating its 50 DMA line and prior low ($106.52) on 6/03/19. Recently reported earnings +37% on +12% sales revenues for the Mar '19 quarter, continuing its strong earnings track record.
>>> FEATURED STOCK ARTICLE : Popular Payments Firm Extended From Any Sound Base - 6/19/2019 |
View all notes |
Set NEW NOTE alert |
Company Profile |
SEC
News |
Chart |
Request a new note
C
A
S
I |
PLNT
-
NYSE
Planet Fitness Inc Cl A
Leisure-Services
|
$76.94
|
+0.89
1.17% |
$77.25
|
745,947
43.04% of 50 DAV
50 DAV is 1,733,000
|
$81.90
-6.06%
|
11/7/2018
|
$57.10
|
PP = $55.45
|
|
MB = $58.22
|
Most Recent Note - 7/1/2019 1:12:39 PM
G - Its 50 DMA line may act as resistance while a rebound above the 50 DMA line ($76.41) is needed for its outlook to improve. Fundamentals remain strong.
>>> FEATURED STOCK ARTICLE : Undercut 50-Day Moving Average With Volume Behind Losses - 6/21/2019 |
View all notes |
Set NEW NOTE alert |
Company Profile |
SEC
News |
Chart |
Request a new note
C
A
S
I |
Symbol/Exchange
Company Name
Industry Group |
PRICE |
CHANGE
(%Change) |
Day High |
Volume
(% DAV)
(% 50 day avg vol) |
52 Wk Hi
% From Hi |
Featured
Date |
Price
Featured |
Pivot Featured |
|
Max Buy |
BLD
-
NYSE
Topbuild Corp
Bldg-Constr Prds/Misc
|
$82.12
|
+0.93
1.15% |
$82.54
|
164,913
48.50% of 50 DAV
50 DAV is 340,000
|
$86.96
-5.57%
|
5/17/2019
|
$82.19
|
PP = $87.31
|
|
MB = $91.68
|
Most Recent Note - 6/28/2019 5:59:36 PM
Y - Posted a solid gain today after finding prompt support at its 50 DMA line ($78.48) this week. Ended perched within striking distance of its 52-week high. Subsequent gains above the pivot point backed by at least +40% above average volume may trigger a technical buy signal. Fundamentals remain strong.
>>> FEATURED STOCK ARTICLE : Found Support at 50-Day Moving Averge Line - 6/20/2019 |
View all notes |
Set NEW NOTE alert |
Company Profile |
SEC
News |
Chart |
Request a new note
C
A
S
I |
TEAM
-
NASDAQ
Atlassian Corp Plc Cl A
Comp Sftwr-Spec Enterprs
|
$133.36
|
-0.39
-0.29% |
$135.16
|
810,553
51.99% of 50 DAV
50 DAV is 1,559,000
|
$137.78
-3.21%
|
5/24/2019
|
$129.52
|
PP = $132.09
|
|
MB = $138.69
|
Most Recent Note - 7/1/2019 1:17:55 PM
Y - Volume totals in recent weeks have been mostly below average while remaining perched near its all-time high. The 50 DMA line ($123) and prior low ($115.87 on 6/03/19) define important near-term support to watch. Reported earnings +133% on +38% sales revenues for the Mar '19 quarter, continuing its strong earnings track record.
>>> FEATURED STOCK ARTICLE : Perched at High After Wedging into New High Territory - 6/24/2019 |
View all notes |
Set NEW NOTE alert |
Company Profile |
SEC
News |
Chart |
Request a new note
C
A
S
I |
UPLD
-
NASDAQ
Upland Software Inc
Computer Sftwr-Enterprse
|
$46.74
|
+0.70
1.52% |
$46.93
|
135,350
22.45% of 50 DAV
50 DAV is 603,000
|
$54.87
-14.82%
|
6/10/2019
|
$53.30
|
PP = $50.74
|
|
MB = $53.28
|
Most Recent Note - 7/1/2019 1:23:02 PM
G - Halted its slide last week, however, a rebound above the 50 DMA line ($47.04) is needed for its outlook to improve. That important short-term average may act as resistance. Completed a new Public Offering on 5/08/19. Quarterly comparisons through Mar '19 have shown impressive sales revenues growth and greatly improved earnings increases above the +25% minimum guideline (C criteria).
>>> FEATURED STOCK ARTICLE : Rose From an Advanced Ascending Base - 6/10/2019 |
View all notes |
Set NEW NOTE alert |
Company Profile |
SEC
News |
Chart |
Request a new note
C
A
S
I |
GLOB
-
NYSE
Globant SA
Computer-Tech Services
|
$104.27
|
+0.88
0.85% |
$105.00
|
174,911
40.96% of 50 DAV
50 DAV is 427,000
|
$105.33
-1.01%
|
2/15/2019
|
$69.35
|
PP = $70.00
|
|
MB = $73.50
|
Most Recent Note - 7/1/2019 1:00:08 PM
G - Perched near its all-time high, very extended from any sound base. Its 50 DMA line ($90.41) defines important support where a violation would raise concerns and trigger a technical sell signal. Fundamentals remain strong.
>>> FEATURED STOCK ARTICLE : Posted Big Gain for Another New High Close - 6/12/2019 |
View all notes |
Set NEW NOTE alert |
Company Profile |
SEC
News |
Chart |
Request a new note
C
A
S
I |
PAGS
-
NYSE
Pagseguro Digital Cl A
Finance-CrdtCard/PmtPr
|
$40.36
|
+0.84
2.13% |
$40.82
|
1,238,341
58.33% of 50 DAV
50 DAV is 2,123,000
|
$40.36
0.00%
|
6/25/2019
|
$37.69
|
PP = $40.07
|
|
MB = $42.07
|
Most Recent Note - 7/2/2019 5:40:55 PM
Y - Posted a gain today with below average volume and ended near the session high for a best-ever close. It was highlighted in yellow with pivot point cited based on its 3/29/18 high plus 10 cents in the 6/25/19 mid-day report. Faces no resistance due to overhead. Subsequent volume-driven gains for new highs may trigger a technical buy signal. Quarterly comparisons through Mar '19 showed earnings increases above the +25% minimum guideline (C criteria), however, sequential comparisons have shown deceleration in its sales revenues and earnings growth rate. Limited history for this Brazil-based firm is also a concern. Completed its $21.50 IPO on 1/24/18.
>>> FEATURED STOCK ARTICLE : Brazilian Payment Tech Firm Perched Near High - 6/25/2019 |
View all notes |
Set NEW NOTE alert |
Company Profile |
SEC
News |
Chart |
Request a new note
C
A
S
I |
Symbol/Exchange
Company Name
Industry Group |
PRICE |
CHANGE
(%Change) |
Day High |
Volume
(% DAV)
(% 50 day avg vol) |
52 Wk Hi
% From Hi |
Featured
Date |
Price
Featured |
Pivot Featured |
|
Max Buy |
|
|
|
THESE ARE NOT BUY RECOMMENDATIONS!
Comments contained in the body of this report are technical
opinions only. The material herein has been obtained
from sources believed to be reliable and accurate, however,
its accuracy and completeness cannot be guaranteed.
This site is not an investment advisor, hence it does
not endorse or recommend any securities or other investments.
Any recommendation contained in this report may not
be suitable for all investors and it is not to be deemed
an offer or solicitation on our part with respect to
the purchase or sale of any securities. All trademarks,
service marks and trade names appearing in this report
are the property of their respective owners, and are
likewise used for identification purposes only.
This report is a service available
only to active Paid Premium Members.
You may opt-out of receiving report notifications
at any time. Questions or comments may be submitted
by writing to Premium Membership Services 665 S.E. 10 Street, Suite 201 Deerfield Beach, FL 33441-5634 or by calling 1-800-965-8307
or 954-785-1121.
|
|
|