You are not logged in.
This means you
CAN ONLY VIEW reports that were published prior to Saturday, February 24, 2024.
You
MUST UPGRADE YOUR MEMBERSHIP if you want to see any current reports.
AFTER MARKET UPDATE - WEDNESDAY, JULY 1ST, 2020
Previous After Market Report Next After Market Report >>>
|
|
|
|
DOW |
-77.91 |
25,734.97 |
-0.30% |
|
Volume |
928,677,141 |
-24% |
|
Volume |
4,591,211,400 |
+3% |
|
NASDAQ |
+93.85 |
10,152.62 |
+0.93% |
|
Advancers |
1,510 |
52% |
|
Advancers |
1,495 |
45% |
|
S&P 500 |
+15.57 |
3,115.86 |
+0.50% |
|
Decliners |
1,411 |
48% |
|
Decliners |
1,855 |
55% |
|
Russell 2000 |
-14.05 |
1,427.31 |
-0.97% |
|
52 Wk Highs |
50 |
|
|
52 Wk Highs |
110 |
|
|
S&P 600 |
-12.07 |
819.82 |
-1.45% |
|
52 Wk Lows |
2 |
|
|
52 Wk Lows |
14 |
|
|
 |
Major indices Ended Mixed as Mega-Cap Tech Shares Led Market
Kenneth J. Gruneisen - Passed the CAN SLIM® Master's Exam
The Dow lost 77 points, while the S&P 500 rose 0.5%. The Nasdaq Composite gained 1.0% and closed at an all-time high. Breadth was mixed advancers narrowly led decliners on the NYSE but decliners led advancers by 9-7 on the Nasdaq exchange. The reported volume totals were mixed, lighter than the prior session on the NYSE and higher on the Nasdaq exchange. There were 44 high-ranked companies from the Leaders List that hit new 52-week highs and were listed on the BreakOuts Page, versus the total of 38 on the prior session. New 52-week highs totals outnumbered new 52-week lows totals on both exchanges. The major indices are still in a confirmed uptrend (M criteria). Any sustainable rally requires a healthy crop of new leaders, so it remains important to see the new highs totals stabilize and improve.Charts used courtesy of www.stockcharts.com
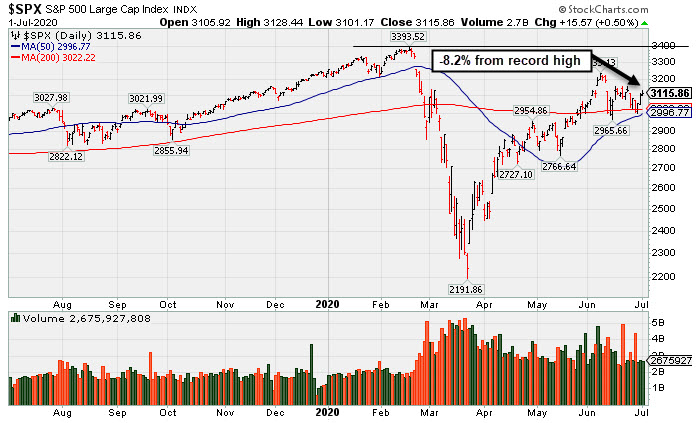
PICTURED: The S&P 500 Index is -8.2% off its record high. It has found support above its 50-day and 200-day moving average (DMA) lines.
Stocks finished the session mixed Wednesday as investors digested positive news surrounding a potential COVID-19 vaccine and positive economic data. Eight of 11 S&P 500 sectors ended the day in positive territory with Real Estate stocks pacing the gains. Mega-cap companies also outperformed with Amazon (AMZN +4.35%), Netflix (NFLX (+6.72%), and Facebook (FB +4.62%) all rallying for considerable gains. In corporate news, Pfizer (PFE +3.18%) rose after sharing an optimistic update on its coronavirus vaccine being developed with German company BioNTech (BNTX-3.90%). In earnings, FedEx (FDX +11.72%) rallied after delivering stronger-than-expected quarterly profit and revenue figures.
On the data front, the ISM’s manufacturing gauge surprised to the upside, showing sector activity in the U.S. returned to expansionary territory in June. The PMI reading reached a 14-month high of 52.6, up from 43.1 in May, representing the largest uptick in 40 years. Separately, the ADP employment report revealed the U.S. added 2.3 million private jobs in June, slightly below expectations, though the prior month’s figure was upwardly revised to a more than 3 million from an originally reported 2.7 million decline. In central bank news, the Federal Reserve’s meeting minutes from June showed multiple participants view the economy needing additional support ”for some time.”
Treasuries weakened, with the yield on the 10-year note adding two basis points to 0.67%. In commodities, WTI crude gained 1.1% to $39.71/barrel, while gold declined 1.1% to $1,781.00/ounce to slip from an eight year high.
|
 Kenneth J. Gruneisen started out as a licensed stockbroker in August 1987, a couple of months prior to the historic stock market crash that took the Dow Jones Industrial Average down -22.6% in a single day. He has published daily fact-based fundamental and technical analysis on high-ranked stocks online for two decades. Through FACTBASEDINVESTING.COM, Kenneth provides educational articles, news, market commentary, and other information regarding proven investment systems that work in good times and bad.
Comments contained in the body of this report are technical opinions only and are not necessarily those of Gruneisen Growth Corp. The material herein has been obtained from sources believed to be reliable and accurate, however, its accuracy and completeness cannot be guaranteed. Our firm, employees, and customers may effect transactions, including transactions contrary to any recommendation herein, or have positions in the securities mentioned herein or options with respect thereto. Any recommendation contained in this report may not be suitable for all investors and it is not to be deemed an offer or solicitation on our part with respect to the purchase or sale of any securities. |
|
 |
Retail and Biotech Indexes Led Group Gainers
Kenneth J. Gruneisen - Passed the CAN SLIM® Master's Exam
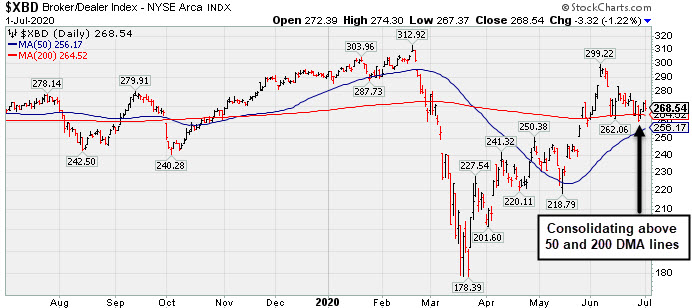
The Retail Index ($RLX +2.58%) rose as the Broker/Dealer Index ($XBD -1.22%) and the Bank Index ($BKX -2.72%) each suffered losses. Energy-linked groups also slumped as the Integrated Oil Index ($XOI -2.47%) and the Oil Services Index ($OSX -2.90%) each posted solid losses. The Gold & Silver Index ($XAU -0.37%) edged lower. The tech sector was mixed as the Semiconductor Index ($SOX -1.48%) and the Networking Index ($NWX -1.69%) fell while the Biotech Index ($BTK +1.17%) posted a gain.
PICTURED: The Broker/Dealer Index ($XBD +1.51%) has found support above its 50-day and 200-day moving average (DMA) lines.
| Oil Services |
$OSX |
32.41 |
-0.97 |
-2.91% |
-58.60% |
| Integrated Oil |
$XOI |
764.81 |
-19.40 |
-2.47% |
-39.80% |
| Semiconductor |
$SOX |
1,966.43 |
-30.01 |
-1.50% |
+6.32% |
| Networking |
$NWX |
538.58 |
-9.28 |
-1.69% |
-7.68% |
| Broker/Dealer |
$XBD |
268.54 |
-3.32 |
-1.22% |
-7.52% |
| Retail |
$RLX |
3,076.30 |
+77.48 |
+2.58% |
+25.60% |
| Gold & Silver |
$XAU |
128.68 |
-0.48 |
-0.37% |
+20.35% |
| Bank |
$BKX |
72.52 |
-2.01 |
-2.70% |
-36.03% |
| Biotech |
$BTK |
5,785.50 |
+67.16 |
+1.17% |
+14.17% |
|
|
|
 |
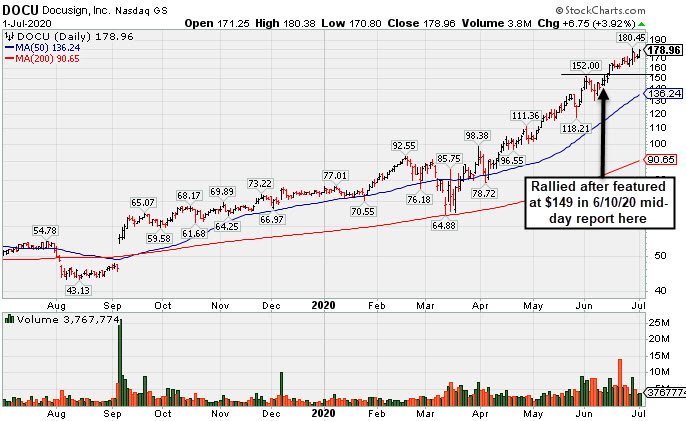
Rally From Ascending Base Leaves Stock Very Extended
Kenneth J. Gruneisen - Passed the CAN SLIM® Master's Exam
Docusign Inc (DOCU +$6.75 or +3.92% to $178.96) finished at a best-ever close with a gain today on below average volume. It is very extended from any sound base. Prior high ($152 on 6/02/20) defines initial support to watch well above its 50-day moving average (DMA) line ($136.24. DOCU is now priced +97% above its 200 DMA price ($90.65), and it is taught in the Certification that a stock trading +70-100% or more above the 200 DMA is to be recognized as a "sell signal".
DOCU was last shown in this FSU section on 6/10/20 with an annotated graph under the headline, "Advanced Ascending Base Formed for Strong E-Signature Firm". It was highlighted in yellow in the earlier mid-day report (read here) with pivot point cited based on its 5/02/20 high plus 10 cents after forming an advanced "ascending base" marked by 3 pullbacks of 10-20% during its ongoing ascent.
It has an Earnings Per Share Rating of 84, above the 80+ minimum for buy candidates. Recently it reported earnings +71% on +39% sales revenues for the Apr '20 quarter versus the year ago period. Three of the past 4 quarterly comparisons versus the year ago period were above the +25% minimum guideline with solid underlying sales revenues growth. After years of losses it had solid earnings in FY '19 and '20.
The number of top-rated funds owning its shares rose from 558 on Jun '19 to 904 in Mar '20, a reassuring sign concerning the I criteria. Its current Up/Down Volume Ratio of 1.4 also is an unbiased indication its shares have been under accumulation over the past 50 days. The Computer Software-Enterprise industry group is currently ranked 1st of the 197 Industry Groups (L criteria).
|
|
|
Color Codes Explained :
Y - Better candidates highlighted by our
staff of experts.
G - Previously featured
in past reports as yellow but may no longer be buyable under the
guidelines.
***Last / Change / Volume data in this table is the closing quote data***
Symbol/Exchange
Company Name
Industry Group |
PRICE |
CHANGE
(%Change) |
Day High |
Volume
(% DAV)
(% 50 day avg vol) |
52 Wk Hi
% From Hi |
Featured
Date |
Price
Featured |
Pivot Featured |
|
Max Buy |
 FTNT
-
NASDAQ
FTNT
-
NASDAQ
Fortinet Inc
Computer Sftwr-Security
|
$139.22
|
+1.95
1.42% |
$139.86
|
1,239,154
70.93% of 50 DAV
50 DAV is 1,747,000
|
$149.69
-6.99%
|
6/22/2020
|
$142.68
|
PP = $149.79
|
|
MB = $157.28
|
Most Recent Note - 6/30/2020 5:47:10 PM
Y - Found prompt support at its 50 DMA line ($130) and above the prior low ($126.88 on 6/15/20). Subsequent gains above the pivot point backed by at least +40% above average volume are needed to trigger a new (or add-on) technical buy signal.
>>> FEATURED STOCK ARTICLE : Managed a "Positive Reversal" After Brief Dip Below "Max Buy" Level - 6/15/2020 |
View all notes |
Set NEW NOTE alert |
Company Profile |
SEC
News |
Chart |
Request a new note
C
A
S
I |
EBS
-
NYSE
Emergent Biosolutions
DRUGS - Biotechnology
|
$81.91
|
+2.83
3.58% |
$82.72
|
447,062
67.33% of 50 DAV
50 DAV is 664,000
|
$93.58
-12.47%
|
6/1/2020
|
$72.10
|
PP = $90.10
|
|
MB = $94.61
|
Most Recent Note - 6/30/2020 5:45:59 PM
G - Today's gain above the 50 DMA line helped its outlook improve. Still faces resistance due to overhead supply up to the $93 level. Fundamentals remain strong.
>>> FEATURED STOCK ARTICLE : Still Below 50-Day Moving Average Following Damaging Gap Down - 6/16/2020 |
View all notes |
Set NEW NOTE alert |
Company Profile |
SEC
News |
Chart |
Request a new note
C
A
S
I |
NBIX
-
NASDAQ
Neurocrine Biosciences
DRUGS - Biotechnology
|
$125.84
|
+3.84
3.15% |
$125.98
|
1,077,746
118.04% of 50 DAV
50 DAV is 913,000
|
$131.00
-3.94%
|
5/19/2020
|
$123.71
|
PP = $119.75
|
|
MB = $125.74
|
Most Recent Note - 6/30/2020 5:41:13 PM
Y - Pulled back below its "max buy" level with a loss today on average volume and its color code is changed to yellow. Retreating from its all-time high following volume-driven gains. Prior highs in the $119 area define important near-term support to watch above its 50 DMA line ($114.87). Fundamentals remain strong. See the latest FSU analysis for more details and a new annotated graph.
>>> FEATURED STOCK ARTICLE : Pulled Back Below "Max Buy" Level With Loss on Average Volume - 6/30/2020 |
View all notes |
Set NEW NOTE alert |
Company Profile |
SEC
News |
Chart |
Request a new note
C
A
S
I |
BMRN
-
NASDAQ
Biomarin Pharmaceutical
DRUGS - Drug Manufacturers - Other
|
$125.84
|
+2.50
2.03% |
$128.77
|
2,152,025
128.79% of 50 DAV
50 DAV is 1,671,000
|
$124.95
0.71%
|
6/17/2020
|
$110.95
|
PP = $112.67
|
|
MB = $118.30
|
 Most Recent Note - 7/1/2020 6:16:01 PM
G - Posted a solid volume-driven gain today for another new all-time high, getting very extended from any sound base. Stubbornly held its ground after a streak of gains for new highs marked by heavy volume. Reported strong results for the Mar '20 quarter and recent comparisons showed improved earnings increases. Annual earnings (A criteria) history has been strong. Prior high ($112.57) defines initial support to watch on pullbacks.
>>> FEATURED STOCK ARTICLE : Hit New 52-Week High But Closed Below Pivot After 3-Weeks Tight - 6/17/2020 |
View all notes |
Set NEW NOTE alert |
Company Profile |
SEC
News |
Chart |
Request a new note
C
A
S
I |
AMD
-
NASDAQ
Advanced Micro Devices
ELECTRONICS - Semiconductor - Broad Line
|
$52.58
|
-0.03
-0.06% |
$52.87
|
32,314,512
53.55% of 50 DAV
50 DAV is 60,339,000
|
$59.27
-11.29%
|
6/9/2020
|
$55.41
|
PP = $56.98
|
|
MB = $59.83
|
Most Recent Note - 6/30/2020 5:44:19 PM
G - Rebounded toward its 50 DMA line ($53.72) with below average volume behind today's 2nd consecutive gain. Subsequent gains above the 50 DMA line are needed for its outlook to improve. Met stubborn resistance in the $57-59 area.
>>> FEATURED STOCK ARTICLE : Slump Below 50-Day Average Toward Prior Low Raises Concerns - 6/26/2020 |
View all notes |
Set NEW NOTE alert |
Company Profile |
SEC
News |
Chart |
Request a new note
C
A
S
I |
Symbol/Exchange
Company Name
Industry Group |
PRICE |
CHANGE
(%Change) |
Day High |
Volume
(% DAV)
(% 50 day avg vol) |
52 Wk Hi
% From Hi |
Featured
Date |
Price
Featured |
Pivot Featured |
|
Max Buy |
TREX
-
NYSE
Trex Company Inc
MATERIALS and CONSTRUCTION - General Building Materials
|
$124.83
|
-5.24
-4.03% |
$130.51
|
926,709
86.29% of 50 DAV
50 DAV is 1,074,000
|
$132.84
-6.03%
|
6/26/2020
|
$109.05
|
PP = $132.94
|
|
MB = $139.59
|
Most Recent Note - 7/1/2020 6:06:29 PM
Y - Pulled back abruptly today after challenging its all-time high. Subsequent volume-driven gains for new highs may trigger a new (or add-on) technical buy signal. Important near-term support is at its 50 DMA line ($114.90). Fundamentals remain strong.
>>> FEATURED STOCK ARTICLE : Pullback Toward Prior Highs Which Define Near-Term Support - 6/11/2020 |
View all notes |
Set NEW NOTE alert |
Company Profile |
SEC
News |
Chart |
Request a new note
C
A
S
I |
NFLX
-
NASDAQ
Netflix Inc
SPECIALTY RETAIL - Music and Video Stores
|
$485.64
|
+30.60
6.72% |
$488.23
|
9,691,051
137.15% of 50 DAV
50 DAV is 7,066,000
|
$474.01
2.45%
|
5/14/2020
|
$441.95
|
PP = $449.62
|
|
MB = $472.10
|
Most Recent Note - 7/1/2020 6:11:37 PM
G - Posted a solid gain today with +37% above average volume rallying above its "max buy" level for a new all-time high, and its color code is changed to green. Found support near its 50 DMA line ($435) during recent consolidations.
>>> FEATURED STOCK ARTICLE : Weak Action Led to 50-Day Moving Average Violation - 6/12/2020 |
View all notes |
Set NEW NOTE alert |
Company Profile |
SEC
News |
Chart |
Request a new note
C
A
S
I |
CHGG
-
NYSE
Chegg Inc
Consumer Svcs-Education
|
$68.08
|
+0.82
1.22% |
$68.92
|
2,222,386
49.35% of 50 DAV
50 DAV is 4,503,000
|
$70.57
-3.53%
|
6/17/2020
|
$63.71
|
PP = $68.08
|
|
MB = $71.48
|
Most Recent Note - 6/29/2020 6:30:33 PM
Y - Posted a 3rd consecutive gain today, but it remains below its pivot point. Disciplined investors may note that the recent gain above the pivot point was not backed by the at least +40% above average volume necessary to trigger a convincing technical buy signal. Confirming gains above the pivot point backed by volume would be a reassuring sign of fresh institutional buying demand.
>>> FEATURED STOCK ARTICLE : Formed a Flat Base Perched Within Striking Distance of 52-Week High - 6/18/2020 |
View all notes |
Set NEW NOTE alert |
Company Profile |
SEC
News |
Chart |
Request a new note
C
A
S
I |
NOW
-
NYSE
Servicenow Inc
Computer Sftwr-Enterprse
|
$416.79
|
+11.73
2.90% |
$417.62
|
1,787,331
87.74% of 50 DAV
50 DAV is 2,037,000
|
$409.80
1.71%
|
4/30/2020
|
$343.05
|
PP = $363.05
|
|
MB = $381.20
|
Most Recent Note - 6/30/2020 5:49:42 PM
G - Posted a gain today with near average volume for a best-ever close. Volume totals have generally been cooling while hovering in a tight trading range perched near its all-time high. It has not formed a sound base. Its 50 DMA line ($372) defines important near-term support to watch on pullbacks.
>>> FEATURED STOCK ARTICLE : Hovering Near All-Time High With Volume Totals Cooling - 6/25/2020 |
View all notes |
Set NEW NOTE alert |
Company Profile |
SEC
News |
Chart |
Request a new note
C
A
S
I |
TEAM
-
NASDAQ
Atlassian Corp Plc Cl A
Comp Sftwr-Spec Enterprs
|
$185.61
|
+5.34
2.96% |
$186.62
|
1,221,766
64.10% of 50 DAV
50 DAV is 1,906,000
|
$191.72
-3.19%
|
5/4/2020
|
$159.70
|
PP = $156.22
|
|
MB = $164.03
|
Most Recent Note - 7/1/2020 6:14:22 PM
G - Posted a big gain today with below average volume while building on an orderly consolidation above its 50 DMA line ($174). The next important near-term support is the prior low ($163.72 on 6/05/20).
>>> FEATURED STOCK ARTICLE : 50-Day Moving Average Defines Important Near-Term Support - 6/29/2020 |
View all notes |
Set NEW NOTE alert |
Company Profile |
SEC
News |
Chart |
Request a new note
C
A
S
I |
Symbol/Exchange
Company Name
Industry Group |
PRICE |
CHANGE
(%Change) |
Day High |
Volume
(% DAV)
(% 50 day avg vol) |
52 Wk Hi
% From Hi |
Featured
Date |
Price
Featured |
Pivot Featured |
|
Max Buy |
TTD
-
NASDAQ
The Trade Desk Inc Cl A
Comml Svcs-Advertising
|
$429.14
|
+22.64
5.57% |
$433.24
|
2,228,686
104.14% of 50 DAV
50 DAV is 2,140,000
|
$421.06
1.92%
|
6/3/2020
|
$340.61
|
PP = $327.35
|
|
MB = $343.72
|
Most Recent Note - 7/1/2020 1:39:49 PM
G - Hitting another new 52-week high today, getting very extended from any sound base. Its 50 DMA line ($330) and prior highs in the $327 area define important near-term support to watch on pullbacks.
>>> FEATURED STOCK ARTICLE : Pullback Breaks Streak of 8 Straight Gains Into New High Ground - 6/24/2020 |
View all notes |
Set NEW NOTE alert |
Company Profile |
SEC
News |
Chart |
Request a new note
C
A
S
I |
DOCU
-
NASDAQ
Docusign Inc
Computer Sftwr-Enterprse
|
$178.96
|
+6.75
3.92% |
$180.38
|
3,768,200
81.35% of 50 DAV
50 DAV is 4,632,000
|
$180.45
-0.83%
|
6/10/2020
|
$149.73
|
PP = $152.10
|
|
MB = $159.71
|
Most Recent Note - 7/1/2020 6:08:09 PM
G - Posted a quiet gain today for a best-ever close. Very extended from any sound base. Prior high ($152 on 6/02/20) defines initial support to watch well above its 50 DMA line ($136.24). DOCU is now priced +97% above its 200 DMA price ($89.51), and it is taught in the Certification that a stock trading +70-100% or more above the 200 DMA is to be recognized as a "sell signal". See the latest FSU analysis for more details and a new annotated graph.
>>> FEATURED STOCK ARTICLE : Rally From Ascending Base Leaves Stock Very Extended - 7/1/2020 |
View all notes |
Set NEW NOTE alert |
Company Profile |
SEC
News |
Chart |
Request a new note
C
A
S
I |
PING
-
NYSE
Ping Identity Hldg Corp
Computer Sftwr-Security
|
$33.27
|
+1.18
3.68% |
$33.43
|
800,265
61.70% of 50 DAV
50 DAV is 1,297,000
|
$35.36
-5.91%
|
6/1/2020
|
$29.24
|
PP = $29.90
|
|
MB = $31.40
|
Most Recent Note - 7/1/2020 6:12:42 PM
G - Posted a solid gain today with below average volume and it is extended from the previously noted base. Prior highs in the $29 area define initial support to watch.
>>> FEATURED STOCK ARTICLE : Gain for Recent New High Backed by +71% Above Average Volume - 6/22/2020 |
View all notes |
Set NEW NOTE alert |
Company Profile |
SEC
News |
Chart |
Request a new note
C
A
S
I |
AAXN
-
NASDAQ
Axon Enterprise Inc
Security/Sfty
|
$99.37
|
+1.24
1.26% |
$100.14
|
596,553
44.16% of 50 DAV
50 DAV is 1,351,000
|
$104.90
-5.27%
|
5/8/2020
|
$84.86
|
PP = $90.20
|
|
MB = $94.71
|
Most Recent Note - 6/26/2020 6:25:41 PM
G - Posted a small gain today with very heavy volume +54% above average. Completed a new Public Offering on 6/17/20. Prior highs in the $90-91 area have acted as support following a powerful breakout. More damaging losses would raise concerns and trigger a technical sell signal.
>>> FEATURED STOCK ARTICLE : Completed New Pubic Offering and Found Support Near Prior High - 6/19/2020 |
View all notes |
Set NEW NOTE alert |
Company Profile |
SEC
News |
Chart |
Request a new note
C
A
S
I |
GDDY
-
NYSE
Godaddy Inc Cl A
Computer Sftwr-Enterprse
|
$73.85
|
+0.52
0.71% |
$74.16
|
1,677,163
112.26% of 50 DAV
50 DAV is 1,494,000
|
$84.49
-12.59%
|
6/2/2020
|
$79.62
|
PP = $82.40
|
|
MB = $86.52
|
Most Recent Note - 6/26/2020 6:11:16 PM
G - Color code is changed to green after violating its 50 DMA line ($74.45) with today's 3rd consecutive volume-driven loss triggering a technical sell signal. A prompt rebound above the 50 DMA line is needed to help its outlook improve. Subsequent gains above the pivot point backed by at least +40% above average volume are needed to clinch a convincing technical buy signal. It previously met stubborn resistance in the $82-84 area.
>>> FEATURED STOCK ARTICLE : Hit a New 52-Week High With Today's 8th Consecutive Gain - 6/23/2020 |
View all notes |
Set NEW NOTE alert |
Company Profile |
SEC
News |
Chart |
Request a new note
C
A
S
I |
Symbol/Exchange
Company Name
Industry Group |
PRICE |
CHANGE
(%Change) |
Day High |
Volume
(% DAV)
(% 50 day avg vol) |
52 Wk Hi
% From Hi |
Featured
Date |
Price
Featured |
Pivot Featured |
|
Max Buy |
|
|
|
THESE ARE NOT BUY RECOMMENDATIONS!
Comments contained in the body of this report are technical
opinions only. The material herein has been obtained
from sources believed to be reliable and accurate, however,
its accuracy and completeness cannot be guaranteed.
This site is not an investment advisor, hence it does
not endorse or recommend any securities or other investments.
Any recommendation contained in this report may not
be suitable for all investors and it is not to be deemed
an offer or solicitation on our part with respect to
the purchase or sale of any securities. All trademarks,
service marks and trade names appearing in this report
are the property of their respective owners, and are
likewise used for identification purposes only.
This report is a service available
only to active Paid Premium Members.
You may opt-out of receiving report notifications
at any time. Questions or comments may be submitted
by writing to Premium Membership Services 665 S.E. 10 Street, Suite 201 Deerfield Beach, FL 33441-5634 or by calling 1-800-965-8307
or 954-785-1121.
|
|
|