You are not logged in.
This means you
CAN ONLY VIEW reports that were published prior to Sunday, February 25, 2024.
You
MUST UPGRADE YOUR MEMBERSHIP if you want to see any current reports.
AFTER MARKET UPDATE - TUESDAY, JUNE 30TH, 2020
Previous After Market Report Next After Market Report >>>
|
|
|
|
DOW |
+217.08 |
25,812.88 |
+0.85% |
|
Volume |
1,217,907,110 |
+26% |
|
Volume |
4,436,000,900 |
+3% |
|
NASDAQ |
+184.61 |
10,056.24 |
+1.87% |
|
Advancers |
1,898 |
65% |
|
Advancers |
2,259 |
67% |
|
S&P 500 |
+47.05 |
3,100.29 |
+1.54% |
|
Decliners |
1,036 |
35% |
|
Decliners |
1,103 |
33% |
|
Russell 2000 |
+20.16 |
1,441.37 |
+1.42% |
|
52 Wk Highs |
58 |
|
|
52 Wk Highs |
102 |
|
|
S&P 600 |
+11.63 |
831.89 |
+1.42% |
|
52 Wk Lows |
6 |
|
|
52 Wk Lows |
16 |
|
|
 |
Indices Rose With Greater Leadership and Higher Volume Totals
Kenneth J. Gruneisen - Passed the CAN SLIM® Master's Exam
The S&P 500 climbed 1.5%, capping its strongest quarterly performance since 1998 with a 20% gain. The Dow rose 217 points, closing out its best quarter since 1987 with a 17.8% advance. The Nasdaq Composite jumped 1.9%, ending the April-June period up 30.6%. For the month, the Dow added 1.7%, the S&P 500 rose 1.8%, and the Nasdaq Composite rallied 6%. Breadth was positive as advancers led decliners by a 9-5 margin on the NYSE and by 2-1 on the Nasdaq exchange. The reported volume totals were higher than the prior session on the NYSE and on the Nasdaq exchange, indicative of increasing institutional buying demand. There were 38 high-ranked companies from the Leaders List that hit new 52-week highs and were listed on the BreakOuts Page, versus the total of 26 on the prior session. New 52-week highs totals expanded and outnumbered new 52-week lows totals on both exchanges. The major indices are still in a confirmed uptrend (M criteria). Any sustainable rally requires a healthy crop of new leaders, so it remains important to see the new highs totals stabilize and improve.Charts used courtesy of www.stockcharts.com
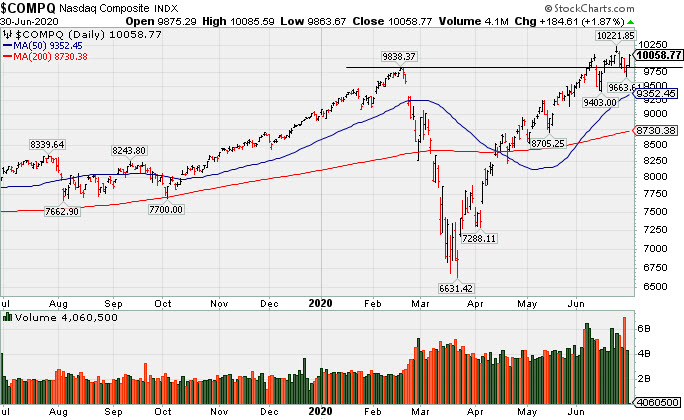
PICTURED: The Nasdaq Composite Index is -1.6% off its record high. It has found support near its February high.
Stocks finished higher on Tuesday. Improving data garnered attention, with the Conference Board’s gauge of consumer confidence surpassing consensus expectations for its largest one-month advance since 2011. In central bank news, Fed Chair Jerome Powell highlighted the strength of recent economic data to the House Financial Services Committee, and also reiterated the importance of controlling the COVID-19 spread for a full recovery. Investors continued to monitor a sharp uptick in coronavirus cases in several pockets of the U.S., while U.S.-China tensions remained a focus after Beijing unanimously approved its controversial national security legislation on Hong Kong.
Treasuries declined slightly, with the yield on the 10-year note up one basis point to 0.65%. In commodities, WTI crude slipped 0.7% to $39.43/barrel but still saw its best quarter since 1990, bouncing back from its worst such period in history. Meanwhile, COMEX gold rose 1% to $1798.10/ounce, capping its strongest quarter since 2016.
All 11 S&P 500 sectors closed in positive territory with Energy and Tech shares outperforming. In earnings, Micron Technology (MU +4.83%) rose after the chip maker provided positive revenue guidance. In other corporate news, Uber (UBER +4.89%) rose on news the ride-hailing company is in talks to acquire food delivery service Postmates.
|
 Kenneth J. Gruneisen started out as a licensed stockbroker in August 1987, a couple of months prior to the historic stock market crash that took the Dow Jones Industrial Average down -22.6% in a single day. He has published daily fact-based fundamental and technical analysis on high-ranked stocks online for two decades. Through FACTBASEDINVESTING.COM, Kenneth provides educational articles, news, market commentary, and other information regarding proven investment systems that work in good times and bad.
Comments contained in the body of this report are technical opinions only and are not necessarily those of Gruneisen Growth Corp. The material herein has been obtained from sources believed to be reliable and accurate, however, its accuracy and completeness cannot be guaranteed. Our firm, employees, and customers may effect transactions, including transactions contrary to any recommendation herein, or have positions in the securities mentioned herein or options with respect thereto. Any recommendation contained in this report may not be suitable for all investors and it is not to be deemed an offer or solicitation on our part with respect to the purchase or sale of any securities. |
|
 |
Retail, Financial, Tech, and Commodity-Linked Groups Rose
Kenneth J. Gruneisen - Passed the CAN SLIM® Master's Exam
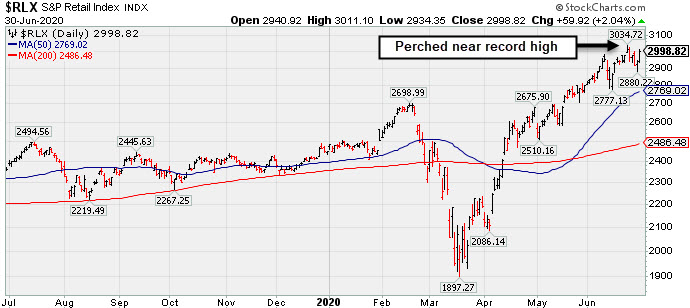
The Retail Index ($RLX +2.04%) and financials underpinned the major indices' rally as the Broker/Dealer Index ($XBD +1.51%) and the Bank Index ($BKX +2.11%) each posted gains. Energy-linked groups rose as the Integrated Oil Index ($XOI +1.77%) and the Oil Services Index ($OSX +2.46%) each posted gains. The Gold & Silver Index ($XAU +3.55%) was a standout gainer. The tech sector was led higher by the Semiconductor Index ($SOX +2.70%) while the Networking Index ($NWX +1.11%) and the Biotech Index ($BTK +1.48%) rounded out the widely positive session with solid gains.
PICTURED: The Retail Index ($RLX +2.04%) is perched near its record high. Strength in the retail index is a reassuring sign, since the American consumer represents approximately 2/3 of the total US economy.
| Oil Services |
$OSX |
33.38 |
+0.81 |
+2.49% |
-57.36% |
| Integrated Oil |
$XOI |
784.22 |
+13.66 |
+1.77% |
-38.28% |
| Semiconductor |
$SOX |
1,997.03 |
+53.13 |
+2.73% |
+7.97% |
| Networking |
$NWX |
547.86 |
+6.04 |
+1.11% |
-6.09% |
| Broker/Dealer |
$XBD |
271.86 |
+4.05 |
+1.51% |
-6.38% |
| Retail |
$RLX |
2,998.82 |
+59.92 |
+2.04% |
+22.44% |
| Gold & Silver |
$XAU |
129.16 |
+4.43 |
+3.55% |
+20.80% |
| Bank |
$BKX |
74.51 |
+1.52 |
+2.08% |
-34.27% |
| Biotech |
$BTK |
5,718.34 |
+83.22 |
+1.48% |
+12.84% |
|
|
|
 |
Pulled Back Below "Max Buy" Level With Loss on Average Volume
Kenneth J. Gruneisen - Passed the CAN SLIM® Master's Exam
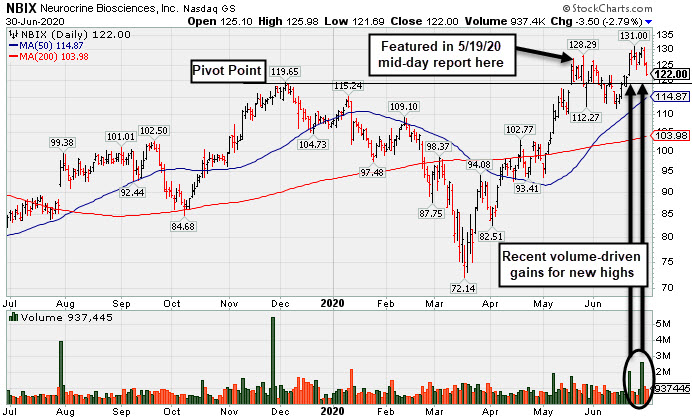
Neurocrine Biosciences (NBIX -$3.50 or -2.79% to $122.00) pulled back today with average volume, retreating from its all-time high. Its color code was changed to yellow after pulling back below its "max buy" level. Prior highs in the $119 area define important near-term support to watch above its 50-day moving average (DMA) line ($114.87). Fundamentals remain strong.
NBIX was last shown in this FSU section on 6/08/20 with an annotated graph under the headline, "Pullback Into Prior Base Negated Recent Breakout". It was highlighted in yellow with pivot point cited based on its 12/04/20 high plus 10 cents in the 5/19/20 mid-day report (read here). Technically, it broke out for a new 52-week high (N criteria) on the 5/18/20 with +101% above average volume behind a big gain after a gap up.
It reported earnings +545%, +200%, +163%, and +183% in the Jun, Sep, Dec '19 and Mar '20 quarters, well above the +25% minimum guideline (C criteria) versus the year ago periods, respectively. It showed greatly improved sales revenues up +89%, +46%, +86%, and +71% during that same span of quarterly comparisons. After years of losses it reported strong annual earnings (A criteria) results in FY '18 and '19.
There are 92.8 million shares outstanding (S criteria). The number of top-rated funds owning its shares rose from 651 in Jun '19 to 915 in Mar '20, a reassuring sign concerning the I criteria. Its current Up/Down Volume ratio of 1.7 is an unbiased indication its shares have been under accumulation over the past 50 days. It has an A Timeliness rating and a B Sponsorship Rating. It hails from the strong Medical - Biomed/Biotech industry which is currently rated 8th of the 197 industry groups listed in the newspaper (L criteria). In late April it received approval from the FDA for ONGENTYS, a new medication (N criteria) to help patients with Parkinson's disease better manage motor fluctuations. |
|
|
Color Codes Explained :
Y - Better candidates highlighted by our
staff of experts.
G - Previously featured
in past reports as yellow but may no longer be buyable under the
guidelines.
***Last / Change / Volume data in this table is the closing quote data***
Symbol/Exchange
Company Name
Industry Group |
PRICE |
CHANGE
(%Change) |
Day High |
Volume
(% DAV)
(% 50 day avg vol) |
52 Wk Hi
% From Hi |
Featured
Date |
Price
Featured |
Pivot Featured |
|
Max Buy |
 FTNT
-
NASDAQ
FTNT
-
NASDAQ
Fortinet Inc
Computer Sftwr-Security
|
$137.27
|
+3.80
2.85% |
$137.66
|
1,220,122
69.60% of 50 DAV
50 DAV is 1,753,000
|
$149.69
-8.30%
|
6/22/2020
|
$142.68
|
PP = $149.79
|
|
MB = $157.28
|
 Most Recent Note - 6/30/2020 5:47:10 PM
Y - Found prompt support at its 50 DMA line ($130) and above the prior low ($126.88 on 6/15/20). Subsequent gains above the pivot point backed by at least +40% above average volume are needed to trigger a new (or add-on) technical buy signal.
>>> FEATURED STOCK ARTICLE : Managed a "Positive Reversal" After Brief Dip Below "Max Buy" Level - 6/15/2020 |
View all notes |
Set NEW NOTE alert |
Company Profile |
SEC
News |
Chart |
Request a new note
C
A
S
I |
EBS
-
NYSE
Emergent Biosolutions
DRUGS - Biotechnology
|
$79.08
|
+3.65
4.84% |
$79.16
|
650,753
98.75% of 50 DAV
50 DAV is 659,000
|
$93.58
-15.49%
|
6/1/2020
|
$72.10
|
PP = $90.10
|
|
MB = $94.61
|
Most Recent Note - 6/30/2020 5:45:59 PM
G - Today's gain above the 50 DMA line helped its outlook improve. Still faces resistance due to overhead supply up to the $93 level. Fundamentals remain strong.
>>> FEATURED STOCK ARTICLE : Still Below 50-Day Moving Average Following Damaging Gap Down - 6/16/2020 |
View all notes |
Set NEW NOTE alert |
Company Profile |
SEC
News |
Chart |
Request a new note
C
A
S
I |
NBIX
-
NASDAQ
Neurocrine Biosciences
DRUGS - Biotechnology
|
$122.00
|
-3.50
-2.79% |
$125.98
|
923,049
101.32% of 50 DAV
50 DAV is 911,000
|
$131.00
-6.87%
|
5/19/2020
|
$123.71
|
PP = $119.75
|
|
MB = $125.74
|
Most Recent Note - 6/30/2020 5:41:13 PM
Y - Pulled back below its "max buy" level with a loss today on average volume and its color code is changed to yellow. Retreating from its all-time high following volume-driven gains. Prior highs in the $119 area define important near-term support to watch above its 50 DMA line ($114.87). Fundamentals remain strong. See the latest FSU analysis for more details and a new annotated graph.
>>> FEATURED STOCK ARTICLE : Pulled Back Below "Max Buy" Level With Loss on Average Volume - 6/30/2020 |
View all notes |
Set NEW NOTE alert |
Company Profile |
SEC
News |
Chart |
Request a new note
C
A
S
I |
BMRN
-
NASDAQ
Biomarin Pharmaceutical
DRUGS - Drug Manufacturers - Other
|
$123.34
|
+1.16
0.95% |
$123.92
|
1,165,117
69.11% of 50 DAV
50 DAV is 1,686,000
|
$124.95
-1.29%
|
6/17/2020
|
$110.95
|
PP = $112.67
|
|
MB = $118.30
|
Most Recent Note - 6/25/2020 6:26:08 PM
G - Posted a volume-driven gain today for a best ever close. Stubbornly held its ground after a streak of gains for new highs marked by heavy volume. Reported strong results for the Mar '20 quarter and recent comparisons showed improved earnings increases. Annual earnings (A criteria) history has been strong. Prior high ($112.57) defines initial support to watch on pullbacks.
>>> FEATURED STOCK ARTICLE : Hit New 52-Week High But Closed Below Pivot After 3-Weeks Tight - 6/17/2020 |
View all notes |
Set NEW NOTE alert |
Company Profile |
SEC
News |
Chart |
Request a new note
C
A
S
I |
AMD
-
NASDAQ
Advanced Micro Devices
ELECTRONICS - Semiconductor - Broad Line
|
$52.61
|
+2.33
4.63% |
$52.77
|
42,100,386
69.08% of 50 DAV
50 DAV is 60,940,000
|
$59.27
-11.24%
|
6/9/2020
|
$55.41
|
PP = $56.98
|
|
MB = $59.83
|
Most Recent Note - 6/30/2020 5:44:19 PM
G - Rebounded toward its 50 DMA line ($53.72) with below average volume behind today's 2nd consecutive gain. Subsequent gains above the 50 DMA line are needed for its outlook to improve. Met stubborn resistance in the $57-59 area.
>>> FEATURED STOCK ARTICLE : Slump Below 50-Day Average Toward Prior Low Raises Concerns - 6/26/2020 |
View all notes |
Set NEW NOTE alert |
Company Profile |
SEC
News |
Chart |
Request a new note
C
A
S
I |
Symbol/Exchange
Company Name
Industry Group |
PRICE |
CHANGE
(%Change) |
Day High |
Volume
(% DAV)
(% 50 day avg vol) |
52 Wk Hi
% From Hi |
Featured
Date |
Price
Featured |
Pivot Featured |
|
Max Buy |
TREX
-
NYSE
Trex Company Inc
MATERIALS and CONSTRUCTION - General Building Materials
|
$130.07
|
+2.04
1.59% |
$132.16
|
977,454
91.35% of 50 DAV
50 DAV is 1,070,000
|
$132.84
-2.09%
|
6/26/2020
|
$109.05
|
PP = $132.94
|
|
MB = $139.59
|
Most Recent Note - 6/30/2020 5:54:31 PM
Y - Posted a 4th consecutive gain today as it challenged its all-time high. Subsequent volume-driven gains for new highs may trigger a new (or add-on) technical buy signal. Important near-term support is at its 50 DMA line ($114). Fundamentals remain strong.
>>> FEATURED STOCK ARTICLE : Pullback Toward Prior Highs Which Define Near-Term Support - 6/11/2020 |
View all notes |
Set NEW NOTE alert |
Company Profile |
SEC
News |
Chart |
Request a new note
C
A
S
I |
NFLX
-
NASDAQ
Netflix Inc
SPECIALTY RETAIL - Music and Video Stores
|
$455.04
|
+7.80
1.74% |
$457.59
|
4,167,220
57.60% of 50 DAV
50 DAV is 7,235,000
|
$474.01
-4.00%
|
5/14/2020
|
$441.95
|
PP = $449.62
|
|
MB = $472.10
|
Most Recent Note - 6/30/2020 5:57:50 PM
Y - Abruptly retreated from its all-time high and again found prompt support near its 50 DMA line ($433). Recent gains above a stock's pivot point did not have the minimum +40% above average volume needed to trigger a proper new (or add-on) technical buy signal. Any damaging losses below the 50 DMA line and prior lows would trigger a more worrisome technical sell signal.
>>> FEATURED STOCK ARTICLE : Weak Action Led to 50-Day Moving Average Violation - 6/12/2020 |
View all notes |
Set NEW NOTE alert |
Company Profile |
SEC
News |
Chart |
Request a new note
C
A
S
I |
CHGG
-
NYSE
Chegg Inc
Consumer Svcs-Education
|
$67.26
|
+0.53
0.79% |
$68.19
|
2,602,119
58.17% of 50 DAV
50 DAV is 4,473,000
|
$70.57
-4.69%
|
6/17/2020
|
$63.71
|
PP = $68.08
|
|
MB = $71.48
|
Most Recent Note - 6/29/2020 6:30:33 PM
Y - Posted a 3rd consecutive gain today, but it remains below its pivot point. Disciplined investors may note that the recent gain above the pivot point was not backed by the at least +40% above average volume necessary to trigger a convincing technical buy signal. Confirming gains above the pivot point backed by volume would be a reassuring sign of fresh institutional buying demand.
>>> FEATURED STOCK ARTICLE : Formed a Flat Base Perched Within Striking Distance of 52-Week High - 6/18/2020 |
View all notes |
Set NEW NOTE alert |
Company Profile |
SEC
News |
Chart |
Request a new note
C
A
S
I |
NOW
-
NYSE
Servicenow Inc
Computer Sftwr-Enterprse
|
$405.06
|
+10.51
2.66% |
$406.17
|
1,745,250
85.59% of 50 DAV
50 DAV is 2,039,000
|
$409.80
-1.16%
|
4/30/2020
|
$343.05
|
PP = $363.05
|
|
MB = $381.20
|
Most Recent Note - 6/30/2020 5:49:42 PM
G - Posted a gain today with near average volume for a best-ever close. Volume totals have generally been cooling while hovering in a tight trading range perched near its all-time high. It has not formed a sound base. Its 50 DMA line ($372) defines important near-term support to watch on pullbacks.
>>> FEATURED STOCK ARTICLE : Hovering Near All-Time High With Volume Totals Cooling - 6/25/2020 |
View all notes |
Set NEW NOTE alert |
Company Profile |
SEC
News |
Chart |
Request a new note
C
A
S
I |
TEAM
-
NASDAQ
Atlassian Corp Plc Cl A
Comp Sftwr-Spec Enterprs
|
$180.27
|
+5.14
2.93% |
$180.79
|
1,276,719
66.81% of 50 DAV
50 DAV is 1,911,000
|
$191.72
-5.97%
|
5/4/2020
|
$159.70
|
PP = $156.22
|
|
MB = $164.03
|
Most Recent Note - 6/30/2020 5:51:48 PM
G - Found support while recently consolidating above its 50 DMA line ($173). The next important near-term support is the prior low ($163.72 on 6/05/20). See the latest FSU analysis for more details and an annotated graph.
>>> FEATURED STOCK ARTICLE : 50-Day Moving Average Defines Important Near-Term Support - 6/29/2020 |
View all notes |
Set NEW NOTE alert |
Company Profile |
SEC
News |
Chart |
Request a new note
C
A
S
I |
Symbol/Exchange
Company Name
Industry Group |
PRICE |
CHANGE
(%Change) |
Day High |
Volume
(% DAV)
(% 50 day avg vol) |
52 Wk Hi
% From Hi |
Featured
Date |
Price
Featured |
Pivot Featured |
|
Max Buy |
TTD
-
NASDAQ
The Trade Desk Inc Cl A
Comml Svcs-Advertising
|
$406.50
|
+0.35
0.09% |
$417.71
|
1,699,501
79.12% of 50 DAV
50 DAV is 2,148,000
|
$421.06
-3.46%
|
6/3/2020
|
$240.61
|
PP = $327.35
|
|
MB = $343.72
|
Most Recent Note - 6/30/2020 5:56:18 PM
G - Stubbornly holding its ground perched near its 52-week high, very extended from any sound base. Prior highs in the $327 area define important near-term support coinciding with its 50 DMA line ($326.62).
>>> FEATURED STOCK ARTICLE : Pullback Breaks Streak of 8 Straight Gains Into New High Ground - 6/24/2020 |
View all notes |
Set NEW NOTE alert |
Company Profile |
SEC
News |
Chart |
Request a new note
C
A
S
I |
DOCU
-
NASDAQ
Docusign Inc
Computer Sftwr-Enterprse
|
$172.21
|
+0.54
0.31% |
$174.48
|
3,432,354
74.39% of 50 DAV
50 DAV is 4,614,000
|
$180.45
-4.57%
|
6/10/2020
|
$149.73
|
PP = $152.10
|
|
MB = $159.71
|
Most Recent Note - 6/29/2020 6:28:13 PM
G - Pulled back from its all-time high with a loss today on average volume. Very extended from any sound base. Prior high ($152 on 6/02/20) defines initial support to watch well above its 50 DMA line ($133). DOCU is now priced +92% above its 200 DMA price ($89.51), and it is taught in the Certification that a stock trading +70-100% or more above the 200 DMA is to be recognized as a "sell signal".
>>> FEATURED STOCK ARTICLE : Advanced Ascending Base Formed for Strong E-Signature Firm - 6/10/2020 |
View all notes |
Set NEW NOTE alert |
Company Profile |
SEC
News |
Chart |
Request a new note
C
A
S
I |
PING
-
NYSE
Ping Identity Hldg Corp
Computer Sftwr-Security
|
$32.09
|
+0.65
2.07% |
$32.35
|
477,379
36.78% of 50 DAV
50 DAV is 1,298,000
|
$35.36
-9.25%
|
6/1/2020
|
$29.24
|
PP = $29.90
|
|
MB = $31.40
|
Most Recent Note - 6/30/2020 5:50:58 PM
G - Posted a gain today with light volume after recently slumping near its "max buy" level. Prior highs in the $29 area define initial support to watch.
>>> FEATURED STOCK ARTICLE : Gain for Recent New High Backed by +71% Above Average Volume - 6/22/2020 |
View all notes |
Set NEW NOTE alert |
Company Profile |
SEC
News |
Chart |
Request a new note
C
A
S
I |
AAXN
-
NASDAQ
Axon Enterprise Inc
Security/Sfty
|
$98.13
|
+2.33
2.43% |
$100.65
|
1,067,016
78.46% of 50 DAV
50 DAV is 1,360,000
|
$104.90
-6.45%
|
5/8/2020
|
$84.86
|
PP = $90.20
|
|
MB = $94.71
|
Most Recent Note - 6/26/2020 6:25:41 PM
G - Posted a small gain today with very heavy volume +54% above average. Completed a new Public Offering on 6/17/20. Prior highs in the $90-91 area have acted as support following a powerful breakout. More damaging losses would raise concerns and trigger a technical sell signal.
>>> FEATURED STOCK ARTICLE : Completed New Pubic Offering and Found Support Near Prior High - 6/19/2020 |
View all notes |
Set NEW NOTE alert |
Company Profile |
SEC
News |
Chart |
Request a new note
C
A
S
I |
GDDY
-
NYSE
Godaddy Inc
Computer Sftwr-Enterprse
|
$73.33
|
+0.74
1.02% |
$73.83
|
1,731,213
116.81% of 50 DAV
50 DAV is 1,482,100
|
$84.49
-13.21%
|
6/2/2020
|
$79.62
|
PP = $82.40
|
|
MB = $86.52
|
Most Recent Note - 6/26/2020 6:11:16 PM
G - Color code is changed to green after violating its 50 DMA line ($74.45) with today's 3rd consecutive volume-driven loss triggering a technical sell signal. A prompt rebound above the 50 DMA line is needed to help its outlook improve. Subsequent gains above the pivot point backed by at least +40% above average volume are needed to clinch a convincing technical buy signal. It previously met stubborn resistance in the $82-84 area.
>>> FEATURED STOCK ARTICLE : Hit a New 52-Week High With Today's 8th Consecutive Gain - 6/23/2020 |
View all notes |
Set NEW NOTE alert |
Company Profile |
SEC
News |
Chart |
Request a new note
C
A
S
I |
Symbol/Exchange
Company Name
Industry Group |
PRICE |
CHANGE
(%Change) |
Day High |
Volume
(% DAV)
(% 50 day avg vol) |
52 Wk Hi
% From Hi |
Featured
Date |
Price
Featured |
Pivot Featured |
|
Max Buy |
|
|
|
THESE ARE NOT BUY RECOMMENDATIONS!
Comments contained in the body of this report are technical
opinions only. The material herein has been obtained
from sources believed to be reliable and accurate, however,
its accuracy and completeness cannot be guaranteed.
This site is not an investment advisor, hence it does
not endorse or recommend any securities or other investments.
Any recommendation contained in this report may not
be suitable for all investors and it is not to be deemed
an offer or solicitation on our part with respect to
the purchase or sale of any securities. All trademarks,
service marks and trade names appearing in this report
are the property of their respective owners, and are
likewise used for identification purposes only.
This report is a service available
only to active Paid Premium Members.
You may opt-out of receiving report notifications
at any time. Questions or comments may be submitted
by writing to Premium Membership Services 665 S.E. 10 Street, Suite 201 Deerfield Beach, FL 33441-5634 or by calling 1-800-965-8307
or 954-785-1121.
|
|
|