You are not logged in.
This means you
CAN ONLY VIEW reports that were published prior to Tuesday, February 20, 2024.
You
MUST UPGRADE YOUR MEMBERSHIP if you want to see any current reports.
AFTER MARKET UPDATE - WEDNESDAY, JUNE 29TH, 2022
Previous After Market Report Next After Market Report >>>
|
|
|
|
DOW |
+82.32 |
31,029.31 |
+0.27% |
|
Volume |
920,627,804 |
-1% |
|
Volume |
5,539,118,500 |
+4% |
|
NASDAQ |
-3.65 |
11,177.89 |
-0.03% |
|
Advancers |
1,087 |
35% |
|
Advancers |
1,571 |
37% |
|
S&P 500 |
-2.85 |
3,818.70 |
-0.07% |
|
Decliners |
2,005 |
65% |
|
Decliners |
2,732 |
63% |
|
Russell 2000 |
-19.47 |
1,719.37 |
-1.12% |
|
52 Wk Highs |
9 |
|
|
52 Wk Highs |
13 |
|
|
S&P 600 |
-11.48 |
1,132.34 |
-1.00% |
|
52 Wk Lows |
199 |
|
|
52 Wk Lows |
345 |
|
|
Solid gains from all major averages on Friday with much higher volume, coupled with an increase in the number of stocks hitting new highs, marked a powerful follow-through day confirming a new market uptrend (M criteria). New buying efforts are justified only in stocks meeting all key criteria of the fact-based investment system.
|
 |
Breadth Negative and Leadership Thinned as Major Indices Sputtered
Kenneth J. Gruneisen - Passed the CAN SLIM® Master's Exam
The Dow added 82 points, while the S&P 500 and Nasdaq Composite each dipped less than 0.1%. Volume totals reported were mixed, lighter than the prior session on the NYSE and higher on the Nasdaq exchange. Decliners led advancers by a 2-1 margin on the NYSE and by more than 3-2 on the Nasdaq exchange. There was 1 high-ranked company from the Leaders List that hit a new 52-week high and was listed on the BreakOuts Page, versus the total of 11 on the prior session. New 52-week lows totals expanded and solidly outnumbered shrinking new 52-week highs on the NYSE and on the Nasdaq exchange. Solid gains from all major averages on Friday with much higher volume, coupled with an increase in the number of stocks hitting new highs, marked a powerful follow-through day confirming a new market uptrend (M criteria). Any sustainable rally requires a healthy crop of leading stocks hitting new highs.
Chart courtesy of www.stockcharts.com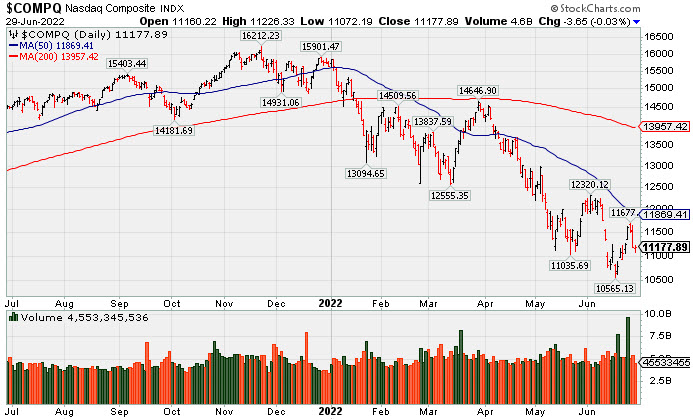 PICTURED: The Nasdaq Composite Index suffered a 3rd consecutive loss and remains well below its 50-day and 200-day moving average (DMA) lines.
U.S. stocks finished little changed in directionless trading Wednesday. Investors digested commentary from central bank leaders and continued to weigh the likelihood of a looming recession. The path of least resistance has continued to skew to the downside as worries of slowing economic growth and persistent inflation remain market overhangs. However, outsized quarter-end rebalancing have been widely cited as buoying equities over the past week. Both the Dow and S&P 500 are positioned for their worst quarter since 2020, while the Nasdaq Composite is on track for its worst three-month period since 2008.
Treasuries rallied, with the yield on the 10-year note falling nine basis points (0.09%) to 3.09%. In central bank news, Federal Reserve (Fed) Chair Jerome Powell stated the U.S. economy was in “strong shape,” suggesting that monetary policy tightening could bring down inflation while preserving a solid labor market. On the data front, a final reading of first-quarter gross domestic product (GDP) showed the U.S. economy contracted at a 1.6% annualized pace during the January through March period, compared to the prior -1.5% reading. Notably, the measure of personal consumption was downwardly revised to reflect an annualized 1.8% uptick, well below the previous 3.1% increase.
Six of 11 S&P 500 sectors closed in positive territory, with the more defensive Health Care and Consumer Staples groups outperforming. Shares of cruise line operators slumped after Carnival Corp. (CCL -14.13%) fell following downbeat analyst commentary. In earnings, General Mills Inc. (GIS +6.35%) rose after boosting its quarterly dividend and providing better-than-expected forward guidance.
|
 Kenneth J. Gruneisen started out as a licensed stockbroker in August 1987, a couple of months prior to the historic stock market crash that took the Dow Jones Industrial Average down -22.6% in a single day. He has published daily fact-based fundamental and technical analysis on high-ranked stocks online for two decades. Through FACTBASEDINVESTING.COM, Kenneth provides educational articles, news, market commentary, and other information regarding proven investment systems that work in good times and bad.
Comments contained in the body of this report are technical opinions only and are not necessarily those of Gruneisen Growth Corp. The material herein has been obtained from sources believed to be reliable and accurate, however, its accuracy and completeness cannot be guaranteed. Our firm, employees, and customers may effect transactions, including transactions contrary to any recommendation herein, or have positions in the securities mentioned herein or options with respect thereto. Any recommendation contained in this report may not be suitable for all investors and it is not to be deemed an offer or solicitation on our part with respect to the purchase or sale of any securities. |
|
 |
Retail Index Posted a Standout Gain
Kenneth J. Gruneisen - Passed the CAN SLIM® Master's Exam
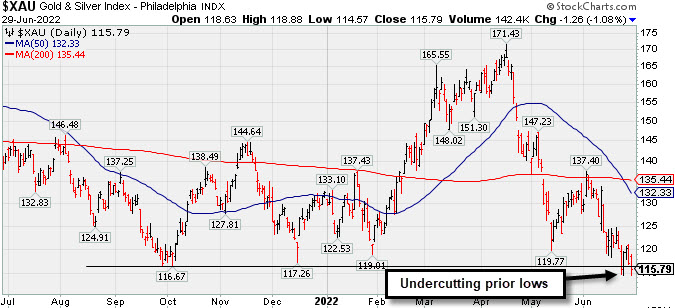
The Broker/Dealer Index ($XBD -0.95%) and Bank Index ($BKX -1.06%) both created a drag on the major averages while the Retail Index ($RLX +0.91%) posted a gain. The Semiconductor Index ($SOX -2.20%) led the tech sector lower while the Networking Index ($NWX -0.91%) suffered a smaller loss and the Biotech Index ($BTK +0.20%) eked out a small gain. Commodity-linked groups had a negative bias as the Oil Services Index ($OSX -1.92%) and Integrated Oil Index ($XOI -3.72%) both outpaced the Gold & Silver Index ($XAU -1.08%) to the downside.
PICTURED: The Gold & Silver Index ($XAU -1.08%) is undercutting prior lows after its 50-day moving average (DMA) line recently sliced below its 200 DMA line.
| Oil Services |
$OSX |
67.81 |
-1.32 |
-1.92% |
+28.62% |
| Integrated Oil |
$XOI |
1,520.60 |
-58.76 |
-3.72% |
+29.06% |
| Semiconductor |
$SOX |
2,583.98 |
-58.10 |
-2.20% |
-34.52% |
| Networking |
$NWX |
684.80 |
-6.28 |
-0.91% |
-29.48% |
| Broker/Dealer |
$XBD |
386.45 |
-3.69 |
-0.95% |
-20.62% |
| Retail |
$RLX |
2,888.54 |
+26.15 |
+0.91% |
-31.66% |
| Gold & Silver |
$XAU |
115.79 |
-1.26 |
-1.08% |
-12.58% |
| Bank |
$BKX |
102.69 |
-1.10 |
-1.06% |
-22.33% |
| Biotech |
$BTK |
4,650.24 |
+9.38 |
+0.20% |
-15.73% |
|
|
|
 |
Featured Stocks
Kenneth J. Gruneisen - Passed the CAN SLIM® Master's Exam
|
|
|
Color Codes Explained :
Y - Better candidates highlighted by our
staff of experts.
G - Previously featured
in past reports as yellow but may no longer be buyable under the
guidelines.
***Last / Change / Volume data in this table is the closing quote data***
|
|
|
THESE ARE NOT BUY RECOMMENDATIONS!
Comments contained in the body of this report are technical
opinions only. The material herein has been obtained
from sources believed to be reliable and accurate, however,
its accuracy and completeness cannot be guaranteed.
This site is not an investment advisor, hence it does
not endorse or recommend any securities or other investments.
Any recommendation contained in this report may not
be suitable for all investors and it is not to be deemed
an offer or solicitation on our part with respect to
the purchase or sale of any securities. All trademarks,
service marks and trade names appearing in this report
are the property of their respective owners, and are
likewise used for identification purposes only.
This report is a service available
only to active Paid Premium Members.
You may opt-out of receiving report notifications
at any time. Questions or comments may be submitted
by writing to Premium Membership Services 665 S.E. 10 Street, Suite 201 Deerfield Beach, FL 33441-5634 or by calling 1-800-965-8307
or 954-785-1121.
|
|
|