You are not logged in.
This means you
CAN ONLY VIEW reports that were published prior to Tuesday, February 20, 2024.
You
MUST UPGRADE YOUR MEMBERSHIP if you want to see any current reports.
AFTER MARKET UPDATE - MONDAY, JUNE 29TH, 2020
Previous After Market Report Next After Market Report >>>
|
|
|
|
DOW |
+580.25 |
25,595.80 |
+2.32% |
|
Volume |
965,245,150 |
-69% |
|
Volume |
4,306,031,300 |
-40% |
|
NASDAQ |
+116.93 |
9,874.15 |
+1.20% |
|
Advancers |
2,226 |
76% |
|
Advancers |
2,252 |
66% |
|
S&P 500 |
+44.19 |
3,053.24 |
+1.47% |
|
Decliners |
710 |
24% |
|
Decliners |
1,134 |
33% |
|
Russell 2000 |
+42.43 |
1,421.21 |
+3.08% |
|
52 Wk Highs |
46 |
|
|
52 Wk Highs |
84 |
|
|
S&P 600 |
+31.57 |
820.26 |
+4.00% |
|
52 Wk Lows |
2 |
|
|
52 Wk Lows |
21 |
|
|
 |
Major Indices Rose With Less Volume Conviction
Kenneth J. Gruneisen - Passed the CAN SLIM® Master's Exam
The S&P 500 Index rose 1.5%, on course for its best quarter since 1998. The Dow climbed 580 points, while the Nasdaq Composite was up 1.2%. Breadth was positive as advancers led decliners by a 3-1 margin on the NYSE and by 2-1 on the Nasdaq exchange. The reported volume totals were lighter than the prior session on the NYSE and on the Nasdaq exchange, indicative of lackluster institutional buying demand. There were 26 high-ranked companies from the Leaders List that hit new 52-week highs and were listed on the BreakOuts Page, versus the total of 32 on the prior session. New 52-week highs totals expanded and outnumbered shrinking new 52-week lows totals on both exchanges. The major indices have seen their uptrend come under recent pressure (M criteria). Any sustainable rally requires a healthy crop of new leaders, so it will be important to see the new highs totals stabilize and improve.Charts used courtesy of www.stockcharts.com
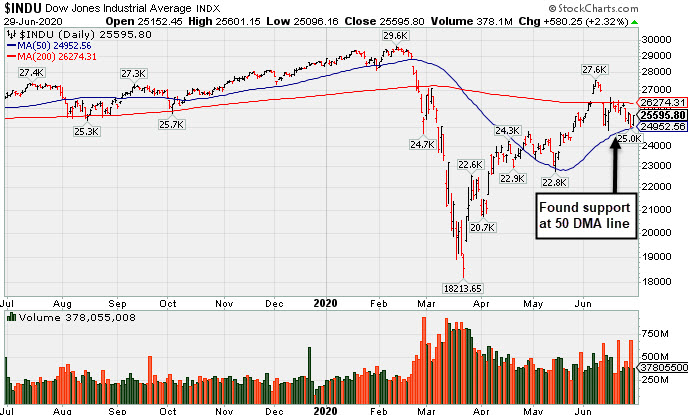
PICTURED: The Dow Jones Industrial Average ended -13.4% off its record high. It has found support at its 50-day moving average (DMA) line. More damaging losses would raise greater concerns and could prompt investors to reduce market exposure and raise cash.
Stocks U.S. stocks finished higher on Monday, kicking off the holiday-shortened week on a positive note. Improving economic data and ongoing stimulus efforts seemed to overshadow worries surrounding a spike in new COVID-19 cases in several pockets of the U.S. Over the weekend, total worldwide infections topped 10 million, while several American states rolled back reopening measures.
Treasuries were little changed, with the yield on the 10-year note steady at 0.64%. On the data front, pending homes sales jumped a record 44.3% in May, rebounding from a 21.8% decline the prior month. Separately, an update from the Dallas Fed revealed manufacturing activity improved more than anticipated in June. Overseas, Chinese industrial profits advanced for the first time in six months in May. In commodities, WTI crude rose 1% to $39.52/barrel.
All 11 S&P 500 sectors closed in positive territory, with Industrials pacing gains. Boeing (BA +14.40%) rose after aviation regulators approved the beleaguered 737-MAX jet for key test flights. Meanwhile, Southwest Airlines (LUV +9.64%) rose after being the subject of a Wall Street analyst upgrade. Health Care and Financials lagged on a relative basis. In other corporate news, shares of BP (BP +3.16%) rose following an announcement that the Energy giant would sell its petrochemicals line of business to private British company Ineos Ltd. for $5 billion. Elsewhere, Facebook was (FB +2.11%) rose despite more companies pausing advertising on the social media platform.
|
 Kenneth J. Gruneisen started out as a licensed stockbroker in August 1987, a couple of months prior to the historic stock market crash that took the Dow Jones Industrial Average down -22.6% in a single day. He has published daily fact-based fundamental and technical analysis on high-ranked stocks online for two decades. Through FACTBASEDINVESTING.COM, Kenneth provides educational articles, news, market commentary, and other information regarding proven investment systems that work in good times and bad.
Comments contained in the body of this report are technical opinions only and are not necessarily those of Gruneisen Growth Corp. The material herein has been obtained from sources believed to be reliable and accurate, however, its accuracy and completeness cannot be guaranteed. Our firm, employees, and customers may effect transactions, including transactions contrary to any recommendation herein, or have positions in the securities mentioned herein or options with respect thereto. Any recommendation contained in this report may not be suitable for all investors and it is not to be deemed an offer or solicitation on our part with respect to the purchase or sale of any securities. |
|
 |
Financial, Retail, and Commodity-Linked Groups Led Gainers
Kenneth J. Gruneisen - Passed the CAN SLIM® Master's Exam
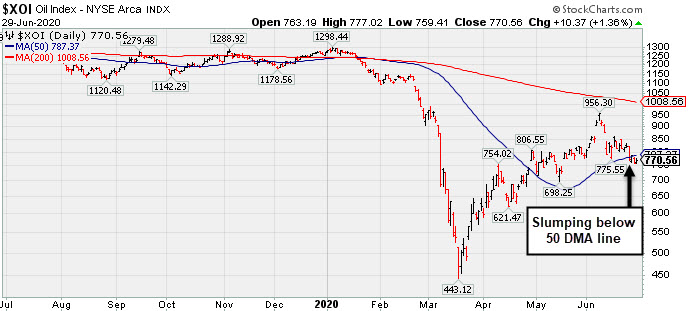
Financials helped give a boost to the major indices as the Broker/Dealer Index ($XBD +2.70%) and the Bank Index ($BKX +1.43%) both posted gains. The Retail Index ($RLX +0.70%) also edged higher. Energy-linked groups rose as the Integrated Oil Index ($XOI +1.36%) and the Oil Services Index ($OSX +1.83%) each posted gains. The Gold & Silver Index ($XAU +1.48%) also rose. The tech sector was mixed as the Semiconductor Index ($SOX +1.14%) and the Networking Index ($NWX +0.82%) rose while the Biotech Index ($BTK -1.33%) finished the session in the red.
PICTURED: The Integrated Oil Index ($XOI +1.36%) has recently been slumping below its 50-day moving average (DMA) line.
| Oil Services |
$OSX |
32.57 |
+0.58 |
+1.81% |
-58.40% |
| Integrated Oil |
$XOI |
770.56 |
+10.37 |
+1.36% |
-39.35% |
| Semiconductor |
$SOX |
1,943.90 |
+21.98 |
+1.14% |
+5.10% |
| Networking |
$NWX |
541.82 |
+4.40 |
+0.82% |
-7.13% |
| Broker/Dealer |
$XBD |
267.81 |
+7.03 |
+2.70% |
-7.77% |
| Retail |
$RLX |
2,938.90 |
+20.48 |
+0.70% |
+19.99% |
| Gold & Silver |
$XAU |
124.73 |
+1.82 |
+1.48% |
+16.66% |
| Bank |
$BKX |
72.99 |
+1.02 |
+1.42% |
-35.61% |
| Biotech |
$BTK |
5,635.11 |
-76.11 |
-1.33% |
+11.20% |
|
|
|
 |
50-Day Moving Average Defines Important Near-Term Support
Kenneth J. Gruneisen - Passed the CAN SLIM® Master's Exam
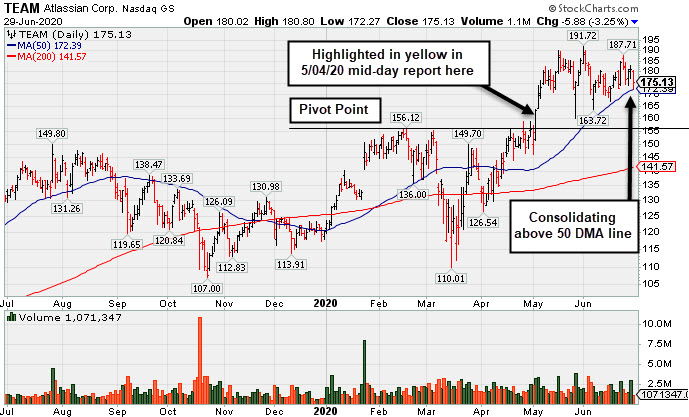
Atlassian Corp (TEAM -$5.88 or -3.25% to $175.13) is consolidating above important support defined by its 50-day moving average (DMA) line ($172.39). The next important near-term support is the prior low ($163.72 on 6/05/20).
TEAM has a 98 Earnings Per Share rating, but fundamental concerns were raised after it recently reported earnings +19% on +33% sales revenues for the Mar '20 quarter, breaking a strong track record of +25% earnings increases (C criteria). This Australia - based software developer had shown 9 consecutive quarterly comparisons above the +25% minimum guideline (C criteria). Its annual earnings (A criteria) history has been strong since its $21 IPO on 12/10/15.
TEAM finished strong after highlighted in yellow with pivot point based on its 2/19/20 high plus 10 cents in the 5/04/20 mid-day report (read here). It hit a new all-time high with a big gain and strong close above the pivot point backed by +61% above average volume clinching a convincing technical buy signal.
TEAM was last shown in the FSU section on 6/05/20 with an annotated graph under the headline, "Positive Reversal Near Prior High and 50 DMA Line". The number of top-rated funds owning its shares rose from 266 in Sep '17 to 734 in Mar '20, a reassuring sign concerning the I criteria. It has a Timeliness Rating of A and Sponsorship Rating of A. Its current Up/Down Volume Ratio of 1.5 is an unbiased indication its shares have been under accumulation or distribution over the past 50 days. |
|
|
Color Codes Explained :
Y - Better candidates highlighted by our
staff of experts.
G - Previously featured
in past reports as yellow but may no longer be buyable under the
guidelines.
***Last / Change / Volume data in this table is the closing quote data***
Symbol/Exchange
Company Name
Industry Group |
PRICE |
CHANGE
(%Change) |
Day High |
Volume
(% DAV)
(% 50 day avg vol) |
52 Wk Hi
% From Hi |
Featured
Date |
Price
Featured |
Pivot Featured |
|
Max Buy |
 FTNT
-
NASDAQ
FTNT
-
NASDAQ
Fortinet Inc
Computer Sftwr-Security
|
$133.47
|
-1.08
-0.80% |
$134.40
|
1,490,772
84.94% of 50 DAV
50 DAV is 1,755,000
|
$149.69
-10.84%
|
6/22/2020
|
$142.68
|
PP = $149.79
|
|
MB = $157.28
|
Most Recent Note - 6/25/2020 6:30:13 PM
Y - Consolidating above its 50 DMA line ($129) and above the prior low ($126.88 on 6/15/20) which define important near-term support to watch on pullbacks. Subsequent gains above the pivot point backed by at least +40% above average volume are needed to trigger a new (or add-on) technical buy signal.
>>> FEATURED STOCK ARTICLE : Managed a "Positive Reversal" After Brief Dip Below "Max Buy" Level - 6/15/2020 |
View all notes |
Set NEW NOTE alert |
Company Profile |
SEC
News |
Chart |
Request a new note
C
A
S
I |
EBS
-
NYSE
Emergent Biosolutions
DRUGS - Biotechnology
|
$75.43
|
+0.15
0.20% |
$76.00
|
643,574
98.26% of 50 DAV
50 DAV is 655,000
|
$93.58
-19.40%
|
6/1/2020
|
$72.10
|
PP = $90.10
|
|
MB = $94.61
|
Most Recent Note - 6/25/2020 6:20:24 PM
G - Held its ground stubbornly in recent weeks and today's volume-driven gain helped it rebound neat its 50 DMA line. Subsequent gains above the 50 DMA line ($77.25) are still needed to help its outlook improve. Any damaging losses below the recent low ($66.69) may trigger a more worrisome technical sell signal. Fundamentals remain strong.
>>> FEATURED STOCK ARTICLE : Still Below 50-Day Moving Average Following Damaging Gap Down - 6/16/2020 |
View all notes |
Set NEW NOTE alert |
Company Profile |
SEC
News |
Chart |
Request a new note
C
A
S
I |
NBIX
-
NASDAQ
Neurocrine Biosciences
DRUGS - Biotechnology
|
$125.50
|
-4.86
-3.73% |
$130.74
|
1,084,660
120.12% of 50 DAV
50 DAV is 903,000
|
$131.00
-4.20%
|
5/19/2020
|
$123.71
|
PP = $119.75
|
|
MB = $125.74
|
 Most Recent Note - 6/29/2020 6:29:34 PM
G - Pulled back today with +20% above average volume, retreating from its all-time high. Prior highs in the $119 area define important near-term support to watch above its 50 DMA line ($114.46). Fundamentals remain strong.
>>> FEATURED STOCK ARTICLE : Pullback Into Prior Base Negated Recent Breakout - 6/8/2020 |
View all notes |
Set NEW NOTE alert |
Company Profile |
SEC
News |
Chart |
Request a new note
C
A
S
I |
BMRN
-
NASDAQ
Biomarin Pharmaceutical
DRUGS - Drug Manufacturers - Other
|
$122.18
|
-1.84
-1.48% |
$124.78
|
1,273,851
74.80% of 50 DAV
50 DAV is 1,703,000
|
$124.95
-2.22%
|
6/17/2020
|
$110.95
|
PP = $112.67
|
|
MB = $118.30
|
Most Recent Note - 6/25/2020 6:26:08 PM
G - Posted a volume-driven gain today for a best ever close. Stubbornly held its ground after a streak of gains for new highs marked by heavy volume. Reported strong results for the Mar '20 quarter and recent comparisons showed improved earnings increases. Annual earnings (A criteria) history has been strong. Prior high ($112.57) defines initial support to watch on pullbacks.
>>> FEATURED STOCK ARTICLE : Hit New 52-Week High But Closed Below Pivot After 3-Weeks Tight - 6/17/2020 |
View all notes |
Set NEW NOTE alert |
Company Profile |
SEC
News |
Chart |
Request a new note
C
A
S
I |
AMD
-
NASDAQ
Advanced Micro Devices
ELECTRONICS - Semiconductor - Broad Line
|
$50.28
|
+0.18
0.36% |
$50.28
|
49,485,961
80.49% of 50 DAV
50 DAV is 61,481,000
|
$59.27
-15.17%
|
6/9/2020
|
$55.41
|
PP = $56.98
|
|
MB = $59.83
|
Most Recent Note - 6/26/2020 6:08:10 PM
G - Slumped further below its 50 DMA line ($53.93) with higher (near average) volume behind today's 4th consecutive loss. A prompt rebound above the 50 DMA line is needed for its outlook to improve. The prior low ($49.09 on 5/27/20) defines the next important support to watch. Met stubborn resistance in the $57-59 area. See the latest FSU analysis for more details and a new annotated graph.
>>> FEATURED STOCK ARTICLE : Slump Below 50-Day Average Toward Prior Low Raises Concerns - 6/26/2020 |
View all notes |
Set NEW NOTE alert |
Company Profile |
SEC
News |
Chart |
Request a new note
C
A
S
I |
Symbol/Exchange
Company Name
Industry Group |
PRICE |
CHANGE
(%Change) |
Day High |
Volume
(% DAV)
(% 50 day avg vol) |
52 Wk Hi
% From Hi |
Featured
Date |
Price
Featured |
Pivot Featured |
|
Max Buy |
TREX
-
NYSE
Trex Company Inc
MATERIALS and CONSTRUCTION - General Building Materials
|
$128.03
|
+0.98
0.77% |
$129.75
|
822,334
77.14% of 50 DAV
50 DAV is 1,066,000
|
$132.84
-3.62%
|
6/26/2020
|
$109.05
|
PP = $132.94
|
|
MB = $139.59
|
Most Recent Note - 6/26/2020 6:24:14 PM
Y - Color code is changed to yellow after forming a short flat base with new pivot point cited based on its 5/26/20 high plus 10 cents. Challenged its all-time high with a big gain today backed by +627% above average volume. Subsequent volume-driven gains for new highs may trigger a new (or add-on) technical buy signal. Prior highs in the $111 area define important support nearly coinciding with its 50 DMA line ($112.24). Fundamentals remain strong.
>>> FEATURED STOCK ARTICLE : Pullback Toward Prior Highs Which Define Near-Term Support - 6/11/2020 |
View all notes |
Set NEW NOTE alert |
Company Profile |
SEC
News |
Chart |
Request a new note
C
A
S
I |
NFLX
-
NASDAQ
Netflix Inc
SPECIALTY RETAIL - Music and Video Stores
|
$447.24
|
+3.84
0.87% |
$447.67
|
4,840,590
65.49% of 50 DAV
50 DAV is 7,391,000
|
$474.01
-5.65%
|
5/14/2020
|
$441.95
|
PP = $449.62
|
|
MB = $472.10
|
Most Recent Note - 6/26/2020 6:14:15 PM
Y - Abruptly retreated from its all-time high with today's big loss backed by higher (near average) volume. Found support near its 50 DMA line ($432.91) during the prior consolidation. Recent gains above a stock's pivot point did not have the minimum +40% above average volume needed to trigger a proper new (or add-on) technical buy signal. Any damaging losses below the 50 DMA line and prior lows would trigger a more worrisome technical sell signal.
>>> FEATURED STOCK ARTICLE : Weak Action Led to 50-Day Moving Average Violation - 6/12/2020 |
View all notes |
Set NEW NOTE alert |
Company Profile |
SEC
News |
Chart |
Request a new note
C
A
S
I |
CHGG
-
NYSE
Chegg Inc
Consumer Svcs-Education
|
$66.73
|
+1.31
2.00% |
$68.28
|
3,896,298
88.09% of 50 DAV
50 DAV is 4,423,000
|
$70.57
-5.44%
|
6/17/2020
|
$63.71
|
PP = $68.08
|
|
MB = $71.48
|
Most Recent Note - 6/29/2020 6:30:33 PM
Y - Posted a 3rd consecutive gain today, but it remains below its pivot point. Disciplined investors may note that the recent gain above the pivot point was not backed by the at least +40% above average volume necessary to trigger a convincing technical buy signal. Confirming gains above the pivot point backed by volume would be a reassuring sign of fresh institutional buying demand.
>>> FEATURED STOCK ARTICLE : Formed a Flat Base Perched Within Striking Distance of 52-Week High - 6/18/2020 |
View all notes |
Set NEW NOTE alert |
Company Profile |
SEC
News |
Chart |
Request a new note
C
A
S
I |
NOW
-
NYSE
Servicenow Inc
Computer Sftwr-Enterprse
|
$394.55
|
-5.42
-1.36% |
$402.99
|
1,388,036
67.58% of 50 DAV
50 DAV is 2,054,000
|
$409.80
-3.72%
|
4/30/2020
|
$343.05
|
PP = $363.05
|
|
MB = $381.20
|
Most Recent Note - 6/25/2020 6:18:51 PM
G - Posted a gain today with light volume. Volume totals have generally been cooling while hovering in a tight trading range perched near its all-time high. It is extended from any sound base. Its 50 DMA line ($365.92) and prior highs in the $362 area define important near-term support to watch on pullbacks. See the latest FSU analysis for more details and a new annotated graph.
>>> FEATURED STOCK ARTICLE : Hovering Near All-Time High With Volume Totals Cooling - 6/25/2020 |
View all notes |
Set NEW NOTE alert |
Company Profile |
SEC
News |
Chart |
Request a new note
C
A
S
I |
TEAM
-
NASDAQ
Atlassian Corp Plc Cl A
Comp Sftwr-Spec Enterprs
|
$175.13
|
-5.88
-3.25% |
$180.80
|
1,071,747
55.70% of 50 DAV
50 DAV is 1,924,000
|
$191.72
-8.65%
|
5/4/2020
|
$159.70
|
PP = $156.22
|
|
MB = $164.03
|
Most Recent Note - 6/29/2020 6:25:51 PM
G - Consolidating above support at its 50 DMA line ($172.39). The next important near-term support is the prior low ($163.72 on 6/05/20). See the latest FSU analysis for more details and a new annotated graph.
>>> FEATURED STOCK ARTICLE : 50-Day Moving Average Defines Important Near-Term Support - 6/29/2020 |
View all notes |
Set NEW NOTE alert |
Company Profile |
SEC
News |
Chart |
Request a new note
C
A
S
I |
Symbol/Exchange
Company Name
Industry Group |
PRICE |
CHANGE
(%Change) |
Day High |
Volume
(% DAV)
(% 50 day avg vol) |
52 Wk Hi
% From Hi |
Featured
Date |
Price
Featured |
Pivot Featured |
|
Max Buy |
TTD
-
NASDAQ
The Trade Desk Inc Cl A
Comml Svcs-Advertising
|
$406.15
|
-0.88
-0.22% |
$407.72
|
1,718,859
80.06% of 50 DAV
50 DAV is 2,147,000
|
$421.06
-3.54%
|
6/3/2020
|
$240.61
|
PP = $327.35
|
|
MB = $343.72
|
Most Recent Note - 6/25/2020 6:31:35 PM
G - Perched near its 52-week high, very extended from any sound base. Prior highs in the $327 area define important near-term support above its 50 DMA line ($316). See the latest FSU analysis for more details and an annotated graph.
>>> FEATURED STOCK ARTICLE : Pullback Breaks Streak of 8 Straight Gains Into New High Ground - 6/24/2020 |
View all notes |
Set NEW NOTE alert |
Company Profile |
SEC
News |
Chart |
Request a new note
C
A
S
I |
DOCU
-
NASDAQ
Docusign Inc
Computer Sftwr-Enterprse
|
$171.67
|
-5.91
-3.33% |
$177.00
|
5,120,591
112.05% of 50 DAV
50 DAV is 4,570,000
|
$180.45
-4.87%
|
6/10/2020
|
$149.73
|
PP = $152.10
|
|
MB = $159.71
|
Most Recent Note - 6/29/2020 6:28:13 PM
G - Pulled back from its all-time high with a loss today on average volume. Very extended from any sound base. Prior high ($152 on 6/02/20) defines initial support to watch well above its 50 DMA line ($133). DOCU is now priced +92% above its 200 DMA price ($89.51), and it is taught in the Certification that a stock trading +70-100% or more above the 200 DMA is to be recognized as a "sell signal".
>>> FEATURED STOCK ARTICLE : Advanced Ascending Base Formed for Strong E-Signature Firm - 6/10/2020 |
View all notes |
Set NEW NOTE alert |
Company Profile |
SEC
News |
Chart |
Request a new note
C
A
S
I |
PING
-
NYSE
Ping Identity Hldg Corp
Computer Sftwr-Security
|
$31.44
|
-0.52
-1.63% |
$32.45
|
515,279
38.98% of 50 DAV
50 DAV is 1,322,000
|
$35.36
-11.09%
|
6/1/2020
|
$29.24
|
PP = $29.90
|
|
MB = $31.40
|
Most Recent Note - 6/29/2020 6:31:28 PM
G - Pulled back today with light volume finished near its "max buy" level. Prior highs in the $29 area define initial support to watch.
>>> FEATURED STOCK ARTICLE : Gain for Recent New High Backed by +71% Above Average Volume - 6/22/2020 |
View all notes |
Set NEW NOTE alert |
Company Profile |
SEC
News |
Chart |
Request a new note
C
A
S
I |
AAXN
-
NASDAQ
Axon Enterprise Inc
Security/Sfty
|
$95.80
|
-0.26
-0.27% |
$97.25
|
761,682
56.17% of 50 DAV
50 DAV is 1,356,000
|
$104.90
-8.67%
|
5/8/2020
|
$84.86
|
PP = $90.20
|
|
MB = $94.71
|
Most Recent Note - 6/26/2020 6:25:41 PM
G - Posted a small gain today with very heavy volume +54% above average. Completed a new Public Offering on 6/17/20. Prior highs in the $90-91 area have acted as support following a powerful breakout. More damaging losses would raise concerns and trigger a technical sell signal.
>>> FEATURED STOCK ARTICLE : Completed New Pubic Offering and Found Support Near Prior High - 6/19/2020 |
View all notes |
Set NEW NOTE alert |
Company Profile |
SEC
News |
Chart |
Request a new note
C
A
S
I |
GDDY
-
NYSE
Godaddy Inc Cl A
Computer Sftwr-Enterprse
|
$72.59
|
+1.03
1.44% |
$72.63
|
1,432,385
96.91% of 50 DAV
50 DAV is 1,478,000
|
$84.49
-14.08%
|
6/2/2020
|
$79.62
|
PP = $82.40
|
|
MB = $86.52
|
Most Recent Note - 6/26/2020 6:11:16 PM
G - Color code is changed to green after violating its 50 DMA line ($74.45) with today's 3rd consecutive volume-driven loss triggering a technical sell signal. A prompt rebound above the 50 DMA line is needed to help its outlook improve. Subsequent gains above the pivot point backed by at least +40% above average volume are needed to clinch a convincing technical buy signal. It previously met stubborn resistance in the $82-84 area.
>>> FEATURED STOCK ARTICLE : Hit a New 52-Week High With Today's 8th Consecutive Gain - 6/23/2020 |
View all notes |
Set NEW NOTE alert |
Company Profile |
SEC
News |
Chart |
Request a new note
C
A
S
I |
Symbol/Exchange
Company Name
Industry Group |
PRICE |
CHANGE
(%Change) |
Day High |
Volume
(% DAV)
(% 50 day avg vol) |
52 Wk Hi
% From Hi |
Featured
Date |
Price
Featured |
Pivot Featured |
|
Max Buy |
|
|
|
THESE ARE NOT BUY RECOMMENDATIONS!
Comments contained in the body of this report are technical
opinions only. The material herein has been obtained
from sources believed to be reliable and accurate, however,
its accuracy and completeness cannot be guaranteed.
This site is not an investment advisor, hence it does
not endorse or recommend any securities or other investments.
Any recommendation contained in this report may not
be suitable for all investors and it is not to be deemed
an offer or solicitation on our part with respect to
the purchase or sale of any securities. All trademarks,
service marks and trade names appearing in this report
are the property of their respective owners, and are
likewise used for identification purposes only.
This report is a service available
only to active Paid Premium Members.
You may opt-out of receiving report notifications
at any time. Questions or comments may be submitted
by writing to Premium Membership Services 665 S.E. 10 Street, Suite 201 Deerfield Beach, FL 33441-5634 or by calling 1-800-965-8307
or 954-785-1121.
|
|
|