You are not logged in.
This means you
CAN ONLY VIEW reports that were published prior to Saturday, February 24, 2024.
You
MUST UPGRADE YOUR MEMBERSHIP if you want to see any current reports.
AFTER MARKET UPDATE - FRIDAY, JUNE 28TH, 2019
Previous After Market Report Next After Market Report >>>
|
|
|
|
DOW |
+73.38 |
26,599.96 |
+0.28% |
|
Volume |
2,105,425,090 |
+189% |
|
Volume |
4,092,233,700 |
+98% |
|
NASDAQ |
+38.48 |
8,006.24 |
+0.48% |
|
Advancers |
2,090 |
73% |
|
Advancers |
2,278 |
73% |
|
S&P 500 |
+16.84 |
2,941.76 |
+0.58% |
|
Decliners |
770 |
27% |
|
Decliners |
847 |
27% |
|
Russell 2000 |
+20.02 |
1,566.57 |
+1.29% |
|
52 Wk Highs |
168 |
|
|
52 Wk Highs |
101 |
|
|
S&P 600 |
+12.91 |
953.25 |
+1.37% |
|
52 Wk Lows |
22 |
|
|
52 Wk Lows |
54 |
|
|
 |
Major Indices Tally Best First Half Gains in Decades
Kenneth J. Gruneisen - Passed the CAN SLIM® Master's Exam
Stocks finished higher on Friday, capping the best June performance since 1955 and the best first half performance in two decades. The Dow added 73 points, while the S&P 500 gained 0.6% and the Nasdaq Composite increased by 0.5%. The volume totals reported were higher on the NYSE and on the Nasdaq exchange, impacted by rebalancing of indices by FTSE Russell. Breadth was positive as advancers led decliners by near a 3-1 margin on the NYSE and on the Nasdaq exchange. Leadership improved as there were 55 high-ranked companies from the Leaders List hit new 52-week highs and were listed on the BreakOuts Page, versus the total of 16 on the prior session. New 52-week highs outnumbered new 52-week lows on the NYSE, but new lows outnumbered new highs on the Nasdaq exchange. The major indices (M criteria) are in a "confirmed uptrend" under the fact-based system. The Featured Stocks Page provides the most timely analysis on high-ranked leaders. Charts used courtesy of www.stockcharts.com
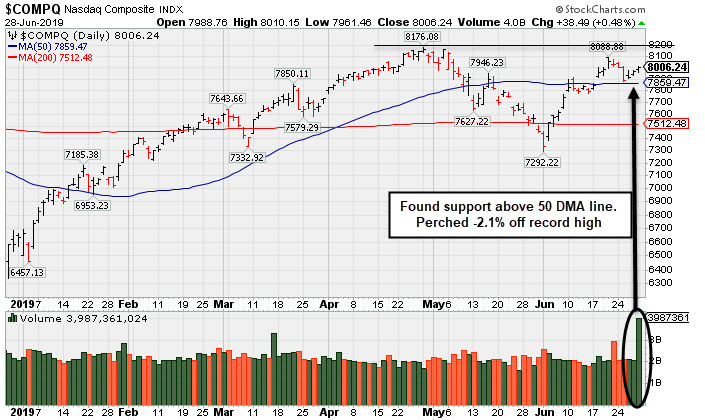
PICTURED: The Nasdaq Composite Index is perched only -2.1% off its record high.
For the week, the S&P 500 lost 0.3%, but gained 6.9% in June and 3.8% for the quarter. The Dow’s 0.4% weekly slide capped a 7.2% June advance and a 2.6% second quarter increase. The Nasdaq also lost 0.3% on the week, but ended the month and quarter 7.4% and 3.6% higher, respectively.
All 11 S&P 500 sectors finished in positive territory. t, with the Financial sector outperforming after the Federal Reserve announced that all U.S. banks passed the central bank’s annual stress tests, clearing the path for each lender to increase dividends and share buybacks.
In earnings news, Constellation Brands (STZ +4.64%) rose after the spirits company topped Wall Street projections on both the top and bottom line. Nike (NKE +0.35%) rose despite the athletic apparel maker missing Wall Street profit projections for the first time since 2012.
On the economic front, the core PCE deflator, which is the Fed’s preferred proxy for inflation, increased 1.6% year-over-year in May, slightly above projections of 1.5%. Additional reports showed that personal income rose more than anticipated in May, while the final report on consumer sentiment from the University of Michigan was revised to 98.2 from the previously reported 97.9. Treasuries were little-changed after the updates, with the 10-year note yield finishing at 2.01%.
|
 Kenneth J. Gruneisen started out as a licensed stockbroker in August 1987, a couple of months prior to the historic stock market crash that took the Dow Jones Industrial Average down -22.6% in a single day. He has published daily fact-based fundamental and technical analysis on high-ranked stocks online for two decades. Through FACTBASEDINVESTING.COM, Kenneth provides educational articles, news, market commentary, and other information regarding proven investment systems that work in good times and bad.
Comments contained in the body of this report are technical opinions only and are not necessarily those of Gruneisen Growth Corp. The material herein has been obtained from sources believed to be reliable and accurate, however, its accuracy and completeness cannot be guaranteed. Our firm, employees, and customers may effect transactions, including transactions contrary to any recommendation herein, or have positions in the securities mentioned herein or options with respect thereto. Any recommendation contained in this report may not be suitable for all investors and it is not to be deemed an offer or solicitation on our part with respect to the purchase or sale of any securities. |
|
 |
Financial, Biotech, and Commodity-Linked Groups Rose
Kenneth J. Gruneisen - Passed the CAN SLIM® Master's Exam
The Broker/Dealer Index ($XBD +1.53%) and Bank Index ($BKX +1.98%) both posted solid gains while the Retail Index ($RLX +0.5%) finished flat on Friday. Commodity-linked groups had a positive bias as the Gold & Silver Index ($XAU +0.85%) and Oil Services Index ($OSX +2.59%) both outpaced the Integrated Oil Index ($XOI +0.74%). The tech sector was led by the Biotech Index ($BTK +2.06%) while both the Semiconductor Index ($SOX +0.14%) and Networking Index ($NWX -0.11%) were little changed.
Charts courtesy of www.stockcharts.com
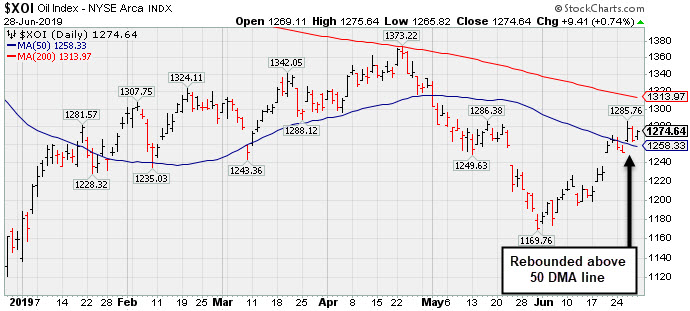 PICTURED: The Integrated Oil Index ($XOI +0.74%) recently rebounded above its 50-day moving average (DMA) line.
| Oil Services |
$OSX |
81.34 |
+2.05 |
+2.59% |
+0.92% |
| Integrated Oil |
$XOI |
1,274.64 |
+9.41 |
+0.74% |
+9.97% |
| Semiconductor |
$SOX |
1,458.96 |
+2.06 |
+0.14% |
+26.30% |
| Networking |
$NWX |
567.78 |
-0.62 |
-0.11% |
+16.19% |
| Broker/Dealer |
$XBD |
267.17 |
+4.03 |
+1.53% |
+12.57% |
| Retail |
$RLX |
2,361.85 |
+1.19 |
+0.05% |
+21.03% |
| Gold & Silver |
$XAU |
84.13 |
+0.72 |
+0.86% |
+19.06% |
| Bank |
$BKX |
97.99 |
+1.90 |
+1.98% |
+14.22% |
| Biotech |
$BTK |
4,788.12 |
+96.56 |
+2.06% |
+13.44% |
|
|
|
 |
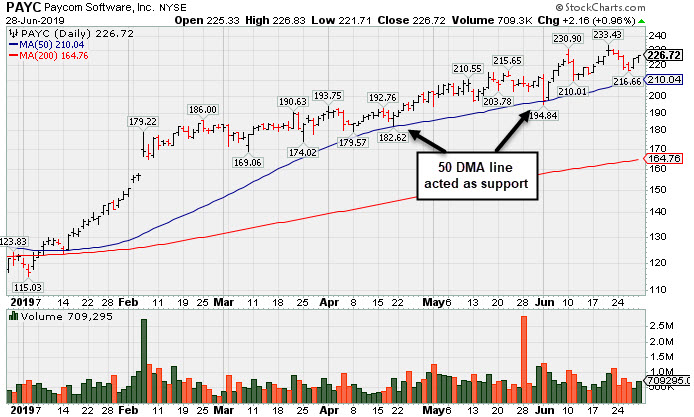
Perched Near High Extended From Any Sound Base
Kenneth J. Gruneisen - Passed the CAN SLIM® Master's Exam
Paycom Software Inc (PAYC +$2.16 or +0.96% to $226.72) is extended from any sound base and recently encountered distributional pressure after quietly hitting a new all-time high. Its 50-day moving average (DMA) line ($210) defines near-term support to watch above the recent low ($194.84 on 6/03/19). That important short-term average acted as support during its ongoing ascent.
It reported earnings +25% on +30% sales revenues for the Mar '19 quarter, right at the +25% minimum earnings guideline (C criteria). Prior comparisons established its strong earnings track record. It has earned a 96 Earnings Per Share Rating.
The high-ranked Computer Software - Enterprise firm was last shown in this FSU section on 5/31/19 under the headline, "Posted Volume-Driven Gain While Hovering Near All-Time High". It was highlighted in yellow with new pivot point cited based on its 9/14/18 high plus 10 cents in the 2/06/19 mid-day report (read here). A "breakaway gap" cleared all overhead supply and triggered a technical buy signal.
The current Up/Down Volume Ratio of 1.2 is an unbiased indication its shares have been under accumulation over the past 50 days. Its small supply of only 58.5 million shares outstanding (S criteria) can contribute to greater price volatility in the event of institutional buying or selling. The number of top-rated funds owning its shares rose from 384 in Jun '17 to 523 in Mar '19, a reassuring sign concerning the I criteria. It has a Timeliness rating of A and Sponsorship rating of B. It completed Secondary Offerings on 11/13/15, 9/16/15, 5/15/15 and 1/14/15 since its $15 IPO on 4/15/14.
|
|
|
Color Codes Explained :
Y - Better candidates highlighted by our
staff of experts.
G - Previously featured
in past reports as yellow but may no longer be buyable under the
guidelines.
***Last / Change / Volume data in this table is the closing quote data***
Symbol/Exchange
Company Name
Industry Group |
PRICE |
CHANGE
(%Change) |
Day High |
Volume
(% DAV)
(% 50 day avg vol) |
52 Wk Hi
% From Hi |
Featured
Date |
Price
Featured |
Pivot Featured |
|
Max Buy |
 SPSC
-
NASDAQ
SPSC
-
NASDAQ
S P S Commerce Inc
COMPUTER SOFTWARE and SERVICES - Application Software
|
$102.21
|
+0.57
0.56% |
$103.32
|
376,853
240.03% of 50 DAV
50 DAV is 157,000
|
$115.00
-11.12%
|
6/7/2019
|
$107.72
|
PP = $115.10
|
|
MB = $120.86
|
Most Recent Note - 6/24/2019 5:34:41 PM
G - Color code is changed to green after it slumped below its 50 DMA line ($104.44) with today's big loss on light volume. A rebound and subsequent volume-driven gains above the pivot point are needed to trigger a new (or add-on) technical buy signal. Faces some resistance due to overhead supply up to the $115 level. Recent lows in the $98-99 area define important near-term support to watch. Fundamentals remain strong.
>>> FEATURED STOCK ARTICLE : Base Building Now Above 50-Day Moving Average Line - 6/7/2019 |
View all notes |
Set NEW NOTE alert |
Company Profile |
SEC
News |
Chart |
Request a new note
C
A
S
I |
EPAM
-
NYSE
Epam Systems Inc
COMPUTER SOFTWARE and SERVICES - Information Technology Service
|
$173.10
|
+0.17
0.10% |
$174.29
|
523,216
108.78% of 50 DAV
50 DAV is 481,000
|
$180.55
-4.13%
|
5/9/2019
|
$169.25
|
PP = $180.55
|
|
MB = $189.58
|
Most Recent Note - 6/26/2019 5:45:49 PM
Y - Volume has been cooling while still perched within close striking distance of its 52-week high. Consolidating quietly near its 50 DMA line ($172). Subsequent gains above the pivot point backed by at least +40% above average volume may trigger a new (or add-on) technical buy signal.
>>> FEATURED STOCK ARTICLE : Perched Near Pivot Point After a New Flat Base - 6/13/2019 |
View all notes |
Set NEW NOTE alert |
Company Profile |
SEC
News |
Chart |
Request a new note
C
A
S
I |
ENV
-
NYSE
Envestnet Inc
FINANCIAL SERVICES - Diversified Investments
|
$68.37
|
+0.67
0.99% |
$68.63
|
761,196
263.39% of 50 DAV
50 DAV is 289,000
|
$72.67
-5.92%
|
3/15/2019
|
$66.05
|
PP = $64.90
|
|
MB = $68.15
|
Most Recent Note - 6/25/2019 1:54:33 PM
G - Sputtering below its 50 DMA line ($69.10). Prior lows in the $65-66 area define the next important near-term support to watch. Recently reported earnings +5% on +1% sales revenues for the Mar '19 quarter, below the +25% minimum earnings guideline (C criteria).
>>> FEATURED STOCK ARTICLE : Rebound Above 50-Day Moving Average Improved Technical Stance - 6/4/2019 |
View all notes |
Set NEW NOTE alert |
Company Profile |
SEC
News |
Chart |
Request a new note
C
A
S
I |
LHCG
-
NASDAQ
L H C Group Inc
HEALTH SERVICES - Home Health Care
|
$119.58
|
+1.71
1.45% |
$120.95
|
400,622
168.33% of 50 DAV
50 DAV is 238,000
|
$122.20
-2.14%
|
4/29/2019
|
$110.94
|
PP = $115.64
|
|
MB = $121.42
|
Most Recent Note - 6/24/2019 2:55:28 PM
Y - Sputtering near its pivot point, meanwhile its 50 DMA line ($113) defines near-term support above recent lows. Fundamentals remain strong.
>>> FEATURED STOCK ARTICLE : Prior Gains Lacked Volume; 50-Day Moving Average Defines Support - 6/17/2019 |
View all notes |
Set NEW NOTE alert |
Company Profile |
SEC
News |
Chart |
Request a new note
C
A
S
I |
ENSG
-
NASDAQ
Ensign Group Inc
HEALTH SERVICES - Long-Term Care Facilities
|
$56.92
|
+0.64
1.14% |
$58.21
|
722,497
240.83% of 50 DAV
50 DAV is 300,000
|
$58.35
-2.45%
|
4/30/2019
|
$51.46
|
PP = $53.30
|
|
MB = $55.97
|
Most Recent Note - 6/25/2019 1:52:42 PM
G - Color code is changed to green while hovering near its all-time high, extended from the previously noted "double bottom" base. Its 50 DMA line ($53.65) and recent low ($52.34 on 5/31/19) define near-term support to watch. Recently reported earnings +22% on +12% sales revenues for the Mar '19 quarter, below the +25% minimum earnings guideline (C criteria), raising fundamental concerns.
>>> FEATURED STOCK ARTICLE : Resilient After Latest Quarterly Report Missed Minimum Guideline - 6/3/2019 |
View all notes |
Set NEW NOTE alert |
Company Profile |
SEC
News |
Chart |
Request a new note
C
A
S
I |
Symbol/Exchange
Company Name
Industry Group |
PRICE |
CHANGE
(%Change) |
Day High |
Volume
(% DAV)
(% 50 day avg vol) |
52 Wk Hi
% From Hi |
Featured
Date |
Price
Featured |
Pivot Featured |
|
Max Buy |
CHDN
-
NASDAQ
Churchill Downs Inc
LEISURE - Gaming Activities
|
$115.07
|
+1.61
1.42% |
$115.55
|
517,635
153.15% of 50 DAV
50 DAV is 338,000
|
$117.14
-1.77%
|
6/5/2019
|
$108.87
|
PP = $104.96
|
|
MB = $110.21
|
Most Recent Note - 6/24/2019 2:49:59 PM
G - Retreating from its all-time high with today's 3rd consecutive loss. Prior highs in the $104 area define initial support to watch above its 50 DMA line ($101). Share price was impacted by a 3:1 split when noted on 1/28/19.
>>> FEATURED STOCK ARTICLE : Consolidating Near 50-Day Moving Average - 6/29/2018 |
View all notes |
Set NEW NOTE alert |
Company Profile |
SEC
News |
Chart |
Request a new note
C
A
S
I |
WWD
-
NASDAQ
Woodward Inc
MANUFACTURING - Diversified Machinery
|
$113.16
|
+0.08
0.07% |
$114.47
|
5,927,838
1,317.30% of 50 DAV
50 DAV is 450,000
|
$116.46
-2.83%
|
6/18/2019
|
$112.34
|
PP = $114.65
|
|
MB = $120.38
|
 Most Recent Note - 6/28/2019 5:57:36 PM
Y - Churned heavy volume today without making price progress, yet it remains perched near its all-time high. Subsequent gains above the pivot point backed by at least +40% above average volume may clinch a convincing technical buy signal. Fundamentals remain strong.
>>> FEATURED STOCK ARTICLE : High Ranked Industrial Firm Perched Near All-Time High - 6/18/2019 |
View all notes |
Set NEW NOTE alert |
Company Profile |
SEC
News |
Chart |
Request a new note
C
A
S
I |
LULU
-
NASDAQ
Lululemon Athletica
MANUFACTURING - Textile Manufacturing
|
$180.21
|
+0.10
0.06% |
$181.11
|
2,800,079
130.72% of 50 DAV
50 DAV is 2,142,000
|
$190.52
-5.41%
|
6/13/2019
|
$174.48
|
PP = $179.60
|
|
MB = $188.58
|
Most Recent Note - 6/24/2019 5:32:46 PM
Y - Consolidating above the prior high ($179.50 on 4/24/19) which defines initial support to watch. The 50 DMA line ($174) and prior low ($160.88 on 5/29/19) define the next important support. Reported Apr '19 quarterly earnings +35% on +20% sales revenues versus the ear ago period.
>>> FEATURED STOCK ARTICLE : Perched Near High Following Another Strong Earnings Report - 6/14/2019 |
View all notes |
Set NEW NOTE alert |
Company Profile |
SEC
News |
Chart |
Request a new note
C
A
S
I |
ULTA
-
NASDAQ
Ulta Beauty Inc
SPECIALTY RETAIL - Specialty Retail, Other
|
$346.89
|
+2.67
0.78% |
$347.38
|
665,703
88.17% of 50 DAV
50 DAV is 755,000
|
$365.54
-5.10%
|
3/15/2019
|
$341.27
|
PP = $322.59
|
|
MB = $338.72
|
Most Recent Note - 6/24/2019
G - Testing its 50 DMA line ($344) while today's big loss on higher volume is indicative of distributional pressure after wedging higher with gains backed by lackluster volume as it challenged it all-time high. Reported earnings +17% on +13% sales revenues for the Apr '19 quarter, below the +25% minimum earnings guideline (C criteria), raising fundamental concerns.
>>> FEATURED STOCK ARTICLE : Sputtering Below 50-Day Moving Average Following Sub Par Earnings - 6/6/2019 |
View all notes |
Set NEW NOTE alert |
Company Profile |
SEC
News |
Chart |
Request a new note
C
A
S
I |
ESNT
-
NYSE
Essent Group Ltd
Finance-MrtgandRel Svc
|
$46.99
|
+0.31
0.66% |
$47.13
|
1,011,129
159.74% of 50 DAV
50 DAV is 633,000
|
$50.51
-6.97%
|
3/18/2019
|
$45.84
|
PP = $45.06
|
|
MB = $47.31
|
Most Recent Note - 6/25/2019 12:27:08 PM
G - Raised concerns as it violated its 50 DMA line ($47.46) during a streak of 4 consecutive losses. Recently reported earnings +15% on +20% sales revenues for the Mar '19 quarter, below the +25% minimum earnings guideline (C criteria), raising fundamental concerns.
>>> FEATURED STOCK ARTICLE : Still Hovering Not Far From 52-Week High - 6/5/2019 |
View all notes |
Set NEW NOTE alert |
Company Profile |
SEC
News |
Chart |
Request a new note
C
A
S
I |
Symbol/Exchange
Company Name
Industry Group |
PRICE |
CHANGE
(%Change) |
Day High |
Volume
(% DAV)
(% 50 day avg vol) |
52 Wk Hi
% From Hi |
Featured
Date |
Price
Featured |
Pivot Featured |
|
Max Buy |
NOW
-
NYSE
Servicenow Inc
Computer Sftwr-Enterprse
|
$274.57
|
-3.94
-1.41% |
$280.19
|
4,105,829
233.02% of 50 DAV
50 DAV is 1,762,000
|
$292.98
-6.28%
|
4/22/2019
|
$242.64
|
PP = $251.75
|
|
MB = $264.34
|
Most Recent Note - 6/26/2019 5:34:34 PM
G - Pulled back from its all-time high with 4 consecutive losses. Its 50 DMA line ($266) defines near-term support to watch. Recently reported earnings +20% on +34% sales revenues for the Mar '19 quarter, below the +25% minimum earnings guideline (C criteria), raising fundamental concerns. See the latest FSU analysis for more details and a new annotated graph.
>>> FEATURED STOCK ARTICLE : Pulling Back After Wedging to New Highs - 6/26/2019 |
View all notes |
Set NEW NOTE alert |
Company Profile |
SEC
News |
Chart |
Request a new note
C
A
S
I |
VEEV
-
NYSE
Veeva Systems Inc Cl A
Computer Sftwr-Medical
|
$162.11
|
+1.60
1.00% |
$162.31
|
2,233,303
148.69% of 50 DAV
50 DAV is 1,502,000
|
$173.65
-6.65%
|
5/30/2019
|
$154.32
|
PP = $145.80
|
|
MB = $153.09
|
Most Recent Note - 6/27/2019 7:44:11 PM
G -Halted its slide with a solid gain today after 4 consecutive volume-driven losses. It remains very extended from any sound base. Its 50 DMA line ($148.75) defines near-term support. Reported earnings +52% on +25% sales revenues for the Apr '19 quarter, marking its 5th strong quarter with earnings above the +25% minimum guideline (C criteria). See the latest FSU analysis for more details and a new annotated graph.
>>> FEATURED STOCK ARTICLE : Halted Slide After 4 Volume-Driven Losses From High - 6/27/2019 |
View all notes |
Set NEW NOTE alert |
Company Profile |
SEC
News |
Chart |
Request a new note
C
A
S
I |
PAYC
-
NYSE
Paycom Software Inc
COMPUTER SOFTWARE and SERVICES - Application Software
|
$226.72
|
+2.16
0.96% |
$226.83
|
707,921
89.27% of 50 DAV
50 DAV is 793,000
|
$233.43
-2.87%
|
2/6/2019
|
$171.66
|
PP = $164.18
|
|
MB = $172.39
|
Most Recent Note - 6/28/2019 5:51:11 PM
G - Extended from any sound base and hovering near its all-time high. Its 50 DMA line ($210) defines near-term support to watch above the recent low ($194.84 on 6/03/19). Reported earnings +25% on +30% sales revenues for the Mar '19 quarter. See the latest FSU analysis for more details and a new annotated graph.
>>> FEATURED STOCK ARTICLE : Perched Near High Extended From Any Sound Base - 6/28/2019 |
View all notes |
Set NEW NOTE alert |
Company Profile |
SEC
News |
Chart |
Request a new note
C
A
S
I |
PYPL
-
NASDAQ
Paypal Holdings Inc
Finance-CrdtCard/PmtPr
|
$114.46
|
+0.79
0.69% |
$114.62
|
6,490,328
110.47% of 50 DAV
50 DAV is 5,875,000
|
$119.95
-4.58%
|
1/24/2019
|
$92.56
|
PP = $93.80
|
|
MB = $98.49
|
Most Recent Note - 6/26/2019 5:48:28 PM
G - Gapped down on 6/21/19 for a volume-driven loss retreating from its all-time high after quiet gains. Did not form a sound base, yet promptly rebounded after violating its 50 DMA line and prior low ($106.52) on 6/03/19. Recently reported earnings +37% on +12% sales revenues for the Mar '19 quarter, continuing its strong earnings track record.
>>> FEATURED STOCK ARTICLE : Popular Payments Firm Extended From Any Sound Base - 6/19/2019 |
View all notes |
Set NEW NOTE alert |
Company Profile |
SEC
News |
Chart |
Request a new note
C
A
S
I |
PLNT
-
NYSE
Planet Fitness Inc Cl A
Leisure-Services
|
$72.44
|
-0.69
-0.94% |
$73.47
|
10,958,044
734.95% of 50 DAV
50 DAV is 1,491,000
|
$81.90
-11.55%
|
11/7/2018
|
$57.10
|
PP = $55.45
|
|
MB = $58.22
|
Most Recent Note - 6/28/2019 5:53:04 PM
G - Churned heavy volume today. Fundamentals remain strong. A rebound above the 50 DMA line ($76.38) is needed for its outlook to improve.
>>> FEATURED STOCK ARTICLE : Undercut 50-Day Moving Average With Volume Behind Losses - 6/21/2019 |
View all notes |
Set NEW NOTE alert |
Company Profile |
SEC
News |
Chart |
Request a new note
C
A
S
I |
Symbol/Exchange
Company Name
Industry Group |
PRICE |
CHANGE
(%Change) |
Day High |
Volume
(% DAV)
(% 50 day avg vol) |
52 Wk Hi
% From Hi |
Featured
Date |
Price
Featured |
Pivot Featured |
|
Max Buy |
BLD
-
NYSE
Topbuild Corp
Bldg-Constr Prds/Misc
|
$82.76
|
+2.21
2.74% |
$83.47
|
413,048
121.48% of 50 DAV
50 DAV is 340,000
|
$86.96
-4.83%
|
5/17/2019
|
$82.19
|
PP = $87.31
|
|
MB = $91.68
|
Most Recent Note - 6/28/2019 5:59:36 PM
Y - Posted a solid gain today after finding prompt support at its 50 DMA line ($78.48) this week. Ended perched within striking distance of its 52-week high. Subsequent gains above the pivot point backed by at least +40% above average volume may trigger a technical buy signal. Fundamentals remain strong.
>>> FEATURED STOCK ARTICLE : Found Support at 50-Day Moving Averge Line - 6/20/2019 |
View all notes |
Set NEW NOTE alert |
Company Profile |
SEC
News |
Chart |
Request a new note
C
A
S
I |
TEAM
-
NASDAQ
Atlassian Corp Plc Cl A
Comp Sftwr-Spec Enterprs
|
$130.84
|
-0.20
-0.15% |
$131.85
|
1,209,357
68.87% of 50 DAV
50 DAV is 1,756,000
|
$137.78
-5.04%
|
5/24/2019
|
$129.52
|
PP = $132.09
|
|
MB = $138.69
|
Most Recent Note - 6/24/2019 5:31:03 PM
Y - Pulled back for a second session with below average volume. The 50 DMA line ($121) and prior low ($115.87 on 6/03/19) define important near-term support to watch. Reported earnings +133% on +38% sales revenues for the Mar '19 quarter, continuing its strong earnings track record. See the latest FSU analysis for more details and a new annotated graph.
>>> FEATURED STOCK ARTICLE : Perched at High After Wedging into New High Territory - 6/24/2019 |
View all notes |
Set NEW NOTE alert |
Company Profile |
SEC
News |
Chart |
Request a new note
C
A
S
I |
UPLD
-
NASDAQ
Upland Software Inc
Computer Sftwr-Enterprse
|
$45.53
|
+1.68
3.83% |
$45.76
|
1,547,991
269.68% of 50 DAV
50 DAV is 574,000
|
$54.87
-17.02%
|
6/10/2019
|
$53.30
|
PP = $50.74
|
|
MB = $53.28
|
Most Recent Note - 6/28/2019 5:55:54 PM
G - Churned heavy volume today. A rebound above the 50 DMA line ($46.91) is needed for its outlook to improve. Recent losses completely negated the prior breakout from an advanced ascending base. Completed a new Public Offering on 5/08/19. Quarterly comparisons through Mar '19 have shown impressive sales revenues growth and greatly improved earnings increases above the +25% minimum guideline (C criteria).
>>> FEATURED STOCK ARTICLE : Rose From an Advanced Ascending Base - 6/10/2019 |
View all notes |
Set NEW NOTE alert |
Company Profile |
SEC
News |
Chart |
Request a new note
C
A
S
I |
GLOB
-
NYSE
Globant SA
Computer-Tech Services
|
$101.05
|
+1.74
1.75% |
$101.13
|
385,806
91.86% of 50 DAV
50 DAV is 420,000
|
$105.33
-4.06%
|
2/15/2019
|
$69.35
|
PP = $70.00
|
|
MB = $73.50
|
Most Recent Note - 6/24/2019 2:53:36 PM
G - Pulling back today following 5 consecutive gains into new high territory. Very extended from any sound base. Its 50 DMA line ($88.38) defines important support where a violation would raise concerns and trigger a technical sell signal. Fundamentals remain strong.
>>> FEATURED STOCK ARTICLE : Posted Big Gain for Another New High Close - 6/12/2019 |
View all notes |
Set NEW NOTE alert |
Company Profile |
SEC
News |
Chart |
Request a new note
C
A
S
I |
PAGS
-
NYSE
Pagseguro Digital Cl A
Finance-CrdtCard/PmtPr
|
$38.97
|
+1.33
3.53% |
$39.20
|
1,736,518
73.80% of 50 DAV
50 DAV is 2,353,000
|
$38.25
1.88%
|
6/25/2019
|
$37.69
|
PP = $40.07
|
|
MB = $42.07
|
Most Recent Note - 6/28/2019 6:02:34 PM
Y - Posted a gain today hitting a new 52-week high and ending at its second-best close ever. It was highlighted in yellow with pivot point cited based on its 3/29/18 high plus 10 cents in the 6/25/19 mid-day report. Faces no resistance due to overhead. Subsequent volume-driven gains for new highs may trigger a technical buy signal. Quarterly comparisons through Mar '19 showed earnings increases above the +25% minimum guideline (C criteria), however, sequential comparisons have shown deceleration in its sales revenues and earnings growth rate. Limited history for this Brazil-based firm is also a concern. Completed its $21.50 IPO on 1/24/18. See the latest FSU analysis for more details and an annotated graph.
>>> FEATURED STOCK ARTICLE : Brazilian Payment Tech Firm Perched Near High - 6/25/2019 |
View all notes |
Set NEW NOTE alert |
Company Profile |
SEC
News |
Chart |
Request a new note
C
A
S
I |
Symbol/Exchange
Company Name
Industry Group |
PRICE |
CHANGE
(%Change) |
Day High |
Volume
(% DAV)
(% 50 day avg vol) |
52 Wk Hi
% From Hi |
Featured
Date |
Price
Featured |
Pivot Featured |
|
Max Buy |
|
|
|
THESE ARE NOT BUY RECOMMENDATIONS!
Comments contained in the body of this report are technical
opinions only. The material herein has been obtained
from sources believed to be reliable and accurate, however,
its accuracy and completeness cannot be guaranteed.
This site is not an investment advisor, hence it does
not endorse or recommend any securities or other investments.
Any recommendation contained in this report may not
be suitable for all investors and it is not to be deemed
an offer or solicitation on our part with respect to
the purchase or sale of any securities. All trademarks,
service marks and trade names appearing in this report
are the property of their respective owners, and are
likewise used for identification purposes only.
This report is a service available
only to active Paid Premium Members.
You may opt-out of receiving report notifications
at any time. Questions or comments may be submitted
by writing to Premium Membership Services 665 S.E. 10 Street, Suite 201 Deerfield Beach, FL 33441-5634 or by calling 1-800-965-8307
or 954-785-1121.
|
|
|