You are not logged in.
This means you
CAN ONLY VIEW reports that were published prior to Saturday, February 24, 2024.
You
MUST UPGRADE YOUR MEMBERSHIP if you want to see any current reports.
AFTER MARKET UPDATE - THURSDAY, JUNE 27TH, 2019
Previous After Market Report Next After Market Report >>>
|
|
|
|
DOW |
-10.24 |
26,526.58 |
-0.04% |
|
Volume |
727,272,640 |
-11% |
|
Volume |
2,061,819,340 |
-1% |
|
NASDAQ |
+57.79 |
7,967.76 |
+0.73% |
|
Advancers |
2,074 |
72% |
|
Advancers |
2,294 |
74% |
|
S&P 500 |
+11.14 |
2,924.92 |
+0.38% |
|
Decliners |
807 |
28% |
|
Decliners |
790 |
26% |
|
Russell 2000 |
+28.78 |
1,546.55 |
+1.90% |
|
52 Wk Highs |
98 |
|
|
52 Wk Highs |
46 |
|
|
S&P 600 |
+17.70 |
940.34 |
+1.92% |
|
52 Wk Lows |
31 |
|
|
52 Wk Lows |
62 |
|
|
 |
Breadth Positive While Major Indices Ended Mixed
Kenneth J. Gruneisen - Passed the CAN SLIM® Master's Exam
Stocks finished mixed Thursday, as investors await further trade updates from the upcoming G-20 summit. The Dow fell 10 points, while the S&P 500 advanced 0.4% to snap its four day losing streak. The Nasdaq Composite climbed 0.7%. The volume totals reported were lighter on the NYSE and on the Nasdaq exchange. Advancers led decliners by more than a 2-1 margin on the NYSE and nearly 3-1 on the Nasdaq exchange. There were 16 high-ranked companies from the Leaders List hit new 52-week highs and were listed on the BreakOuts Page, versus the total of 8 on the prior session. New 52-week highs outnumbered new 52-week lows on the NYSE, but new lows outnumbered new highs on the Nasdaq exchange. The major indices (M criteria) are in a "confirmed uptrend" under the fact-based system. The Featured Stocks Page provides the most timely analysis on high-ranked leaders. Charts used courtesy of www.stockcharts.com

PICTURED: The S&P 500 Index is perched only -1.4% off its record high.
Overnight, a Chinese newspaper reported that Washington and Beijing had tentatively agreed to a truce that would reignite negotiations and delay the implementation of subsequent tariffs. The early optimism was tempered, after the White House’s top economic advisor, Larry Kudlow, stated additional tariffs are still an option and stated the President is content where the United States economy stands. An additional report suggested the U.S. is unlikely to agree to lift any restrictions on Chinese tech-giant Huawei in any formal trade agreement.
On the data front, the final reading on first-quarter U.S. GDP showed the economy expanded at an unrevised 3.1% annualized pace, slightly below expectations for a 3.2% reading. Separately, pending home sales rebounded 1.1% in May from a 1.5% decline in the prior period. Treasuries strengthened, with the yield on the 10-year note down four basis points to 2.00%.
The Financials and Healthcare sectors paced the gains as large-cap bank and bio-tech shares outperformed. In corporate news, Boeing (BA -2.91%) fell after federal regulators found new safety risks on the grounded 737 Max aircrafts. In earnings, KB Home (KBH +7.90%) after topping analyst estimates on both the top and bottom line. Walgreens Boots Alliance (WBA +4.09%) rose after besting profit expectations. Conagra Brands (CAG -12.10%) slumped after missing Wall Street earnings projections and lowering its forward guidance.
|
 Kenneth J. Gruneisen started out as a licensed stockbroker in August 1987, a couple of months prior to the historic stock market crash that took the Dow Jones Industrial Average down -22.6% in a single day. He has published daily fact-based fundamental and technical analysis on high-ranked stocks online for two decades. Through FACTBASEDINVESTING.COM, Kenneth provides educational articles, news, market commentary, and other information regarding proven investment systems that work in good times and bad.
Comments contained in the body of this report are technical opinions only and are not necessarily those of Gruneisen Growth Corp. The material herein has been obtained from sources believed to be reliable and accurate, however, its accuracy and completeness cannot be guaranteed. Our firm, employees, and customers may effect transactions, including transactions contrary to any recommendation herein, or have positions in the securities mentioned herein or options with respect thereto. Any recommendation contained in this report may not be suitable for all investors and it is not to be deemed an offer or solicitation on our part with respect to the purchase or sale of any securities. |
|
 |
Financial, Retail, and Tech Indexes Rose
Kenneth J. Gruneisen - Passed the CAN SLIM® Master's Exam
The Broker/Dealer Index ($XBD +1.64%) and Bank Index ($BKX +0.79%) both outpaced the Retail Index ($RLX +0.30%). Commodity-linked groups had a negative bias as the Gold & Silver Index ($XAU -0.39%) and Integrated Oil Index ($XOI -1.02%) slumped and the Oil Services Index ($OSX -0.05%) finished flat. The tech sector had a positive bias as the Biotech Index ($BTK +1.86%) and Semiconductor Index ($SOX +1.47%) both outpaced the Networking Index ($NWX +0.49%).
Charts courtesy of www.stockcharts.com
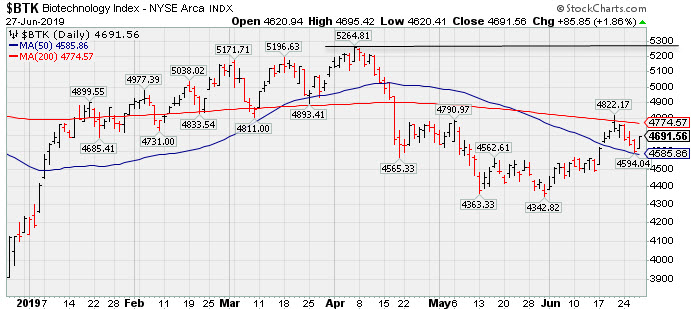 PICTURED: The Biotech Index ($BTK +1.86%) posted a solid gain, consolidating above its 50-day moving average (DMA) line. It recently met resistance at its 200-day moving average (DMA) line.
| Oil Services |
$OSX |
79.29 |
-0.04 |
-0.05% |
-1.63% |
| Integrated Oil |
$XOI |
1,265.24 |
-13.09 |
-1.02% |
+9.16% |
| Semiconductor |
$SOX |
1,456.90 |
+21.07 |
+1.47% |
+26.12% |
| Networking |
$NWX |
568.40 |
+2.79 |
+0.49% |
+16.32% |
| Broker/Dealer |
$XBD |
263.15 |
+4.23 |
+1.64% |
+10.87% |
| Retail |
$RLX |
2,360.66 |
+7.11 |
+0.30% |
+20.97% |
| Gold & Silver |
$XAU |
83.41 |
-0.33 |
-0.39% |
+18.04% |
| Bank |
$BKX |
96.09 |
+0.75 |
+0.79% |
+12.01% |
| Biotech |
$BTK |
4,691.56 |
+85.85 |
+1.86% |
+11.15% |
|
|
|
 |
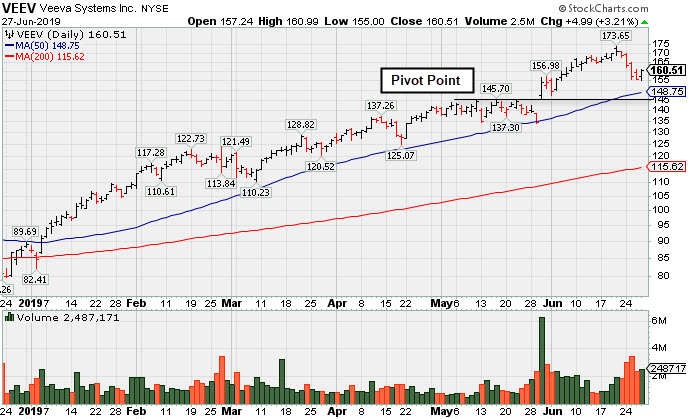
Halted Slide After 4 Volume-Driven Losses From High
Kenneth J. Gruneisen - Passed the CAN SLIM® Master's Exam
Veeva Systems Inc Cl A (VEEV +$4.99 or +3.21% to $160.51) halted its slide today after abruptly retreating from its all-time high with 4 consecutive volume-driven losses. It remains very extended from any sound base. Its 50-day moving average (DMA) line ($148.75) defines near-term support.
It was highlighted in yellow with pivot point cited based on its 5/16/19 high plus 10 cents in the 5/30/19 mid-day report (read here) and last shown in this FSU section that evening with an annotated graph under the headline, "Big Volume-Driven Gain for New High Following Earnings News". It gapped up hitting a new all-time high, rallying from the previously noted advanced "3 weeks tight" base. Members were reminded, "Volume and volatility often increase near earnings news."
Bullish action came after it reported earnings +52% on +25% sales revenues for the Apr '19 quarter, marking its 5th strong quarter with earnings above the +25% minimum guideline (C criteria). Its annual earnings (A criteria) history has been strong. It has the highest possible 99 Earnings Per Share (EPS) rank and it has a 98 Relative Strength (RS) rating. Both of those ratings must be above 80 for a stock to meet the guidelines for consideration.
The number of top-rated funds owning its shares rose from 814 in Jun '18 to 1,122 in Mar '19, a reassuring sign concerning the I criteria. Its current Up/Down Volume Ratio of 1.4 is an unbiased indication its shares have been under accumulation over the past 50 days.
|
|
|
Color Codes Explained :
Y - Better candidates highlighted by our
staff of experts.
G - Previously featured
in past reports as yellow but may no longer be buyable under the
guidelines.
***Last / Change / Volume data in this table is the closing quote data***
Symbol/Exchange
Company Name
Industry Group |
PRICE |
CHANGE
(%Change) |
Day High |
Volume
(% DAV)
(% 50 day avg vol) |
52 Wk Hi
% From Hi |
Featured
Date |
Price
Featured |
Pivot Featured |
|
Max Buy |
 SPSC
-
NASDAQ
SPSC
-
NASDAQ
S P S Commerce Inc
COMPUTER SOFTWARE and SERVICES - Application Software
|
$101.64
|
+1.99
2.00% |
$101.73
|
160,099
103.29% of 50 DAV
50 DAV is 155,000
|
$115.00
-11.62%
|
6/7/2019
|
$107.72
|
PP = $115.10
|
|
MB = $120.86
|
Most Recent Note - 6/24/2019 5:34:41 PM
G - Color code is changed to green after it slumped below its 50 DMA line ($104.44) with today's big loss on light volume. A rebound and subsequent volume-driven gains above the pivot point are needed to trigger a new (or add-on) technical buy signal. Faces some resistance due to overhead supply up to the $115 level. Recent lows in the $98-99 area define important near-term support to watch. Fundamentals remain strong.
>>> FEATURED STOCK ARTICLE : Base Building Now Above 50-Day Moving Average Line - 6/7/2019 |
View all notes |
Set NEW NOTE alert |
Company Profile |
SEC
News |
Chart |
Request a new note
C
A
S
I |
EPAM
-
NYSE
Epam Systems Inc
COMPUTER SOFTWARE and SERVICES - Information Technology Service
|
$172.93
|
+1.94
1.13% |
$173.06
|
300,039
61.99% of 50 DAV
50 DAV is 484,000
|
$180.55
-4.22%
|
5/9/2019
|
$169.25
|
PP = $180.55
|
|
MB = $189.58
|
Most Recent Note - 6/26/2019 5:45:49 PM
Y - Volume has been cooling while still perched within close striking distance of its 52-week high. Consolidating quietly near its 50 DMA line ($172). Subsequent gains above the pivot point backed by at least +40% above average volume may trigger a new (or add-on) technical buy signal.
>>> FEATURED STOCK ARTICLE : Perched Near Pivot Point After a New Flat Base - 6/13/2019 |
View all notes |
Set NEW NOTE alert |
Company Profile |
SEC
News |
Chart |
Request a new note
C
A
S
I |
ENV
-
NYSE
Envestnet Inc
FINANCIAL SERVICES - Diversified Investments
|
$67.70
|
+1.12
1.68% |
$67.80
|
267,448
92.22% of 50 DAV
50 DAV is 290,000
|
$72.67
-6.84%
|
3/15/2019
|
$66.05
|
PP = $64.90
|
|
MB = $68.15
|
Most Recent Note - 6/25/2019 1:54:33 PM
G - Sputtering below its 50 DMA line ($69.10). Prior lows in the $65-66 area define the next important near-term support to watch. Recently reported earnings +5% on +1% sales revenues for the Mar '19 quarter, below the +25% minimum earnings guideline (C criteria).
>>> FEATURED STOCK ARTICLE : Rebound Above 50-Day Moving Average Improved Technical Stance - 6/4/2019 |
View all notes |
Set NEW NOTE alert |
Company Profile |
SEC
News |
Chart |
Request a new note
C
A
S
I |
LHCG
-
NASDAQ
L H C Group Inc
HEALTH SERVICES - Home Health Care
|
$117.87
|
+1.45
1.25% |
$118.38
|
180,377
73.62% of 50 DAV
50 DAV is 245,000
|
$122.20
-3.54%
|
4/29/2019
|
$110.94
|
PP = $115.64
|
|
MB = $121.42
|
Most Recent Note - 6/24/2019 2:55:28 PM
Y - Sputtering near its pivot point, meanwhile its 50 DMA line ($113) defines near-term support above recent lows. Fundamentals remain strong.
>>> FEATURED STOCK ARTICLE : Prior Gains Lacked Volume; 50-Day Moving Average Defines Support - 6/17/2019 |
View all notes |
Set NEW NOTE alert |
Company Profile |
SEC
News |
Chart |
Request a new note
C
A
S
I |
ENSG
-
NASDAQ
Ensign Group Inc
HEALTH SERVICES - Long-Term Care Facilities
|
$56.28
|
+1.05
1.90% |
$56.30
|
222,021
73.76% of 50 DAV
50 DAV is 301,000
|
$58.35
-3.55%
|
4/30/2019
|
$51.46
|
PP = $53.30
|
|
MB = $55.97
|
Most Recent Note - 6/25/2019 1:52:42 PM
G - Color code is changed to green while hovering near its all-time high, extended from the previously noted "double bottom" base. Its 50 DMA line ($53.65) and recent low ($52.34 on 5/31/19) define near-term support to watch. Recently reported earnings +22% on +12% sales revenues for the Mar '19 quarter, below the +25% minimum earnings guideline (C criteria), raising fundamental concerns.
>>> FEATURED STOCK ARTICLE : Resilient After Latest Quarterly Report Missed Minimum Guideline - 6/3/2019 |
View all notes |
Set NEW NOTE alert |
Company Profile |
SEC
News |
Chart |
Request a new note
C
A
S
I |
Symbol/Exchange
Company Name
Industry Group |
PRICE |
CHANGE
(%Change) |
Day High |
Volume
(% DAV)
(% 50 day avg vol) |
52 Wk Hi
% From Hi |
Featured
Date |
Price
Featured |
Pivot Featured |
|
Max Buy |
CHDN
-
NASDAQ
Churchill Downs Inc
LEISURE - Gaming Activities
|
$113.46
|
+2.44
2.20% |
$113.60
|
249,841
74.14% of 50 DAV
50 DAV is 337,000
|
$117.14
-3.14%
|
6/5/2019
|
$108.87
|
PP = $104.96
|
|
MB = $110.21
|
Most Recent Note - 6/24/2019 2:49:59 PM
G - Retreating from its all-time high with today's 3rd consecutive loss. Prior highs in the $104 area define initial support to watch above its 50 DMA line ($101). Share price was impacted by a 3:1 split when noted on 1/28/19.
>>> FEATURED STOCK ARTICLE : Consolidating Near 50-Day Moving Average - 6/29/2018 |
View all notes |
Set NEW NOTE alert |
Company Profile |
SEC
News |
Chart |
Request a new note
C
A
S
I |
WWD
-
NASDAQ
Woodward Inc
MANUFACTURING - Diversified Machinery
|
$113.08
|
+1.44
1.29% |
$113.21
|
551,016
124.38% of 50 DAV
50 DAV is 443,000
|
$116.46
-2.90%
|
6/18/2019
|
$112.34
|
PP = $114.65
|
|
MB = $120.38
|
Most Recent Note - 6/25/2019 2:02:46 PM
Y - Still perched near its all-time high, however, recent gains lacked great volume conviction and it has encountered distributional pressure. Subsequent gains above the pivot point backed by at least +40% above average volume may clinch a convincing technical buy signal. Fundamentals remain strong.
>>> FEATURED STOCK ARTICLE : High Ranked Industrial Firm Perched Near All-Time High - 6/18/2019 |
View all notes |
Set NEW NOTE alert |
Company Profile |
SEC
News |
Chart |
Request a new note
C
A
S
I |
LULU
-
NASDAQ
Lululemon Athletica
MANUFACTURING - Textile Manufacturing
|
$180.11
|
+2.80
1.58% |
$180.69
|
1,410,372
65.63% of 50 DAV
50 DAV is 2,149,000
|
$190.52
-5.46%
|
6/13/2019
|
$174.48
|
PP = $179.60
|
|
MB = $188.58
|
Most Recent Note - 6/24/2019 5:32:46 PM
Y - Consolidating above the prior high ($179.50 on 4/24/19) which defines initial support to watch. The 50 DMA line ($174) and prior low ($160.88 on 5/29/19) define the next important support. Reported Apr '19 quarterly earnings +35% on +20% sales revenues versus the ear ago period.
>>> FEATURED STOCK ARTICLE : Perched Near High Following Another Strong Earnings Report - 6/14/2019 |
View all notes |
Set NEW NOTE alert |
Company Profile |
SEC
News |
Chart |
Request a new note
C
A
S
I |
ULTA
-
NASDAQ
Ulta Beauty Inc
SPECIALTY RETAIL - Specialty Retail, Other
|
$344.22
|
-0.60
-0.17% |
$347.43
|
619,539
81.84% of 50 DAV
50 DAV is 757,000
|
$365.54
-5.83%
|
3/15/2019
|
$341.27
|
PP = $322.59
|
|
MB = $338.72
|
Most Recent Note - 6/24/2019
G - Testing its 50 DMA line ($344) while today's big loss on higher volume is indicative of distributional pressure after wedging higher with gains backed by lackluster volume as it challenged it all-time high. Reported earnings +17% on +13% sales revenues for the Apr '19 quarter, below the +25% minimum earnings guideline (C criteria), raising fundamental concerns.
>>> FEATURED STOCK ARTICLE : Sputtering Below 50-Day Moving Average Following Sub Par Earnings - 6/6/2019 |
View all notes |
Set NEW NOTE alert |
Company Profile |
SEC
News |
Chart |
Request a new note
C
A
S
I |
ESNT
-
NYSE
Essent Group Ltd
Finance-MrtgandRel Svc
|
$46.68
|
+0.53
1.15% |
$46.73
|
348,568
54.72% of 50 DAV
50 DAV is 637,000
|
$50.51
-7.58%
|
3/18/2019
|
$45.84
|
PP = $45.06
|
|
MB = $47.31
|
Most Recent Note - 6/25/2019 12:27:08 PM
G - Raised concerns as it violated its 50 DMA line ($47.46) during a streak of 4 consecutive losses. Recently reported earnings +15% on +20% sales revenues for the Mar '19 quarter, below the +25% minimum earnings guideline (C criteria), raising fundamental concerns.
>>> FEATURED STOCK ARTICLE : Still Hovering Not Far From 52-Week High - 6/5/2019 |
View all notes |
Set NEW NOTE alert |
Company Profile |
SEC
News |
Chart |
Request a new note
C
A
S
I |
Symbol/Exchange
Company Name
Industry Group |
PRICE |
CHANGE
(%Change) |
Day High |
Volume
(% DAV)
(% 50 day avg vol) |
52 Wk Hi
% From Hi |
Featured
Date |
Price
Featured |
Pivot Featured |
|
Max Buy |
NOW
-
NYSE
Servicenow Inc
Computer Sftwr-Enterprse
|
$278.51
|
+3.17
1.15% |
$280.83
|
1,143,981
64.93% of 50 DAV
50 DAV is 1,762,000
|
$292.98
-4.94%
|
4/22/2019
|
$242.64
|
PP = $251.75
|
|
MB = $264.34
|
Most Recent Note - 6/26/2019 5:34:34 PM
G - Pulled back from its all-time high with 4 consecutive losses. Its 50 DMA line ($266) defines near-term support to watch. Recently reported earnings +20% on +34% sales revenues for the Mar '19 quarter, below the +25% minimum earnings guideline (C criteria), raising fundamental concerns. See the latest FSU analysis for more details and a new annotated graph.
>>> FEATURED STOCK ARTICLE : Pulling Back After Wedging to New Highs - 6/26/2019 |
View all notes |
Set NEW NOTE alert |
Company Profile |
SEC
News |
Chart |
Request a new note
C
A
S
I |
VEEV
-
NYSE
Veeva Systems Inc Cl A
Computer Sftwr-Medical
|
$160.51
|
+4.99
3.21% |
$160.99
|
2,487,509
168.42% of 50 DAV
50 DAV is 1,477,000
|
$173.65
-7.57%
|
5/30/2019
|
$154.32
|
PP = $145.80
|
|
MB = $153.09
|
 Most Recent Note - 6/27/2019 7:44:11 PM
G -Halted its slide with a solid gain today after 4 consecutive volume-driven losses. It remains very extended from any sound base. Its 50 DMA line ($148.75) defines near-term support. Reported earnings +52% on +25% sales revenues for the Apr '19 quarter, marking its 5th strong quarter with earnings above the +25% minimum guideline (C criteria). See the latest FSU analysis for more details and a new annotated graph.
>>> FEATURED STOCK ARTICLE : Halted Slide After 4 Volume-Driven Losses From High - 6/27/2019 |
View all notes |
Set NEW NOTE alert |
Company Profile |
SEC
News |
Chart |
Request a new note
C
A
S
I |
PAYC
-
NYSE
Paycom Software Inc
COMPUTER SOFTWARE and SERVICES - Application Software
|
$224.56
|
+7.74
3.57% |
$224.73
|
476,040
60.18% of 50 DAV
50 DAV is 791,000
|
$233.43
-3.80%
|
2/6/2019
|
$171.66
|
PP = $164.18
|
|
MB = $172.39
|
Most Recent Note - 6/27/2019 7:47:10 PM
G - Extended from any sound base, and it encountered distributional pressure after quietly hitting a new all-time high. Its 50 DMA line ($209) defines near-term support to watch above the recent low ($194.84 on 6/03/19). Reported earnings +25% on +30% sales revenues for the Mar '19 quarter.
>>> FEATURED STOCK ARTICLE : Posted Volume-Driven Gain While Hovering Near All-Time High - 5/31/2019 |
View all notes |
Set NEW NOTE alert |
Company Profile |
SEC
News |
Chart |
Request a new note
C
A
S
I |
PYPL
-
NASDAQ
Paypal Holdings Inc
Finance-CrdtCard/PmtPr
|
$113.67
|
-0.48
-0.42% |
$114.87
|
5,138,967
87.89% of 50 DAV
50 DAV is 5,847,000
|
$119.95
-5.24%
|
1/24/2019
|
$92.56
|
PP = $93.80
|
|
MB = $98.49
|
Most Recent Note - 6/26/2019 5:48:28 PM
G - Gapped down on 6/21/19 for a volume-driven loss retreating from its all-time high after quiet gains. Did not form a sound base, yet promptly rebounded after violating its 50 DMA line and prior low ($106.52) on 6/03/19. Recently reported earnings +37% on +12% sales revenues for the Mar '19 quarter, continuing its strong earnings track record.
>>> FEATURED STOCK ARTICLE : Popular Payments Firm Extended From Any Sound Base - 6/19/2019 |
View all notes |
Set NEW NOTE alert |
Company Profile |
SEC
News |
Chart |
Request a new note
C
A
S
I |
PLNT
-
NYSE
Planet Fitness Inc Cl A
Leisure-Services
|
$73.13
|
+1.48
2.07% |
$73.97
|
1,773,294
119.49% of 50 DAV
50 DAV is 1,484,000
|
$81.90
-10.71%
|
11/7/2018
|
$57.10
|
PP = $55.45
|
|
MB = $58.22
|
Most Recent Note - 6/25/2019 1:08:07 PM
G - Today's 4th consecutive volume-driven loss is adding to a streak of damaging losses that violated its 50 DMA line ($76.43) triggering a technical sell signal. Fundamentals remain strong. A rebound above the 50 DMA line is needed for its outlook to improve.
>>> FEATURED STOCK ARTICLE : Undercut 50-Day Moving Average With Volume Behind Losses - 6/21/2019 |
View all notes |
Set NEW NOTE alert |
Company Profile |
SEC
News |
Chart |
Request a new note
C
A
S
I |
Symbol/Exchange
Company Name
Industry Group |
PRICE |
CHANGE
(%Change) |
Day High |
Volume
(% DAV)
(% 50 day avg vol) |
52 Wk Hi
% From Hi |
Featured
Date |
Price
Featured |
Pivot Featured |
|
Max Buy |
BLD
-
NYSE
Topbuild Corp
Bldg-Constr Prds/Misc
|
$80.55
|
+2.89
3.72% |
$80.56
|
183,598
53.22% of 50 DAV
50 DAV is 345,000
|
$86.96
-7.37%
|
5/17/2019
|
$82.19
|
PP = $87.31
|
|
MB = $91.68
|
Most Recent Note - 6/27/2019 7:45:37 PM
Y - Found support at its 50 DMA line ($78.27) with a quiet gain today. Remains within striking distance of its 52-week high. Subsequent gains above the pivot point backed by at least +40% above average volume may trigger a technical buy signal. Fundamentals remain strong.
>>> FEATURED STOCK ARTICLE : Found Support at 50-Day Moving Averge Line - 6/20/2019 |
View all notes |
Set NEW NOTE alert |
Company Profile |
SEC
News |
Chart |
Request a new note
C
A
S
I |
TEAM
-
NASDAQ
Atlassian Corp Plc Cl A
Comp Sftwr-Spec Enterprs
|
$131.04
|
+2.69
2.10% |
$131.24
|
1,368,365
77.35% of 50 DAV
50 DAV is 1,769,000
|
$137.78
-4.89%
|
5/24/2019
|
$129.52
|
PP = $132.09
|
|
MB = $138.69
|
Most Recent Note - 6/24/2019 5:31:03 PM
Y - Pulled back for a second session with below average volume. The 50 DMA line ($121) and prior low ($115.87 on 6/03/19) define important near-term support to watch. Reported earnings +133% on +38% sales revenues for the Mar '19 quarter, continuing its strong earnings track record. See the latest FSU analysis for more details and a new annotated graph.
>>> FEATURED STOCK ARTICLE : Perched at High After Wedging into New High Territory - 6/24/2019 |
View all notes |
Set NEW NOTE alert |
Company Profile |
SEC
News |
Chart |
Request a new note
C
A
S
I |
UPLD
-
NASDAQ
Upland Software Inc
Computer Sftwr-Enterprse
|
$43.85
|
-0.52
-1.17% |
$44.86
|
362,321
63.68% of 50 DAV
50 DAV is 569,000
|
$54.87
-20.08%
|
6/10/2019
|
$53.30
|
PP = $50.74
|
|
MB = $53.28
|
Most Recent Note - 6/25/2019 2:16:07 PM
G - Color code is changed to green after violating its 50 DMA line ($46.72) with today's 4th consecutive loss raising concerns and triggering a technical sell signal. Recent losses completely negated the prior breakout from an advanced ascending base. Completed a new Public Offering on 5/08/19. Quarterly comparisons through Mar '19 have shown impressive sales revenues growth and greatly improved earnings increases above the +25% minimum guideline (C criteria).
>>> FEATURED STOCK ARTICLE : Rose From an Advanced Ascending Base - 6/10/2019 |
View all notes |
Set NEW NOTE alert |
Company Profile |
SEC
News |
Chart |
Request a new note
C
A
S
I |
GLOB
-
NYSE
Globant SA
Computer-Tech Services
|
$99.31
|
+1.02
1.04% |
$100.55
|
377,954
91.07% of 50 DAV
50 DAV is 415,000
|
$105.33
-5.72%
|
2/15/2019
|
$69.35
|
PP = $70.00
|
|
MB = $73.50
|
Most Recent Note - 6/24/2019 2:53:36 PM
G - Pulling back today following 5 consecutive gains into new high territory. Very extended from any sound base. Its 50 DMA line ($88.38) defines important support where a violation would raise concerns and trigger a technical sell signal. Fundamentals remain strong.
>>> FEATURED STOCK ARTICLE : Posted Big Gain for Another New High Close - 6/12/2019 |
View all notes |
Set NEW NOTE alert |
Company Profile |
SEC
News |
Chart |
Request a new note
C
A
S
I |
PAGS
-
NYSE
Pagseguro Digital Cl A
Finance-CrdtCard/PmtPr
|
$37.64
|
-0.19
-0.50% |
$38.05
|
891,445
37.92% of 50 DAV
50 DAV is 2,351,000
|
$38.25
-1.59%
|
6/25/2019
|
$37.69
|
PP = $40.07
|
|
MB = $42.07
|
Most Recent Note - 6/25/2019 5:39:44 PM
Y - Ended the session lower with higher volume after highlighted in yellow with pivot point cited based on its 3/29/18 high plus 10 cents. Faces very little resistance due to overhead supply up to the $39 level. Subsequent volume-driven gains for new highs may trigger a technical buy signal. Quarterly comparisons through Mar '19 showed earnings increases above the +25% minimum guideline (C criteria), however, sequential comparisons have shown deceleration in its sales revenues and earnings growth rate. Limited history for this Brazil-based firm is also a concern. Completed its $21.50 IPO on 1/24/18. See the latest FSU analysis for more details and a new annotated graph.
>>> FEATURED STOCK ARTICLE : Brazilian Payment Tech Firm Perched Near High - 6/25/2019 |
View all notes |
Set NEW NOTE alert |
Company Profile |
SEC
News |
Chart |
Request a new note
C
A
S
I |
Symbol/Exchange
Company Name
Industry Group |
PRICE |
CHANGE
(%Change) |
Day High |
Volume
(% DAV)
(% 50 day avg vol) |
52 Wk Hi
% From Hi |
Featured
Date |
Price
Featured |
Pivot Featured |
|
Max Buy |
|
|
|
THESE ARE NOT BUY RECOMMENDATIONS!
Comments contained in the body of this report are technical
opinions only. The material herein has been obtained
from sources believed to be reliable and accurate, however,
its accuracy and completeness cannot be guaranteed.
This site is not an investment advisor, hence it does
not endorse or recommend any securities or other investments.
Any recommendation contained in this report may not
be suitable for all investors and it is not to be deemed
an offer or solicitation on our part with respect to
the purchase or sale of any securities. All trademarks,
service marks and trade names appearing in this report
are the property of their respective owners, and are
likewise used for identification purposes only.
This report is a service available
only to active Paid Premium Members.
You may opt-out of receiving report notifications
at any time. Questions or comments may be submitted
by writing to Premium Membership Services 665 S.E. 10 Street, Suite 201 Deerfield Beach, FL 33441-5634 or by calling 1-800-965-8307
or 954-785-1121.
|
|
|