You are not logged in.
This means you
CAN ONLY VIEW reports that were published prior to Sunday, February 25, 2024.
You
MUST UPGRADE YOUR MEMBERSHIP if you want to see any current reports.
AFTER MARKET UPDATE - FRIDAY, JUNE 26TH, 2020
Previous After Market Report Next After Market Report >>>
|
|
|
|
DOW |
-730.05 |
25,015.55 |
-2.84% |
|
Volume |
3,161,317,800 |
+227% |
|
Volume |
7,166,623,700 |
+54% |
|
NASDAQ |
-261.45 |
9,755.55 |
-2.61% |
|
Advancers |
565 |
19% |
|
Advancers |
730 |
22% |
|
S&P 500 |
-74.71 |
3,009.05 |
-2.42% |
|
Decliners |
2,366 |
81% |
|
Decliners |
2,588 |
78% |
|
Russell 2000 |
-34.53 |
1,378.78 |
-2.44% |
|
52 Wk Highs |
35 |
|
|
52 Wk Highs |
69 |
|
|
S&P 600 |
-23.31 |
788.69 |
-2.87% |
|
52 Wk Lows |
13 |
|
|
52 Wk Lows |
30 |
|
|
 |
Major Indices' Loss on Higher Volume Indicates Distributional Pressure
Kenneth J. Gruneisen - Passed the CAN SLIM® Master's Exam
The Dow slumped 729 points while the S&P 500 slipped 2.4%. The Nasdaq Composite declined 2.6%. Breadth was negative as decliners led advancers by a 4-1 margin on the NYSE and by more than 3-1 on the Nasdaq exchange. The reported volume totals were higher than the prior session on the NYSE and on the Nasdaq exchange, indicative of institutional selling pressure termed "distribution". There were 32 high-ranked companies from the Leaders List that hit new 52-week highs and were listed on the BreakOuts Page, versus the total of 20 on the prior session. New 52-week highs totals outnumbered new 52-week lows totals on both exchanges. The major indices have seen their uptrend come under recent pressure (M criteria). Any sustainable rally requires a healthy crop of new leaders, so it will be important to see the new highs totals stabilize and improve.Charts used courtesy of www.stockcharts.com
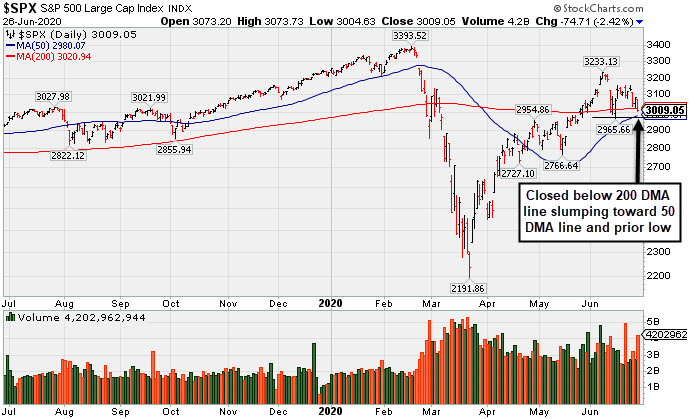
PICTURED: The S&P 500 Index has seen recent losses come with higher volume totals, a worrisome sign. The benchmark index ended -11.3% off its record high. It slumped below its 200-day moving average (DMA) line toward its 50 DMA line and prior lows which define important near-term support to watch. More damaging losses would raise greater concerns and could prompt investors to reduce market exposure and raise cash.
Stocks finished lower Friday amid renewed concerns that the sudden spike in COVID-19 cases could prolong the economic recovery time. The losses accelerated in afternoon trading after leaders from both Texas and Florida announced they were rolling back some of their re-opening measures.
The notorious "FAANG" group of tech leaders came under pressure as Facebook (FB -8.32%), Alphabet (GOOGL -5.45%), Apple (AAPL -3.07%), and Netflix (NFLX -4.83%) ended unanimously lower. Financial stocks paced the decline today, falling roughly 4.3% after the Federal Reserve informed the largest U.S. lenders that they will not be able increase dividends or repurchase shares through at least September. Notable decliners included Goldman Sachs (GS -8.65%) and JP Morgan (JPM -5.48%). Airlines and cruise liners also suffered sharp losses as both groups stand to be negatively impacted by any type of economic closure. The Energy slumped 3.5% as WTI crude slumped 1.4% to $38.17/barrel.
On the economic front, personal spending rebounded 8.2% in May, the largest gain on record and a stark contrast to last month’s reading which marked the biggest decline in history. Meanwhile, personal income dipped less than anticipated in May after a 10.8% uptick in the prior month. Elsewhere, the Core PCE Deflator, which is the Fed’s preferred gauge of inflation, ticked up 0.1% in May, and grew at an annualized rate of 1.0%, which is well below the central bank’s 2.0% target range. Treasuries advanced, with the yield on the 10-year note slipping four basis points to 0.64%.
|
 Kenneth J. Gruneisen started out as a licensed stockbroker in August 1987, a couple of months prior to the historic stock market crash that took the Dow Jones Industrial Average down -22.6% in a single day. He has published daily fact-based fundamental and technical analysis on high-ranked stocks online for two decades. Through FACTBASEDINVESTING.COM, Kenneth provides educational articles, news, market commentary, and other information regarding proven investment systems that work in good times and bad.
Comments contained in the body of this report are technical opinions only and are not necessarily those of Gruneisen Growth Corp. The material herein has been obtained from sources believed to be reliable and accurate, however, its accuracy and completeness cannot be guaranteed. Our firm, employees, and customers may effect transactions, including transactions contrary to any recommendation herein, or have positions in the securities mentioned herein or options with respect thereto. Any recommendation contained in this report may not be suitable for all investors and it is not to be deemed an offer or solicitation on our part with respect to the purchase or sale of any securities. |
|
 |
Energy, Financial and Tech Groups Fell
Kenneth J. Gruneisen - Passed the CAN SLIM® Master's Exam
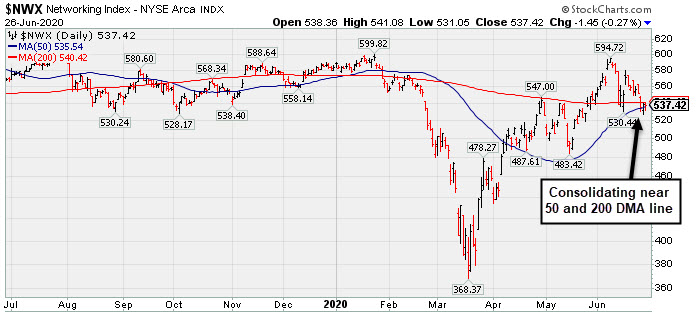
Energy-linked groups fell as the Integrated Oil Index ($XOI -3.28%) and the Oil Services Index ($OSX -3.51%) each suffered big big losses. The Gold & Silver Index ($XAU +0.52%) posted a gain which made it a standout. Financials weighed on the major indices as the Broker/Dealer Index ($XBD -4.51%) and the Bank Index ($BKX -6.44%) both posted big losses. The Retail Index ($RLX -1.99%) also slumped. The tech sector was led lower by the Semiconductor Index ($SOX -2.00%) and the Biotech Index ($BTK -1.98%) while the Networking Index ($NWX -0.27%) ended slightly in the red.
PICTURED: The Networking Index ($NWX -0.27%) is consolidating near its 50-day and 200-day moving average (DMA) lines.
| Oil Services |
$OSX |
31.95 |
-1.20 |
-3.62% |
-59.19% |
| Integrated Oil |
$XOI |
760.19 |
-25.78 |
-3.28% |
-40.17% |
| Semiconductor |
$SOX |
1,921.69 |
-39.36 |
-2.01% |
+3.90% |
| Networking |
$NWX |
537.42 |
-1.45 |
-0.27% |
-7.88% |
| Broker/Dealer |
$XBD |
260.78 |
-12.31 |
-4.51% |
-10.19% |
| Retail |
$RLX |
2,918.42 |
-59.17 |
-1.99% |
+19.15% |
| Gold & Silver |
$XAU |
122.94 |
+0.67 |
+0.55% |
+14.98% |
| Bank |
$BKX |
71.97 |
-4.95 |
-6.44% |
-36.51% |
| Biotech |
$BTK |
5,711.22 |
-115.27 |
-1.98% |
+12.70% |
|
|
|
 |
Slump Below 50-Day Average Toward Prior Low Raises Concerns
Kenneth J. Gruneisen - Passed the CAN SLIM® Master's Exam
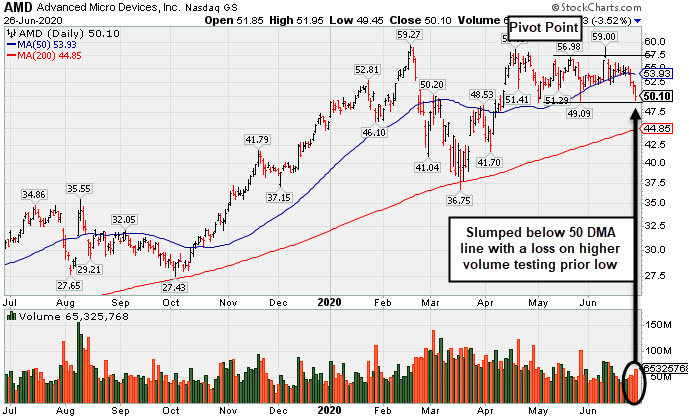
Advanced Micro Devices (AMD -$1.83 or -3.52% to $50.10) slumped even further below its 50-day moving average (DMA) line ($53.93) with higher (near average) volume behind today's 4th consecutive loss. A prompt rebound above the 50 DMA line is needed for its outlook to improve. The prior low ($49.09 on 5/27/20) defines the next important support to watch. AMD met stubborn resistance in the $57-59 area. A rebound and subsequent gains into new high territory are needed to trigger a technical buy signal which may mark the beginning of a substantial leg higher.
AMD was highlighted in yellow in the 6/09/20 mid-day report (read here) with pivot point cited based on its 5/20/20 high while building on an orderly double-bottom base. It was shown in this FSU section on 6/09/20 with an annotated graph under the headline, "Big Chip Firm Showing Strong Sales Revenues and Earnings Increases". Fundamentals remain strong. The 3 latest quarterly comparisons through Mar '20 showed very strong earnings increases well above the +25% minimum guideline (C criteria) with greatly improved sales revenues growth +50% and +40% in the Dec '19 and Mar '20 comparisons, respectively, versus the year ago periods. Annual earnings growth (A criteria) has been very strong after losses in FY '15 and '16. it has a highest possible 99 Earnings Per Share Rating.
AMD hails from the Electronics - Semiconductor Fabless industry which has a Group Relative Strength Rating of 89 (L criteria). It has a large supply of 1.17 billion shares outstanding (S criteria), which makes it less likely to be a quick sprinter. However, the number of top-rated funds owning its shares rose from 1,669 in Jun '19 to 2,003 in Mar '20, a reassuring sign concerning the I criteria. It has a Timeliness Rating of A and Sponsorship Rating of B. Its Accumulation/Distribution rating is B-.
|
|
|
Color Codes Explained :
Y - Better candidates highlighted by our
staff of experts.
G - Previously featured
in past reports as yellow but may no longer be buyable under the
guidelines.
***Last / Change / Volume data in this table is the closing quote data***
Symbol/Exchange
Company Name
Industry Group |
PRICE |
CHANGE
(%Change) |
Day High |
Volume
(% DAV)
(% 50 day avg vol) |
52 Wk Hi
% From Hi |
Featured
Date |
Price
Featured |
Pivot Featured |
|
Max Buy |
 FTNT
-
NASDAQ
FTNT
-
NASDAQ
Fortinet Inc
Computer Sftwr-Security
|
$134.55
|
-1.28
-0.94% |
$136.49
|
1,341,705
76.36% of 50 DAV
50 DAV is 1,757,000
|
$149.69
-10.11%
|
6/22/2020
|
$142.68
|
PP = $149.79
|
|
MB = $157.28
|
Most Recent Note - 6/25/2020 6:30:13 PM
Y - Consolidating above its 50 DMA line ($129) and above the prior low ($126.88 on 6/15/20) which define important near-term support to watch on pullbacks. Subsequent gains above the pivot point backed by at least +40% above average volume are needed to trigger a new (or add-on) technical buy signal.
>>> FEATURED STOCK ARTICLE : Managed a "Positive Reversal" After Brief Dip Below "Max Buy" Level - 6/15/2020 |
View all notes |
Set NEW NOTE alert |
Company Profile |
SEC
News |
Chart |
Request a new note
C
A
S
I |
EBS
-
NYSE
Emergent Biosolutions
DRUGS - Biotechnology
|
$75.28
|
-0.82
-1.08% |
$76.55
|
816,066
125.74% of 50 DAV
50 DAV is 649,000
|
$93.58
-19.56%
|
6/1/2020
|
$72.10
|
PP = $90.10
|
|
MB = $94.61
|
Most Recent Note - 6/25/2020 6:20:24 PM
G - Held its ground stubbornly in recent weeks and today's volume-driven gain helped it rebound neat its 50 DMA line. Subsequent gains above the 50 DMA line ($77.25) are still needed to help its outlook improve. Any damaging losses below the recent low ($66.69) may trigger a more worrisome technical sell signal. Fundamentals remain strong.
>>> FEATURED STOCK ARTICLE : Still Below 50-Day Moving Average Following Damaging Gap Down - 6/16/2020 |
View all notes |
Set NEW NOTE alert |
Company Profile |
SEC
News |
Chart |
Request a new note
C
A
S
I |
NBIX
-
NASDAQ
Neurocrine Biosciences
DRUGS - Biotechnology
|
$130.36
|
+1.89
1.47% |
$130.99
|
2,612,649
303.09% of 50 DAV
50 DAV is 862,000
|
$131.00
-0.49%
|
5/19/2020
|
$123.71
|
PP = $119.75
|
|
MB = $125.74
|
 Most Recent Note - 6/26/2020 6:30:04 PM
G - Posted a gain today with +204% above average volume and hit a new all-time high. Prior highs in the $119 area define important near-term support to watch above its 50 DMA line ($113.93). Fundamentals remain strong.
>>> FEATURED STOCK ARTICLE : Pullback Into Prior Base Negated Recent Breakout - 6/8/2020 |
View all notes |
Set NEW NOTE alert |
Company Profile |
SEC
News |
Chart |
Request a new note
C
A
S
I |
BMRN
-
NASDAQ
Biomarin Pharmaceutical
DRUGS - Drug Manufacturers - Other
|
$124.02
|
-0.20
-0.16% |
$124.95
|
2,827,191
168.59% of 50 DAV
50 DAV is 1,677,000
|
$124.95
-0.74%
|
6/17/2020
|
$110.95
|
PP = $112.67
|
|
MB = $118.30
|
Most Recent Note - 6/25/2020 6:26:08 PM
G - Posted a volume-driven gain today for a best ever close. Stubbornly held its ground after a streak of gains for new highs marked by heavy volume. Reported strong results for the Mar '20 quarter and recent comparisons showed improved earnings increases. Annual earnings (A criteria) history has been strong. Prior high ($112.57) defines initial support to watch on pullbacks.
>>> FEATURED STOCK ARTICLE : Hit New 52-Week High But Closed Below Pivot After 3-Weeks Tight - 6/17/2020 |
View all notes |
Set NEW NOTE alert |
Company Profile |
SEC
News |
Chart |
Request a new note
C
A
S
I |
AMD
-
NASDAQ
Advanced Micro Devices
ELECTRONICS - Semiconductor - Broad Line
|
$50.10
|
-1.83
-3.52% |
$51.95
|
64,511,720
103.66% of 50 DAV
50 DAV is 62,233,000
|
$59.27
-15.47%
|
6/9/2020
|
$55.41
|
PP = $56.98
|
|
MB = $59.83
|
Most Recent Note - 6/26/2020 6:08:10 PM
G - Slumped further below its 50 DMA line ($53.93) with higher (near average) volume behind today's 4th consecutive loss. A prompt rebound above the 50 DMA line is needed for its outlook to improve. The prior low ($49.09 on 5/27/20) defines the next important support to watch. Met stubborn resistance in the $57-59 area. See the latest FSU analysis for more details and a new annotated graph.
>>> FEATURED STOCK ARTICLE : Slump Below 50-Day Average Toward Prior Low Raises Concerns - 6/26/2020 |
View all notes |
Set NEW NOTE alert |
Company Profile |
SEC
News |
Chart |
Request a new note
C
A
S
I |
Symbol/Exchange
Company Name
Industry Group |
PRICE |
CHANGE
(%Change) |
Day High |
Volume
(% DAV)
(% 50 day avg vol) |
52 Wk Hi
% From Hi |
Featured
Date |
Price
Featured |
Pivot Featured |
|
Max Buy |
TREX
-
NYSE
Trex Company Inc
MATERIALS and CONSTRUCTION - General Building Materials
|
$127.05
|
+4.10
3.33% |
$128.82
|
6,762,335
714.08% of 50 DAV
50 DAV is 947,000
|
$132.84
-4.36%
|
6/26/2020
|
$109.05
|
PP = $132.94
|
|
MB = $139.59
|
Most Recent Note - 6/26/2020 6:24:14 PM
Y - Color code is changed to yellow after forming a short flat base with new pivot point cited based on its 5/26/20 high plus 10 cents. Challenged its all-time high with a big gain today backed by +627% above average volume. Subsequent volume-driven gains for new highs may trigger a new (or add-on) technical buy signal. Prior highs in the $111 area define important support nearly coinciding with its 50 DMA line ($112.24). Fundamentals remain strong.
>>> FEATURED STOCK ARTICLE : Pullback Toward Prior Highs Which Define Near-Term Support - 6/11/2020 |
View all notes |
Set NEW NOTE alert |
Company Profile |
SEC
News |
Chart |
Request a new note
C
A
S
I |
NFLX
-
NASDAQ
Netflix Inc
SPECIALTY RETAIL - Music and Video Stores
|
$443.40
|
-22.51
-4.83% |
$468.03
|
6,743,380
89.00% of 50 DAV
50 DAV is 7,577,000
|
$474.01
-6.46%
|
5/14/2020
|
$441.95
|
PP = $449.62
|
|
MB = $472.10
|
Most Recent Note - 6/26/2020 6:14:15 PM
Y - Abruptly retreated from its all-time high with today's big loss backed by higher (near average) volume. Found support near its 50 DMA line ($432.91) during the prior consolidation. Recent gains above a stock's pivot point did not have the minimum +40% above average volume needed to trigger a proper new (or add-on) technical buy signal. Any damaging losses below the 50 DMA line and prior lows would trigger a more worrisome technical sell signal.
>>> FEATURED STOCK ARTICLE : Weak Action Led to 50-Day Moving Average Violation - 6/12/2020 |
View all notes |
Set NEW NOTE alert |
Company Profile |
SEC
News |
Chart |
Request a new note
C
A
S
I |
CHGG
-
NYSE
Chegg Inc
Consumer Svcs-Education
|
$65.42
|
+0.47
0.72% |
$66.21
|
14,883,163
356.48% of 50 DAV
50 DAV is 4,175,000
|
$70.57
-7.30%
|
6/17/2020
|
$63.71
|
PP = $68.08
|
|
MB = $71.48
|
Most Recent Note - 6/26/2020 6:28:36 PM
Y - Posted a small gain today with +263% above average volume but it remains below its pivot point. Disciplined investors may note that the recent gain above the pivot point was not backed by the at least +40% above average volume necessary to trigger a convincing technical buy signal. Confirming gains above the pivot point backed by volume would be a reassuring sign of fresh institutonal buying demand.
>>> FEATURED STOCK ARTICLE : Formed a Flat Base Perched Within Striking Distance of 52-Week High - 6/18/2020 |
View all notes |
Set NEW NOTE alert |
Company Profile |
SEC
News |
Chart |
Request a new note
C
A
S
I |
NOW
-
NYSE
Servicenow Inc
Computer Sftwr-Enterprse
|
$399.97
|
-1.67
-0.42% |
$402.84
|
1,986,476
96.67% of 50 DAV
50 DAV is 2,055,000
|
$409.80
-2.40%
|
4/30/2020
|
$343.05
|
PP = $363.05
|
|
MB = $381.20
|
Most Recent Note - 6/25/2020 6:18:51 PM
G - Posted a gain today with light volume. Volume totals have generally been cooling while hovering in a tight trading range perched near its all-time high. It is extended from any sound base. Its 50 DMA line ($365.92) and prior highs in the $362 area define important near-term support to watch on pullbacks. See the latest FSU analysis for more details and a new annotated graph.
>>> FEATURED STOCK ARTICLE : Hovering Near All-Time High With Volume Totals Cooling - 6/25/2020 |
View all notes |
Set NEW NOTE alert |
Company Profile |
SEC
News |
Chart |
Request a new note
C
A
S
I |
TEAM
-
NASDAQ
Atlassian Corp Plc Cl A
Comp Sftwr-Spec Enterprs
|
$181.01
|
+0.65
0.36% |
$182.77
|
2,833,912
148.45% of 50 DAV
50 DAV is 1,909,000
|
$191.72
-5.59%
|
5/4/2020
|
$159.70
|
PP = $156.22
|
|
MB = $164.03
|
Most Recent Note - 6/24/2020 6:32:33 PM
G - Volume was light behind today's loss, consolidating well above its "max buy" level. Near term support is defined by its 50 DMA line ($170.51). The next important near-term support is the prior low ($163.72 on 6/05/20).
>>> FEATURED STOCK ARTICLE : Positive Reversal Near Prior High and 50 DMA Line - 6/5/2020 |
View all notes |
Set NEW NOTE alert |
Company Profile |
SEC
News |
Chart |
Request a new note
C
A
S
I |
Symbol/Exchange
Company Name
Industry Group |
PRICE |
CHANGE
(%Change) |
Day High |
Volume
(% DAV)
(% 50 day avg vol) |
52 Wk Hi
% From Hi |
Featured
Date |
Price
Featured |
Pivot Featured |
|
Max Buy |
TTD
-
NASDAQ
The Trade Desk Inc Cl A
Comml Svcs-Advertising
|
$407.03
|
-2.68
-0.65% |
$418.97
|
2,837,525
133.22% of 50 DAV
50 DAV is 2,130,000
|
$421.06
-3.33%
|
6/3/2020
|
$240.61
|
PP = $327.35
|
|
MB = $343.72
|
Most Recent Note - 6/25/2020 6:31:35 PM
G - Perched near its 52-week high, very extended from any sound base. Prior highs in the $327 area define important near-term support above its 50 DMA line ($316). See the latest FSU analysis for more details and an annotated graph.
>>> FEATURED STOCK ARTICLE : Pullback Breaks Streak of 8 Straight Gains Into New High Ground - 6/24/2020 |
View all notes |
Set NEW NOTE alert |
Company Profile |
SEC
News |
Chart |
Request a new note
C
A
S
I |
DOCU
-
NASDAQ
Docusign Inc
Computer Sftwr-Enterprse
|
$177.58
|
+9.18
5.45% |
$180.45
|
8,455,652
188.28% of 50 DAV
50 DAV is 4,491,000
|
$172.21
3.12%
|
6/10/2020
|
$149.73
|
PP = $152.10
|
|
MB = $159.71
|
Most Recent Note - 6/26/2020 6:19:31 PM
G - Hit yet another new all-time high today, getting very extended from any sound base. Prior high ($152 on 6/02/20) defines initial support to watch well above its 50 DMA line ($131.81). DOCU is now priced +100% above its 200 DMA price ($89), and it is taught in the Certification that a stock trading +70-100% or more above the 200 DMA is to be recognized as a "sell signal".
>>> FEATURED STOCK ARTICLE : Advanced Ascending Base Formed for Strong E-Signature Firm - 6/10/2020 |
View all notes |
Set NEW NOTE alert |
Company Profile |
SEC
News |
Chart |
Request a new note
C
A
S
I |
PING
-
NYSE
Ping Identity Hldg Corp
Computer Sftwr-Security
|
$31.96
|
-0.39
-1.21% |
$32.48
|
829,200
62.68% of 50 DAV
50 DAV is 1,323,000
|
$35.36
-9.62%
|
6/1/2020
|
$29.24
|
PP = $29.90
|
|
MB = $31.40
|
Most Recent Note - 6/24/2020 6:30:18 PM
G - Consolidating just above its "max buy" level. Prior highs in the $29 area define initial support to watch.
>>> FEATURED STOCK ARTICLE : Gain for Recent New High Backed by +71% Above Average Volume - 6/22/2020 |
View all notes |
Set NEW NOTE alert |
Company Profile |
SEC
News |
Chart |
Request a new note
C
A
S
I |
AAXN
-
NASDAQ
Axon Enterprise Inc
Security/Sfty
|
$96.06
|
+0.11
0.11% |
$97.72
|
7,118,311
586.84% of 50 DAV
50 DAV is 1,213,000
|
$104.90
-8.43%
|
5/8/2020
|
$84.86
|
PP = $90.20
|
|
MB = $94.71
|
Most Recent Note - 6/26/2020 6:25:41 PM
G - Posted a small gain today with very heavy volume +54% above average. Completed a new Public Offering on 6/17/20. Prior highs in the $90-91 area have acted as support following a powerful breakout. More damaging losses would raise concerns and trigger a technical sell signal.
>>> FEATURED STOCK ARTICLE : Completed New Pubic Offering and Found Support Near Prior High - 6/19/2020 |
View all notes |
Set NEW NOTE alert |
Company Profile |
SEC
News |
Chart |
Request a new note
C
A
S
I |
GDDY
-
NYSE
Godaddy Inc Cl A
Computer Sftwr-Enterprse
|
$71.56
|
-3.23
-4.32% |
$75.12
|
3,249,846
226.94% of 50 DAV
50 DAV is 1,432,000
|
$84.49
-15.30%
|
6/2/2020
|
$79.62
|
PP = $82.40
|
|
MB = $86.52
|
Most Recent Note - 6/26/2020 6:11:16 PM
G - Color code is changed to green after violating its 50 DMA line ($74.45) with today's 3rd consecutive volume-driven loss triggering a technical sell signal. A prompt rebound above the 50 DMA line is needed to help its outlook improve. Subsequent gains above the pivot point backed by at least +40% above average volume are needed to clinch a convincing technical buy signal. It previously met stubborn resistance in the $82-84 area.
>>> FEATURED STOCK ARTICLE : Hit a New 52-Week High With Today's 8th Consecutive Gain - 6/23/2020 |
View all notes |
Set NEW NOTE alert |
Company Profile |
SEC
News |
Chart |
Request a new note
C
A
S
I |
Symbol/Exchange
Company Name
Industry Group |
PRICE |
CHANGE
(%Change) |
Day High |
Volume
(% DAV)
(% 50 day avg vol) |
52 Wk Hi
% From Hi |
Featured
Date |
Price
Featured |
Pivot Featured |
|
Max Buy |
|
|
|
THESE ARE NOT BUY RECOMMENDATIONS!
Comments contained in the body of this report are technical
opinions only. The material herein has been obtained
from sources believed to be reliable and accurate, however,
its accuracy and completeness cannot be guaranteed.
This site is not an investment advisor, hence it does
not endorse or recommend any securities or other investments.
Any recommendation contained in this report may not
be suitable for all investors and it is not to be deemed
an offer or solicitation on our part with respect to
the purchase or sale of any securities. All trademarks,
service marks and trade names appearing in this report
are the property of their respective owners, and are
likewise used for identification purposes only.
This report is a service available
only to active Paid Premium Members.
You may opt-out of receiving report notifications
at any time. Questions or comments may be submitted
by writing to Premium Membership Services 665 S.E. 10 Street, Suite 201 Deerfield Beach, FL 33441-5634 or by calling 1-800-965-8307
or 954-785-1121.
|
|
|