You are not logged in.
This means you
CAN ONLY VIEW reports that were published prior to Sunday, February 18, 2024.
You
MUST UPGRADE YOUR MEMBERSHIP if you want to see any current reports.
AFTER MARKET UPDATE - THURSDAY, JUNE 25TH, 2020
Previous After Market Report Next After Market Report >>>
|
|
|
|
DOW |
+299.66 |
25,745.60 |
+1.18% |
|
Volume |
966,832,197 |
-12% |
|
Volume |
4,641,660,400 |
-16% |
|
NASDAQ |
+113.19 |
10,022.36 |
+1.14% |
|
Advancers |
1,862 |
64% |
|
Advancers |
2,245 |
67% |
|
S&P 500 |
+33.43 |
3,083.76 |
+1.10% |
|
Decliners |
1,041 |
36% |
|
Decliners |
1,080 |
32% |
|
Russell 2000 |
+23.57 |
1,413.31 |
+1.70% |
|
52 Wk Highs |
25 |
|
|
52 Wk Highs |
74 |
|
|
S&P 600 |
+13.73 |
812.00 |
+1.72% |
|
52 Wk Lows |
16 |
|
|
52 Wk Lows |
15 |
|
|
 |
Major Indices Rose With Less Volume Conviction but More Leadership
Kenneth J. Gruneisen - Passed the CAN SLIM® Master's Exam
The Dow rebounded from a more than 200 point drop to finish 299 points higher. The S&P 500 and Nasdaq Composite both rallied 1.1%. Breadth was positive as advancers led decliners by a 9-5 margin on the NYSE and by more than 2-1 on the Nasdaq exchange. The reported volume totals were lighter than the prior session on the NYSE and on the Nasdaq exchange. There were 20 high-ranked companies from the Leaders List that hit new 52-week highs and were listed on the BreakOuts Page, versus the total of 12 on the prior session. New 52-week highs totals expanded and outnumbered new 52-week lows totals on both exchanges. The major indices remain in a confirmed uptrend (M criteria). Any sustainable rally requires a healthy crop of new leaders, so it will be important to see the new highs totals improve.Charts used courtesy of www.stockcharts.com
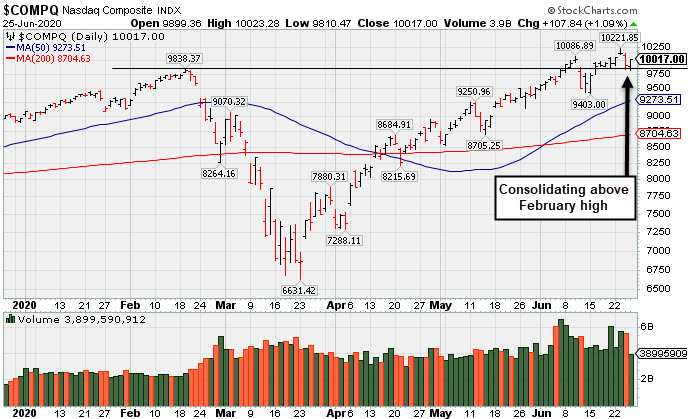
PICTURED: The Nasdaq Composite Index is -13.9% off its record high, consolidating above its February high.
U.S. equities pushed higher during a volatile day of trading on Thursday, with a rally in Financials helping to reverse early session declines. Investors also continued to monitor updates on the coronavirus front. Texas Governor Greg Abbott announced the next phase of reopening in the Lone Star State would be halted, citing the recent surge in COVID-19 cases and hospitalizations.
Ten of 11 S&P 500 sectors finished in positive territory, with the Utilities group the lone laggard. The Financials group paced the gains with a 2.7% advance. Bank stocks provided a tailwind, following news federal regulators will ease some restrictions created after the Financial Crisis, which could free up capital for major banks. The Energy sector also outperformed as WTI crude climbed 2.7% to $39.02/barrel. In earnings, Accenture rose more than 7% after the consulting firm beat profit and revenue estimates.
Economic data was also in focus. The weekly initial jobless claims remained elevated at 1.48 million in the most recent week, while continuing claims dipped below 20 million for the first time since mid-April. Elsewhere, the final revision to first-quarter U.S. GDP showed the economy contracted at a 5.0% pace during the January-March period, in-line with expectations. Another update showed durable goods orders rebounded in May, posting the largest increase since 2014. Treasuries were little changed, with the yield on the benchmark 10-year note holding steady at 0.68%.
|
 Kenneth J. Gruneisen started out as a licensed stockbroker in August 1987, a couple of months prior to the historic stock market crash that took the Dow Jones Industrial Average down -22.6% in a single day. He has published daily fact-based fundamental and technical analysis on high-ranked stocks online for two decades. Through FACTBASEDINVESTING.COM, Kenneth provides educational articles, news, market commentary, and other information regarding proven investment systems that work in good times and bad.
Comments contained in the body of this report are technical opinions only and are not necessarily those of Gruneisen Growth Corp. The material herein has been obtained from sources believed to be reliable and accurate, however, its accuracy and completeness cannot be guaranteed. Our firm, employees, and customers may effect transactions, including transactions contrary to any recommendation herein, or have positions in the securities mentioned herein or options with respect thereto. Any recommendation contained in this report may not be suitable for all investors and it is not to be deemed an offer or solicitation on our part with respect to the purchase or sale of any securities. |
|
 |
Energy, Financial, and Biotech Indexes Led Group Gainers
Kenneth J. Gruneisen - Passed the CAN SLIM® Master's Exam
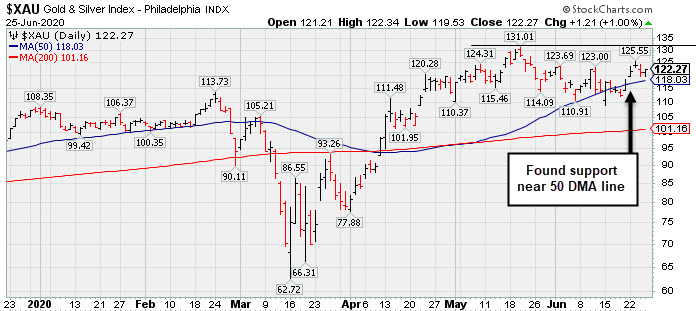
Energy-linked groups rose as the Integrated Oil Index ($XOI +1.73%) and the Oil Services Index ($OSX +3.43%) each repaired part of Wednesday's big losses and the Gold & Silver Index ($XAU +1.00%) posted a smaller gain. Financials also rebounded to help the major indices as the Broker/Dealer Index ($XBD +2.88%) and the Bank Index ($BKX +3.35%) both posted solid gains. The Retail Index ($RLX +0.35%) edged higher. The tech sector was led higher by the Biotech Index ($BTK +1.71%) while both the Semiconductor Index ($SOX +0.86%) and the Networking Index ($NWX +0.67%) also rose modestly.
PICTURED: The Gold & Silver Index ($XAU +1.00%) is consolidating -6.7% below its 52-week high. During its prior consolidation it recently found prompt support near its 50-day moving average (DMA) line.
| Oil Services |
$OSX |
33.11 |
+1.06 |
+3.31% |
-57.71% |
| Integrated Oil |
$XOI |
785.96 |
+13.36 |
+1.73% |
-38.14% |
| Semiconductor |
$SOX |
1,963.48 |
+19.18 |
+0.99% |
+6.16% |
| Networking |
$NWX |
538.87 |
+3.60 |
+0.67% |
-7.63% |
| Broker/Dealer |
$XBD |
273.09 |
+7.65 |
+2.88% |
-5.95% |
| Retail |
$RLX |
2,911.59 |
+10.53 |
+0.36% |
+18.88% |
| Gold & Silver |
$XAU |
122.29 |
+1.23 |
+1.02% |
+14.38% |
| Bank |
$BKX |
76.92 |
+2.49 |
+3.35% |
-32.15% |
| Biotech |
$BTK |
5,826.49 |
+98.14 |
+1.71% |
+14.98% |
|
|
|
 |
Hovering Near All-Time High With Volume Totals Cooling
Kenneth J. Gruneisen - Passed the CAN SLIM® Master's Exam
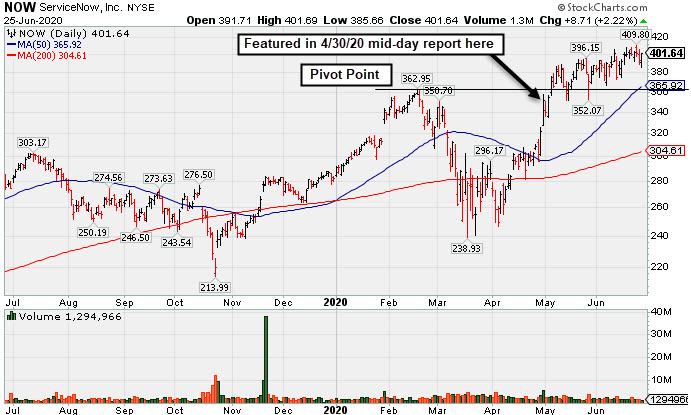
ServiceNow Inc (NOW +$8.71 or +2.22% to $401.64) posted a gain today with light volume. Volume totals have generally been cooling while hovering in a tight trading range perched near its all-time high, stubbornly holding its ground. It is extended from any sound base. Its 50-day moving average (DMA) line ($365.92) and prior highs in the $362 area define important near-term support to watch on pullbacks. See the latest FSU analysis for more details and a new annotated graph.
NOW was highlighted in yellow with new pivot point cited based on its 2/19/20 high plus 10 cents in the 4/30/20 mid-day report (read here). It was last shown in this FSU section on 6/04/20 with an annotated graph under the headline, "Quiet Pullback Below "Max Buy" Level for NOW".
Annual earnings (A criteria) growth has been strong since FY '15. Quarterly comparisons through Mar '20 versus the year ago periods have been routinely above the +25% minimum earnings guideline (C criteria). It has an Earnings Per Share Rating of 98. The Computer Software - Enterprise group has a Group Relative Strength Rating of 99, a reassuring sign concerning the L criteria. NOW has a new CEO as of 1/01/20.
The number of top-rated funds owning its shares rose from 1,030 in Jun '17 to 2.100 in Mar '20, a reassuring sign concerning the I criteria. It has a Timeliness Rating of A and a Sponsorship Rating of B. Its current Up/Down Volume Ratio of 1.3 is an unbiased indication its shares have been under accumulation over the past 50 days. |
|
|
Color Codes Explained :
Y - Better candidates highlighted by our
staff of experts.
G - Previously featured
in past reports as yellow but may no longer be buyable under the
guidelines.
***Last / Change / Volume data in this table is the closing quote data***
Symbol/Exchange
Company Name
Industry Group |
PRICE |
CHANGE
(%Change) |
Day High |
Volume
(% DAV)
(% 50 day avg vol) |
52 Wk Hi
% From Hi |
Featured
Date |
Price
Featured |
Pivot Featured |
|
Max Buy |
 FTNT
-
NASDAQ
FTNT
-
NASDAQ
Fortinet Inc
Computer Sftwr-Security
|
$135.83
|
+1.50
1.12% |
$136.81
|
1,124,863
63.59% of 50 DAV
50 DAV is 1,769,000
|
$149.69
-9.26%
|
6/22/2020
|
$142.68
|
PP = $149.79
|
|
MB = $157.28
|
 Most Recent Note - 6/25/2020 6:30:13 PM
Y - Consolidating above its 50 DMA line ($129) and above the prior low ($126.88 on 6/15/20) which define important near-term support to watch on pullbacks. Subsequent gains above the pivot point backed by at least +40% above average volume are needed to trigger a new (or add-on) technical buy signal.
>>> FEATURED STOCK ARTICLE : Managed a "Positive Reversal" After Brief Dip Below "Max Buy" Level - 6/15/2020 |
View all notes |
Set NEW NOTE alert |
Company Profile |
SEC
News |
Chart |
Request a new note
C
A
S
I |
EBS
-
NYSE
Emergent Biosolutions
DRUGS - Biotechnology
|
$76.10
|
+2.95
4.03% |
$76.52
|
861,498
135.24% of 50 DAV
50 DAV is 637,000
|
$93.58
-18.68%
|
6/1/2020
|
$72.10
|
PP = $90.10
|
|
MB = $94.61
|
Most Recent Note - 6/25/2020 6:20:24 PM
G - Held its ground stubbornly in recent weeks and today's volume-driven gain helped it rebound neat its 50 DMA line. Subsequent gains above the 50 DMA line ($77.25) are still needed to help its outlook improve. Any damaging losses below the recent low ($66.69) may trigger a more worrisome technical sell signal. Fundamentals remain strong.
>>> FEATURED STOCK ARTICLE : Still Below 50-Day Moving Average Following Damaging Gap Down - 6/16/2020 |
View all notes |
Set NEW NOTE alert |
Company Profile |
SEC
News |
Chart |
Request a new note
C
A
S
I |
NBIX
-
NASDAQ
Neurocrine Biosciences
DRUGS - Biotechnology
|
$128.47
|
+3.11
2.48% |
$129.21
|
927,460
108.60% of 50 DAV
50 DAV is 854,000
|
$131.00
-1.93%
|
5/19/2020
|
$123.71
|
PP = $119.75
|
|
MB = $125.74
|
Most Recent Note - 6/25/2020 10:40:39 AM
G - Color code is changed to green after rising back above its "max buy" level. Prior highs in the $119 area define important near-term support to watch above its 50 DMA line ($113.21). Fundamentals remain strong.
>>> FEATURED STOCK ARTICLE : Pullback Into Prior Base Negated Recent Breakout - 6/8/2020 |
View all notes |
Set NEW NOTE alert |
Company Profile |
SEC
News |
Chart |
Request a new note
C
A
S
I |
BMRN
-
NASDAQ
Biomarin Pharmaceutical
DRUGS - Drug Manufacturers - Other
|
$124.22
|
+3.59
2.98% |
$124.74
|
2,113,202
127.22% of 50 DAV
50 DAV is 1,661,000
|
$124.95
-0.58%
|
6/17/2020
|
$110.95
|
PP = $112.67
|
|
MB = $118.30
|
Most Recent Note - 6/25/2020 6:26:08 PM
G - Posted a volume-driven gain today for a best ever close. Stubbornly held its ground after a streak of gains for new highs marked by heavy volume. Reported strong results for the Mar '20 quarter and recent comparisons showed improved earnings increases. Annual earnings (A criteria) history has been strong. Prior high ($112.57) defines initial support to watch on pullbacks.
>>> FEATURED STOCK ARTICLE : Hit New 52-Week High But Closed Below Pivot After 3-Weeks Tight - 6/17/2020 |
View all notes |
Set NEW NOTE alert |
Company Profile |
SEC
News |
Chart |
Request a new note
C
A
S
I |
AMD
-
NASDAQ
Advanced Micro Devices
ELECTRONICS - Semiconductor - Broad Line
|
$51.93
|
-0.46
-0.88% |
$52.70
|
50,988,169
81.09% of 50 DAV
50 DAV is 62,880,000
|
$59.27
-12.38%
|
6/9/2020
|
$55.41
|
PP = $56.98
|
|
MB = $59.83
|
Most Recent Note - 6/25/2020 6:24:27 PM
G - Slumped further below its 50 DMA line ($54.07) with below average volume behind today's 3rd consecutive loss. A prompt rebound above the 50 DMA line is needed for its outlook to improve The prior low ($49.09 on 5/27/20) defines the next important support to watch. Met stubborn resistance in the $57-59 area. Subsequent gains into new high territory may mark the beginning of a substantial leg higher. Fundamentals remain strong.
>>> FEATURED STOCK ARTICLE : Big Chip Firm Showing Strong Sales Revenues and Earnings Increases - 6/9/2020 |
View all notes |
Set NEW NOTE alert |
Company Profile |
SEC
News |
Chart |
Request a new note
C
A
S
I |
Symbol/Exchange
Company Name
Industry Group |
PRICE |
CHANGE
(%Change) |
Day High |
Volume
(% DAV)
(% 50 day avg vol) |
52 Wk Hi
% From Hi |
Featured
Date |
Price
Featured |
Pivot Featured |
|
Max Buy |
TREX
-
NYSE
Trex Company Inc
MATERIALS and CONSTRUCTION - General Building Materials
|
$122.95
|
+0.26
0.21% |
$123.03
|
1,123,845
119.30% of 50 DAV
50 DAV is 942,000
|
$132.84
-7.45%
|
5/5/2020
|
$109.05
|
PP = $111.95
|
|
MB = $117.55
|
Most Recent Note - 6/24/2020 6:44:21 PM
G - Still consolidating above its "max buy" level. Prior highs in the $111 area define important support nearly coinciding with its 50 DMA line ($110.37). Fundamentals remain strong.
>>> FEATURED STOCK ARTICLE : Pullback Toward Prior Highs Which Define Near-Term Support - 6/11/2020 |
View all notes |
Set NEW NOTE alert |
Company Profile |
SEC
News |
Chart |
Request a new note
C
A
S
I |
NFLX
-
NASDAQ
Netflix Inc
SPECIALTY RETAIL - Music and Video Stores
|
$465.91
|
+8.06
1.76% |
$467.01
|
3,938,467
50.72% of 50 DAV
50 DAV is 7,765,000
|
$474.01
-1.71%
|
5/14/2020
|
$441.95
|
PP = $449.62
|
|
MB = $472.10
|
Most Recent Note - 6/25/2020 6:28:15 PM
Y - Hovering near its all-time high with today's gain backed by below average volume. Found support near its 50 DMA line ($432.82) recently. Gains above a stock's pivot point must have at least +40% above average volume to trigger a proper new (or add-on) technical buy signal. Any damaging losses below the 50 DMA line and prior lows would trigger a more worrisome technical sell signal.
>>> FEATURED STOCK ARTICLE : Weak Action Led to 50-Day Moving Average Violation - 6/12/2020 |
View all notes |
Set NEW NOTE alert |
Company Profile |
SEC
News |
Chart |
Request a new note
C
A
S
I |
CHGG
-
NYSE
Chegg Inc
Consumer Svcs-Education
|
$64.95
|
+0.80
1.25% |
$65.00
|
4,041,683
97.86% of 50 DAV
50 DAV is 4,130,000
|
$70.57
-7.96%
|
6/17/2020
|
$63.71
|
PP = $68.08
|
|
MB = $71.48
|
Most Recent Note - 6/24/2020 6:28:07 PM
Y - Slumped further below its pivot point with a loss today on lighter than average volume raising some concerns. Disciplined investors may note that the recent gain above the pivot point was not backed by the at least +40% above average volume necessary to trigger a convincing technical buy signal.
>>> FEATURED STOCK ARTICLE : Formed a Flat Base Perched Within Striking Distance of 52-Week High - 6/18/2020 |
View all notes |
Set NEW NOTE alert |
Company Profile |
SEC
News |
Chart |
Request a new note
C
A
S
I |
NOW
-
NYSE
Servicenow Inc
Computer Sftwr-Enterprse
|
$401.64
|
+8.71
2.22% |
$401.69
|
1,292,320
62.58% of 50 DAV
50 DAV is 2,065,000
|
$409.80
-1.99%
|
4/30/2020
|
$343.05
|
PP = $363.05
|
|
MB = $381.20
|
Most Recent Note - 6/25/2020 6:18:51 PM
G - Posted a gain today with light volume. Volume totals have generally been cooling while hovering in a tight trading range perched near its all-time high. It is extended from any sound base. Its 50 DMA line ($365.92) and prior highs in the $362 area define important near-term support to watch on pullbacks. See the latest FSU analysis for more details and a new annotated graph.
>>> FEATURED STOCK ARTICLE : Hovering Near All-Time High With Volume Totals Cooling - 6/25/2020 |
View all notes |
Set NEW NOTE alert |
Company Profile |
SEC
News |
Chart |
Request a new note
C
A
S
I |
TEAM
-
NASDAQ
Atlassian Corp Plc Cl A
Comp Sftwr-Spec Enterprs
|
$180.36
|
+3.54
2.00% |
$181.33
|
1,446,236
75.48% of 50 DAV
50 DAV is 1,916,000
|
$191.72
-5.93%
|
5/4/2020
|
$159.70
|
PP = $156.22
|
|
MB = $164.03
|
Most Recent Note - 6/24/2020 6:32:33 PM
G - Volume was light behind today's loss, consolidating well above its "max buy" level. Near term support is defined by its 50 DMA line ($170.51). The next important near-term support is the prior low ($163.72 on 6/05/20).
>>> FEATURED STOCK ARTICLE : Positive Reversal Near Prior High and 50 DMA Line - 6/5/2020 |
View all notes |
Set NEW NOTE alert |
Company Profile |
SEC
News |
Chart |
Request a new note
C
A
S
I |
Symbol/Exchange
Company Name
Industry Group |
PRICE |
CHANGE
(%Change) |
Day High |
Volume
(% DAV)
(% 50 day avg vol) |
52 Wk Hi
% From Hi |
Featured
Date |
Price
Featured |
Pivot Featured |
|
Max Buy |
TTD
-
NASDAQ
The Trade Desk Inc Cl A
Comml Svcs-Advertising
|
$409.71
|
+13.34
3.37% |
$410.10
|
1,484,108
69.77% of 50 DAV
50 DAV is 2,127,000
|
$421.06
-2.70%
|
6/3/2020
|
$240.61
|
PP = $327.35
|
|
MB = $343.72
|
Most Recent Note - 6/25/2020 6:31:35 PM
G - Perched near its 52-week high, very extended from any sound base. Prior highs in the $327 area define important near-term support above its 50 DMA line ($316). See the latest FSU analysis for more details and an annotated graph.
>>> FEATURED STOCK ARTICLE : Pullback Breaks Streak of 8 Straight Gains Into New High Ground - 6/24/2020 |
View all notes |
Set NEW NOTE alert |
Company Profile |
SEC
News |
Chart |
Request a new note
C
A
S
I |
DOCU
-
NASDAQ
Docusign Inc
Computer Sftwr-Enterprse
|
$168.40
|
+4.49
2.74% |
$169.80
|
3,348,892
74.74% of 50 DAV
50 DAV is 4,481,000
|
$172.21
-2.21%
|
6/10/2020
|
$149.73
|
PP = $152.10
|
|
MB = $159.71
|
Most Recent Note - 6/24/2020 12:25:01 PM
G - Pulling back after getting extended from the recently noted new base. Prior high ($152 on 6/02/20) defines initial support to watch well above its 50 DMA line ($129).
>>> FEATURED STOCK ARTICLE : Advanced Ascending Base Formed for Strong E-Signature Firm - 6/10/2020 |
View all notes |
Set NEW NOTE alert |
Company Profile |
SEC
News |
Chart |
Request a new note
C
A
S
I |
PING
-
NYSE
Ping Identity Hldg Corp
Computer Sftwr-Security
|
$32.35
|
+0.65
2.05% |
$32.39
|
682,089
51.28% of 50 DAV
50 DAV is 1,330,000
|
$35.36
-8.51%
|
6/1/2020
|
$29.24
|
PP = $29.90
|
|
MB = $31.40
|
Most Recent Note - 6/24/2020 6:30:18 PM
G - Consolidating just above its "max buy" level. Prior highs in the $29 area define initial support to watch.
>>> FEATURED STOCK ARTICLE : Gain for Recent New High Backed by +71% Above Average Volume - 6/22/2020 |
View all notes |
Set NEW NOTE alert |
Company Profile |
SEC
News |
Chart |
Request a new note
C
A
S
I |
AAXN
-
NASDAQ
Axon Enterprise Inc
Security/Sfty
|
$95.95
|
+2.52
2.70% |
$95.95
|
1,005,593
83.66% of 50 DAV
50 DAV is 1,202,000
|
$104.90
-8.53%
|
5/8/2020
|
$84.86
|
PP = $90.20
|
|
MB = $94.71
|
Most Recent Note - 6/25/2020 6:22:58 PM
G - Posted a gain on light volume today and closed back above its "max buy" level. Completed a new Public Offering on 6/17/20. Prior highs in the $90-91 area have acted as support following a powerful breakout. More damaging losses would raise concerns and trigger a technical sell signal.
>>> FEATURED STOCK ARTICLE : Completed New Pubic Offering and Found Support Near Prior High - 6/19/2020 |
View all notes |
Set NEW NOTE alert |
Company Profile |
SEC
News |
Chart |
Request a new note
C
A
S
I |
GDDY
-
NYSE
Godaddy Inc Cl A
Computer Sftwr-Enterprse
|
$74.79
|
-0.80
-1.06% |
$76.35
|
2,077,393
147.44% of 50 DAV
50 DAV is 1,409,000
|
$84.49
-11.48%
|
6/2/2020
|
$79.62
|
PP = $82.40
|
|
MB = $86.52
|
Most Recent Note - 6/25/2020 1:04:23 PM
Y - Slumping near its 50 DMA line ($74.31) today after abruptly retreating on the prior session with a volume-driven loss following 8 consecutive gains. A violation of the 50 DMA line would trigger a technical sell signal. On 6/23/20 it hit a new 52-week high but finished near the session low. Subsequent gains above the pivot point backed by at least +40% above average volume are needed to clinch a convincing technical buy signal. It previously met stubborn resistance in the $82-84 area.
>>> FEATURED STOCK ARTICLE : Hit a New 52-Week High With Today's 8th Consecutive Gain - 6/23/2020 |
View all notes |
Set NEW NOTE alert |
Company Profile |
SEC
News |
Chart |
Request a new note
C
A
S
I |
Symbol/Exchange
Company Name
Industry Group |
PRICE |
CHANGE
(%Change) |
Day High |
Volume
(% DAV)
(% 50 day avg vol) |
52 Wk Hi
% From Hi |
Featured
Date |
Price
Featured |
Pivot Featured |
|
Max Buy |
|
|
|
THESE ARE NOT BUY RECOMMENDATIONS!
Comments contained in the body of this report are technical
opinions only. The material herein has been obtained
from sources believed to be reliable and accurate, however,
its accuracy and completeness cannot be guaranteed.
This site is not an investment advisor, hence it does
not endorse or recommend any securities or other investments.
Any recommendation contained in this report may not
be suitable for all investors and it is not to be deemed
an offer or solicitation on our part with respect to
the purchase or sale of any securities. All trademarks,
service marks and trade names appearing in this report
are the property of their respective owners, and are
likewise used for identification purposes only.
This report is a service available
only to active Paid Premium Members.
You may opt-out of receiving report notifications
at any time. Questions or comments may be submitted
by writing to Premium Membership Services 665 S.E. 10 Street, Suite 201 Deerfield Beach, FL 33441-5634 or by calling 1-800-965-8307
or 954-785-1121.
|
|
|