You are not logged in.
This means you
CAN ONLY VIEW reports that were published prior to Sunday, February 25, 2024.
You
MUST UPGRADE YOUR MEMBERSHIP if you want to see any current reports.
AFTER MARKET UPDATE - TUESDAY, JUNE 23RD, 2020
Previous After Market Report Next After Market Report >>>
|
|
|
|
DOW |
+131.14 |
26,156.10 |
+0.50% |
|
Volume |
1,016,090,020 |
-5% |
|
Volume |
5,660,422,600 |
+28% |
|
NASDAQ |
+74.90 |
10,131.37 |
+0.74% |
|
Advancers |
1,664 |
57% |
|
Advancers |
1,800 |
54% |
|
S&P 500 |
+13.43 |
3,131.29 |
+0.43% |
|
Decliners |
1,234 |
43% |
|
Decliners |
1,525 |
46% |
|
Russell 2000 |
+5.81 |
1,439.34 |
+0.41% |
|
52 Wk Highs |
63 |
|
|
52 Wk Highs |
200 |
|
|
S&P 600 |
+2.98 |
828.11 |
+0.36% |
|
52 Wk Lows |
3 |
|
|
52 Wk Lows |
9 |
|
|
 |
Leadership Improved Behind More Gains for Major Indices
Kenneth J. Gruneisen - Passed the CAN SLIM® Master's Exam
The Dow rose 131 points, while the S&P 500 advanced 0.4%. The Nasdaq Composite gained 0.7%, and closed at an all-time high for its eighth consecutive daily advance. Advancers led decliners by a 4-3 margin on the NYSE and 6-5 on the Nasdaq exchange. The reported volume totals were mixed, lighter than the prior session on the NYSE and higher on the Nasdaq exchange. There were 69 high-ranked companies from the Leaders List that hit new 52-week highs and were listed on the BreakOuts Page, versus the total of 49 on the prior session. New 52-week highs totals again easily outnumbered new 52-week lows totals which were in the single digits on both exchanges. The major indices remain in a confirmed uptrend (M criteria). Any sustainable rally requires a healthy crop of new leaders, so it has been encouraging to recently see the new highs totals improve.Charts used courtesy of www.stockcharts.com
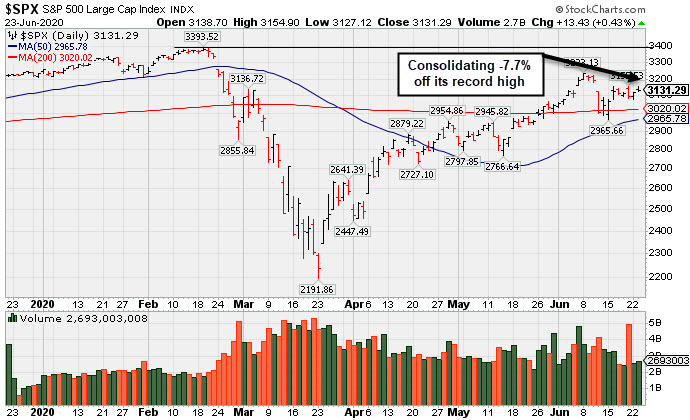
PICTURED: The S&P 500 Index is consolidating -7.7% off its record high.
Stocks finished higher Tuesday as investor sentiment was bolstered by hopes of additional fiscal stimulus and economic data showing signs of stabilization. Elsewhere, President Donald Trump reassured investors that the U.S-China phase one trade deal was still “fully intact,” dispelling comments from White House adviser Peter Navarro that the deal was over.
On the data front, the preliminary updates from research firm Markit showed U.S. manufacturing and services sectors both improved in June. A separate report showed new home sales surged 16.6% in May, much better than estimates calling for a 2.7% uptick and a sharp rebound from the April’s downwardly revised 5.2% decline. Elsewhere, the release of the Richmond Fed manufacturing index for June extended a recent trend of regional gauges surprising on the upside. Treasuries fluctuated, with the yield on the 10-year note up one basis points to 0.71%. In commodities, COMEX gold rose 1.0% to $1,774.50/ounce, near a seven-year high amid a weaker dollar.
Seven of 11 S&P 500 sectors ended the day in positive territory with the Consumer Discretionary group pacing gains. The Technology sector also notably outperformed, with shares of Apple (AAPL +2.13%). In corporate news, American Airlines (AAL -6.17%) after increasing the size of its planned financing. Meanwhile, Fitness equipment maker Peloton (PTON +3.49%) hit a new all-time high following positive commentary from a Wall Street analyst.
|
 Kenneth J. Gruneisen started out as a licensed stockbroker in August 1987, a couple of months prior to the historic stock market crash that took the Dow Jones Industrial Average down -22.6% in a single day. He has published daily fact-based fundamental and technical analysis on high-ranked stocks online for two decades. Through FACTBASEDINVESTING.COM, Kenneth provides educational articles, news, market commentary, and other information regarding proven investment systems that work in good times and bad.
Comments contained in the body of this report are technical opinions only and are not necessarily those of Gruneisen Growth Corp. The material herein has been obtained from sources believed to be reliable and accurate, however, its accuracy and completeness cannot be guaranteed. Our firm, employees, and customers may effect transactions, including transactions contrary to any recommendation herein, or have positions in the securities mentioned herein or options with respect thereto. Any recommendation contained in this report may not be suitable for all investors and it is not to be deemed an offer or solicitation on our part with respect to the purchase or sale of any securities. |
|
 |
Retail, Financial, and Commodity-Linked Groups Led Gainers
Kenneth J. Gruneisen - Passed the CAN SLIM® Master's Exam
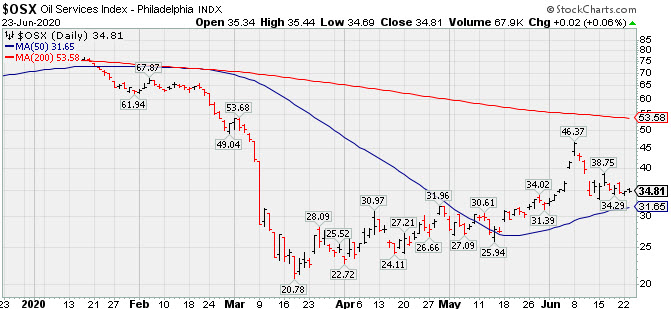
The Retail Index ($RLX +1.19%) finished with a solid gain while the Broker/Dealer Index ($XBD +0.30%) and the Bank Index ($BKX +0.44%) both edged higher. The tech sector was mixed as the Biotech Index ($BTK +0.27%) and the Semiconductor Index ($SOX +0.22%) each edged higher but the Networking Index ($NWX -0.88%) lost ground. The Gold & Silver Index ($XAU +1.67%) outpaced the Integrated Oil Index ($XOI +0.53%) and the Oil Services Index ($OSX +0.06%) finished flat.
PICTURED: The Oil Services Index ($OSX +0.06%) is consolidating above near-term support defined by its 50-day moving average (DMA) line.
| Oil Services |
$OSX |
34.81 |
+0.02 |
+0.06% |
-55.54% |
| Integrated Oil |
$XOI |
820.53 |
+4.36 |
+0.53% |
-35.42% |
| Semiconductor |
$SOX |
1,987.73 |
+4.37 |
+0.22% |
+7.47% |
| Networking |
$NWX |
551.40 |
-5.21 |
-0.94% |
-5.49% |
| Broker/Dealer |
$XBD |
274.32 |
+0.81 |
+0.30% |
-5.53% |
| Retail |
$RLX |
3,014.31 |
+35.57 |
+1.19% |
+23.07% |
| Gold & Silver |
$XAU |
123.78 |
+2.08 |
+1.71% |
+15.77% |
| Bank |
$BKX |
78.20 |
+0.35 |
+0.45% |
-31.02% |
| Biotech |
$BTK |
5,862.27 |
+15.57 |
+0.27% |
+15.68% |
|
|
|
 |
Hit a New 52-Week High With Today's 8th Consecutive Gain
Kenneth J. Gruneisen - Passed the CAN SLIM® Master's Exam
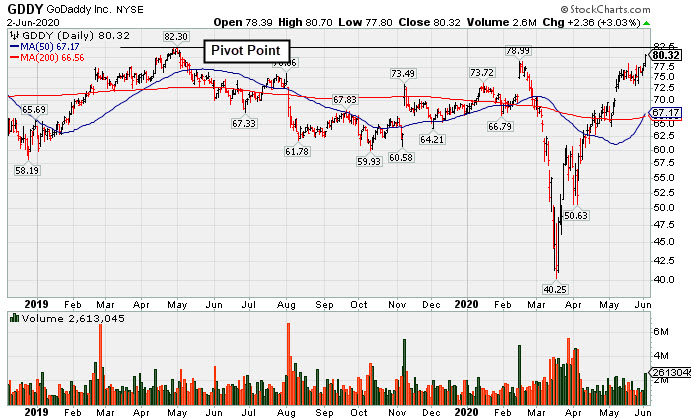
Godaddy Inc Cl A (GDDY +$0.30 or +0.36% to $82.71) posted an 8th consecutive gain today and hit a new 52-week high but finished near the session low. Confirming gains above the pivot point backed by at least +40% above average volume are still needed to trigger a convincing technical buy signal. It previously met stubborn resistance in the $82-84 area. Disciplined investors know to watch for proof of fresh institutional buying demand that can lead to a sustained rally and meaningful leg up.
GDDY was highlighted in yellow with pivot point cited based on its 5/01/19 high plus 10 cents in the 6/02/20 mid-day report (read here) and it was shown in this FSU section that evening with an annotated graph under the headline, "Godaddy Could Be Ready to Go for New Highs".
The Computer Software-Enterprise industry group has a 99 Group Relative Strength Rating (L criteria). The firm's past 3 quarterly earnings comparisons through Mar '20 versus the year ago periods were above the +25% minimum guideline (C criteria). After years of losses, since FY 17 its annual earnings growth (A criteria) has been strong. It the highest possible 99 Earnings Per Share rating.
The number of top-rated funds owning its shares reportedly fell from 947 in Dec '19 to 920 in Mar '20, however, its current Up/Down Volume Ratio of 2.8 is an unbiased indication its shares have been under accumulation over the past 50 days. It has an A Timelines Rating and a B Accumulation/Distribution Rating.
|
|
|
Color Codes Explained :
Y - Better candidates highlighted by our
staff of experts.
G - Previously featured
in past reports as yellow but may no longer be buyable under the
guidelines.
***Last / Change / Volume data in this table is the closing quote data***
Symbol/Exchange
Company Name
Industry Group |
PRICE |
CHANGE
(%Change) |
Day High |
Volume
(% DAV)
(% 50 day avg vol) |
52 Wk Hi
% From Hi |
Featured
Date |
Price
Featured |
Pivot Featured |
|
Max Buy |
 FTNT
-
NASDAQ
FTNT
-
NASDAQ
Fortinet Inc
Computer Sftwr-Security
|
$137.07
|
-5.80
-4.06% |
$144.50
|
1,985,560
112.37% of 50 DAV
50 DAV is 1,767,000
|
$149.69
-8.43%
|
6/22/2020
|
$142.68
|
PP = $149.79
|
|
MB = $157.28
|
 Most Recent Note - 6/23/2020 5:15:36 PM
Y - Pulled back today for a big loss on near average volume following 3 consecutive gains marked by higher volume. Subsequent gains above the pivot point backed by at least +40% above average volume are needed to trigger a new (or add-on) technical buy signal. The prior low ($126.88 on 6/15/20) and its 50 DMA line ($128) define important near-term support to watch on pullbacks.
>>> FEATURED STOCK ARTICLE : Managed a "Positive Reversal" After Brief Dip Below "Max Buy" Level - 6/15/2020 |
View all notes |
Set NEW NOTE alert |
Company Profile |
SEC
News |
Chart |
Request a new note
C
A
S
I |
EBS
-
NYSE
Emergent Biosolutions
DRUGS - Biotechnology
|
$74.35
|
+1.24
1.70% |
$76.00
|
586,307
93.66% of 50 DAV
50 DAV is 626,000
|
$93.58
-20.55%
|
6/1/2020
|
$72.10
|
PP = $90.10
|
|
MB = $94.61
|
Most Recent Note - 6/19/2020 5:46:56 PM
G - Posted a gain with above average volume. Subsequent gains and a convincing rebound above the 50 DMA line ($76.33) are still needed to help its outlook improve. Any damaging losses below the recent low ($66.69) may trigger a more worrisome technical sell signal. Fundamentals remain strong.
>>> FEATURED STOCK ARTICLE : Still Below 50-Day Moving Average Following Damaging Gap Down - 6/16/2020 |
View all notes |
Set NEW NOTE alert |
Company Profile |
SEC
News |
Chart |
Request a new note
C
A
S
I |
NBIX
-
NASDAQ
Neurocrine Biosciences
DRUGS - Biotechnology
|
$127.67
|
+0.26
0.20% |
$131.00
|
663,372
77.86% of 50 DAV
50 DAV is 852,000
|
$129.73
-1.59%
|
5/19/2020
|
$123.71
|
PP = $119.75
|
|
MB = $125.74
|
Most Recent Note - 6/19/2020 5:45:20 PM
G - Powered to a new 52-week high with a considerable volume-driven gain clinching a technical buy signal while quickly rallying above the "max buy" level. Recent quarterly comparisons through Mar '20 showed greatly improved sales revenues and earnings increases versus year ago periods (C criteria). After years of losses it reported solid annual earnings (A criteria) in FY '18 and '19.
>>> FEATURED STOCK ARTICLE : Pullback Into Prior Base Negated Recent Breakout - 6/8/2020 |
View all notes |
Set NEW NOTE alert |
Company Profile |
SEC
News |
Chart |
Request a new note
C
A
S
I |
BMRN
-
NASDAQ
Biomarin Pharmaceutical
DRUGS - Drug Manufacturers - Other
|
$121.72
|
-0.62
-0.51% |
$123.81
|
1,505,011
89.96% of 50 DAV
50 DAV is 1,673,000
|
$124.95
-2.59%
|
6/17/2020
|
$110.95
|
PP = $112.67
|
|
MB = $118.30
|
Most Recent Note - 6/19/2020 5:40:01 PM
G - Posted a 6th consecutive gain today with +184% above average volume as it clinched a convincing technical buy signal and quickly powered above its "max buy" level. Color code is changed to green. Reported strong results for the Mar '20 quarter and recent comparisons showed improved earnings increases. Annual earnings (A criteria) history has been strong. Prior high ($112.57) defines initial support to watch on pullbacks.
>>> FEATURED STOCK ARTICLE : Hit New 52-Week High But Closed Below Pivot After 3-Weeks Tight - 6/17/2020 |
View all notes |
Set NEW NOTE alert |
Company Profile |
SEC
News |
Chart |
Request a new note
C
A
S
I |
AMD
-
NASDAQ
Advanced Micro Devices
ELECTRONICS - Semiconductor - Broad Line
|
$53.99
|
-0.77
-1.41% |
$55.37
|
47,786,516
74.85% of 50 DAV
50 DAV is 63,840,000
|
$59.27
-8.91%
|
6/9/2020
|
$55.41
|
PP = $56.98
|
|
MB = $59.83
|
Most Recent Note - 6/22/2020 3:30:06 PM
Y - Volume totals have been cooling while consolidating above its 50 DMA line ($54.12). The prior low ($49.09 on 5/27/20) defines the next important support to watch. Subsequent gains above the pivot point backed by at least +40% above average volume are still needed to trigger a convincing technical buy signal. Previously met stubborn resistance in the $57-59 area. Gains into new high territory may mark the beginning of a substantial leg higher. The 3 latest quarterly comparisons through Mar '20 showed very strong earnings increases with greatly improved sales revenues growth in the Dec '19 and Mar '20 comparisons versus the year ago period.
>>> FEATURED STOCK ARTICLE : Big Chip Firm Showing Strong Sales Revenues and Earnings Increases - 6/9/2020 |
View all notes |
Set NEW NOTE alert |
Company Profile |
SEC
News |
Chart |
Request a new note
C
A
S
I |
Symbol/Exchange
Company Name
Industry Group |
PRICE |
CHANGE
(%Change) |
Day High |
Volume
(% DAV)
(% 50 day avg vol) |
52 Wk Hi
% From Hi |
Featured
Date |
Price
Featured |
Pivot Featured |
|
Max Buy |
TREX
-
NYSE
Trex Company Inc
MATERIALS and CONSTRUCTION - General Building Materials
|
$124.25
|
+0.86
0.70% |
$125.98
|
696,614
73.02% of 50 DAV
50 DAV is 954,000
|
$132.84
-6.47%
|
5/5/2020
|
$109.05
|
PP = $111.95
|
|
MB = $117.55
|
Most Recent Note - 6/19/2020 5:48:21 PM
G - Color code is changed to green while consolidating above its "max buy" level. Prior highs in the $111 area define important support to watch above its 50 DMA line ($107.89). Fundamentals remain strong.
>>> FEATURED STOCK ARTICLE : Pullback Toward Prior Highs Which Define Near-Term Support - 6/11/2020 |
View all notes |
Set NEW NOTE alert |
Company Profile |
SEC
News |
Chart |
Request a new note
C
A
S
I |
NFLX
-
NASDAQ
Netflix Inc
SPECIALTY RETAIL - Music and Video Stores
|
$466.26
|
-1.78
-0.38% |
$474.01
|
5,680,904
70.88% of 50 DAV
50 DAV is 8,015,000
|
$468.59
-0.50%
|
5/14/2020
|
$441.95
|
PP = $449.62
|
|
MB = $472.10
|
Most Recent Note - 6/22/2020 3:45:33 PM
Y - Hitting a new all-time high with today's 6th consecutive gain backed by below average volume. Found support near its 50 DMA line ($429.74) recently. Gains above a stock's pivot point must have at least +40% above average volume to trigger a proper new (or add-on) technical buy signal. Any damaging losses below the 50 DMA line and prior lows would trigger a more worrisome technical sell signal.
>>> FEATURED STOCK ARTICLE : Weak Action Led to 50-Day Moving Average Violation - 6/12/2020 |
View all notes |
Set NEW NOTE alert |
Company Profile |
SEC
News |
Chart |
Request a new note
C
A
S
I |
CHGG
-
NYSE
Chegg Inc
Consumer Svcs-Education
|
$66.72
|
-3.11
-4.45% |
$70.42
|
4,157,948
102.31% of 50 DAV
50 DAV is 4,064,000
|
$70.57
-5.46%
|
6/17/2020
|
$63.71
|
PP = $68.08
|
|
MB = $71.48
|
Most Recent Note - 6/23/2020 4:43:35 PM
Y - Pulled back below its pivot point with a loss today on average volume raising some concerns. Hit a new 52-week high on the prior session with +30% above average volume behind a considerable gain. Highlighted in yellow in the 6/17/20 mid-day report with a new pivot point cited based on its 5/15/20 high plus 10 cents after a flat 5-week base when noted - "Subsequent gains above the pivot point backed by at least +40% above average volume may trigger a technical buy signal.
>>> FEATURED STOCK ARTICLE : Formed a Flat Base Perched Within Striking Distance of 52-Week High - 6/18/2020 |
View all notes |
Set NEW NOTE alert |
Company Profile |
SEC
News |
Chart |
Request a new note
C
A
S
I |
NOW
-
NYSE
Servicenow Inc
Computer Sftwr-Enterprse
|
$400.94
|
-1.88
-0.47% |
$409.80
|
1,633,845
77.80% of 50 DAV
50 DAV is 2,100,000
|
$407.99
-1.73%
|
4/30/2020
|
$343.05
|
PP = $363.05
|
|
MB = $381.20
|
Most Recent Note - 6/22/2020 3:40:15 PM
G - Volume totals have generally been cooling while hovering in a tight trading range perched near its all-time high. Recent gains above the pivot point were not backed by the +40% above average volume necessary to clinch a proper technical buy signal. Prior highs in the $362 area define initial support to watch above its 50 DMA line ($359.61).
>>> FEATURED STOCK ARTICLE : Quiet Pullback Below "Max Buy" Level for NOW - 6/4/2020 |
View all notes |
Set NEW NOTE alert |
Company Profile |
SEC
News |
Chart |
Request a new note
C
A
S
I |
TEAM
-
NASDAQ
Atlassian Corp Plc Cl A
Comp Sftwr-Spec Enterprs
|
$182.33
|
-2.23
-1.21% |
$187.71
|
1,729,622
89.39% of 50 DAV
50 DAV is 1,935,000
|
$191.72
-4.90%
|
5/4/2020
|
$159.70
|
PP = $156.22
|
|
MB = $164.03
|
Most Recent Note - 6/22/2020 3:23:23 PM
G - Posting a solid gain today, however it is extended from any sound base. Found support above its 50 DMA line ($168.89). The next important near-term support is the prior low ($163.72 on 6/05/20).
>>> FEATURED STOCK ARTICLE : Positive Reversal Near Prior High and 50 DMA Line - 6/5/2020 |
View all notes |
Set NEW NOTE alert |
Company Profile |
SEC
News |
Chart |
Request a new note
C
A
S
I |
Symbol/Exchange
Company Name
Industry Group |
PRICE |
CHANGE
(%Change) |
Day High |
Volume
(% DAV)
(% 50 day avg vol) |
52 Wk Hi
% From Hi |
Featured
Date |
Price
Featured |
Pivot Featured |
|
Max Buy |
TTD
-
NASDAQ
The Trade Desk Inc Cl A
Comml Svcs-Advertising
|
$410.03
|
+7.23
1.79% |
$421.06
|
1,552,722
72.76% of 50 DAV
50 DAV is 2,134,000
|
$407.48
0.63%
|
6/3/2020
|
$240.61
|
PP = $327.35
|
|
MB = $343.72
|
Most Recent Note - 6/22/2020 5:17:37 PM
G - Hit another new high today with below average volume behind its 7th consecutive gain, getting very extended from any sound base. Prior highs in the $327 area define important near-term support.
>>> FEATURED STOCK ARTICLE : Trade Desk Posts Powerful Gain for New High - 6/3/2020 |
View all notes |
Set NEW NOTE alert |
Company Profile |
SEC
News |
Chart |
Request a new note
C
A
S
I |
DOCU
-
NASDAQ
Docusign Inc
Computer Sftwr-Enterprse
|
$166.80
|
-1.50
-0.89% |
$171.20
|
6,015,288
137.02% of 50 DAV
50 DAV is 4,390,000
|
$169.85
-1.80%
|
6/10/2020
|
$149.73
|
PP = $152.10
|
|
MB = $159.71
|
Most Recent Note - 6/22/2020 3:43:13 PM
G - Hit yet another new all-time high with today's gain backed by lighter volume, getting more extended from the recently noted new base. Prior high ($152 on 6/02/20) defines initial support to watch well above its 50 DMA line.
>>> FEATURED STOCK ARTICLE : Advanced Ascending Base Formed for Strong E-Signature Firm - 6/10/2020 |
View all notes |
Set NEW NOTE alert |
Company Profile |
SEC
News |
Chart |
Request a new note
C
A
S
I |
PING
-
NYSE
Ping Identity Hldg Corp
Computer Sftwr-Security
|
$33.27
|
-0.72
-2.12% |
$35.00
|
1,428,530
108.47% of 50 DAV
50 DAV is 1,317,000
|
$35.36
-5.91%
|
6/1/2020
|
$29.24
|
PP = $29.90
|
|
MB = $31.40
|
Most Recent Note - 6/22/2020 5:16:41 PM
G - Posted a big gain with lighter volume today for its second best ever close. The big gain on 6/18/20 with +71% above average volume triggered a technical buy signal. Prior highs in the $29 area define initial support to watch on pullbacks. See the latest FSU analysis for more details and a new annotated graph.
>>> FEATURED STOCK ARTICLE : Gain for Recent New High Backed by +71% Above Average Volume - 6/22/2020 |
View all notes |
Set NEW NOTE alert |
Company Profile |
SEC
News |
Chart |
Request a new note
C
A
S
I |
AAXN
-
NASDAQ
Axon Enterprise Inc
Security/Sfty
|
$95.54
|
+3.04
3.29% |
$97.74
|
1,912,365
166.15% of 50 DAV
50 DAV is 1,151,000
|
$104.90
-8.92%
|
5/8/2020
|
$84.86
|
PP = $90.20
|
|
MB = $94.71
|
Most Recent Note - 6/23/2020 12:43:49 PM
G - Color code is changed to green after rebounding above its "max buy" level with today's big volume-driven gain. Completed a new Public Offering on 6/17/20. Prior highs in the $90-91 area have acted as support following a powerful breakout. More damaging losses would raise concerns and trigger a technical sell signal.
>>> FEATURED STOCK ARTICLE : Completed New Pubic Offering and Found Support Near Prior High - 6/19/2020 |
View all notes |
Set NEW NOTE alert |
Company Profile |
SEC
News |
Chart |
Request a new note
C
A
S
I |
GDDY
-
NYSE
Godaddy Inc Cl A
Computer Sftwr-Enterprse
|
$82.71
|
+0.30
0.36% |
$84.49
|
1,663,389
122.22% of 50 DAV
50 DAV is 1,361,000
|
$82.66
0.06%
|
6/2/2020
|
$79.62
|
PP = $82.40
|
|
MB = $86.52
|
Most Recent Note - 6/23/2020 5:11:22 PM
Y - Posted an 8th consecutive gain today and hit a new 52-week high but finished near the session low. Subsequent gains above the pivot point backed by at least +40% above average volume are needed to clinch a convincing technical buy signal. It previously met stubborn resistance in the $82-84 area. See the latest FSU analysis for more details and a new annotated graph.
>>> FEATURED STOCK ARTICLE : Hit a New 52-Week High With Today's 8th Consecutive Gain - 6/23/2020 |
View all notes |
Set NEW NOTE alert |
Company Profile |
SEC
News |
Chart |
Request a new note
C
A
S
I |
Symbol/Exchange
Company Name
Industry Group |
PRICE |
CHANGE
(%Change) |
Day High |
Volume
(% DAV)
(% 50 day avg vol) |
52 Wk Hi
% From Hi |
Featured
Date |
Price
Featured |
Pivot Featured |
|
Max Buy |
|
|
|
THESE ARE NOT BUY RECOMMENDATIONS!
Comments contained in the body of this report are technical
opinions only. The material herein has been obtained
from sources believed to be reliable and accurate, however,
its accuracy and completeness cannot be guaranteed.
This site is not an investment advisor, hence it does
not endorse or recommend any securities or other investments.
Any recommendation contained in this report may not
be suitable for all investors and it is not to be deemed
an offer or solicitation on our part with respect to
the purchase or sale of any securities. All trademarks,
service marks and trade names appearing in this report
are the property of their respective owners, and are
likewise used for identification purposes only.
This report is a service available
only to active Paid Premium Members.
You may opt-out of receiving report notifications
at any time. Questions or comments may be submitted
by writing to Premium Membership Services 665 S.E. 10 Street, Suite 201 Deerfield Beach, FL 33441-5634 or by calling 1-800-965-8307
or 954-785-1121.
|
|
|