You are not logged in.
This means you
CAN ONLY VIEW reports that were published prior to Sunday, February 18, 2024.
You
MUST UPGRADE YOUR MEMBERSHIP if you want to see any current reports.
AFTER MARKET UPDATE - FRIDAY, JUNE 21ST, 2019
Previous After Market Report Next After Market Report >>>
|
|
|
|
DOW |
-34.04 |
26,719.13 |
-0.13% |
|
Volume |
2,078,367,800 |
+113% |
|
Volume |
2,868,615,500 |
+36% |
|
NASDAQ |
-19.63 |
8,031.71 |
-0.24% |
|
Advancers |
1,055 |
37% |
|
Advancers |
1,195 |
39% |
|
S&P 500 |
-3.72 |
2,950.46 |
-0.13% |
|
Decliners |
1,787 |
63% |
|
Decliners |
1,875 |
61% |
|
Russell 2000 |
-13.87 |
1,549.63 |
-0.89% |
|
52 Wk Highs |
132 |
|
|
52 Wk Highs |
80 |
|
|
S&P 600 |
-8.09 |
937.05 |
-0.86% |
|
52 Wk Lows |
53 |
|
|
52 Wk Lows |
59 |
|
|
 |
Major Indices Reversed to End Friday's Session Lower
Kenneth J. Gruneisen - Passed the CAN SLIM® Master's Exam
The major averages finished lower Friday, but notched a third straight week of gains. The Dow fell 34 points but ended the week 2.4% higher. The S&P 500 lost 0.1%, but advanced 2.2% for the week. The Nasdaq composite lost 0.2% for the day, but outperformed its peers for the week with a 3.0% gain. The volume totals reported were higher on the NYSE and on the Nasdaq exchange, boosted by quadruple witching, an event where futures and options of stocks and indexes all expire on the same day.. Breadth was negative as decliners led advancers by a 9-5 margin on the NYSE and 3-2 on the Nasdaq exchange. There were 46 high-ranked companies from the Leaders List hit new 52-week highs and were listed on the BreakOuts Page, versus the total of 118 on the prior session. New 52-week highs totals contracted yet outnumbered new 52-week lows on the NYSE and on the Nasdaq exchange. The major indices (M criteria) are in a "confirmed uptrend" under the fact-based system. The Featured Stocks Page provides the most timely analysis on high-ranked leaders. Charts used courtesy of www.stockcharts.com
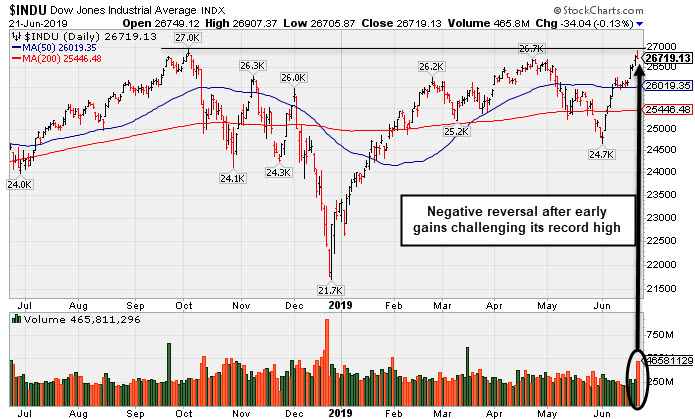
PICTURED: The Dow Jones Industrial Average challenged its record high but erased early gains and ended the session lower. The action was indicative of distributional pressure.
Investors continued to weigh the Federal Reserve’s dovish tilt against renewed geopolitical tensions. The New York Times reported that Washington had come close to launching military strikes against Iran after the country was allegedly responsible for attacking a U.S. drone. The news sent WTI crude up 1% to $57.66, capping its best weekly performance since 2016.
On the data front, a flash reading from Markit showed June manufacturing PMI fell to the lowest reading since 2009, barely hovering in expansionary territory at 50.1. A separate release showed existing home sales rebounded 2.5% in May after declining 0.4% in the prior month. Treasuries weakened, with the yield on the 10-year note up three basis points to 2.06%. In commodities, COMEX gold added 0.5% to $1,399.30, capping a 4% weekly gain.
In corporate news, Altria (MO -4.5%) fell after a former FDA chief casted doubt over that the agency would approve Juul Labs e-cigarettes. Elsewhere, UnitedHealth Group (UNH +1.82%) rose after agreeing to acquire health care payment firm Equian for $3.2 billion.
|
 Kenneth J. Gruneisen started out as a licensed stockbroker in August 1987, a couple of months prior to the historic stock market crash that took the Dow Jones Industrial Average down -22.6% in a single day. He has published daily fact-based fundamental and technical analysis on high-ranked stocks online for two decades. Through FACTBASEDINVESTING.COM, Kenneth provides educational articles, news, market commentary, and other information regarding proven investment systems that work in good times and bad.
Comments contained in the body of this report are technical opinions only and are not necessarily those of Gruneisen Growth Corp. The material herein has been obtained from sources believed to be reliable and accurate, however, its accuracy and completeness cannot be guaranteed. Our firm, employees, and customers may effect transactions, including transactions contrary to any recommendation herein, or have positions in the securities mentioned herein or options with respect thereto. Any recommendation contained in this report may not be suitable for all investors and it is not to be deemed an offer or solicitation on our part with respect to the purchase or sale of any securities. |
|
 |
Retail and Tech Indexes Pulled Back
Kenneth J. Gruneisen - Passed the CAN SLIM® Master's Exam
Commodity-linked groups had a slight positive bias as the Gold & Silver Index ($XAU +0.43%), Oil Services Index ($OSX +0.37%), and the Integrated Oil Index ($XOI +0.44%) each finished modestly higher. The Retail Index ($RLX -0.27%) edged lower while the Bank Index ($BKX +0.17%) and the Broker/Dealer Index ($XBD -0.04%) both were little changed. The tech sector was mixed as the Biotech Index ($BTK +0.38%) edged higher but the Semiconductor Index ($SOX -0.74%) and Networking Index ($NWX -1.28%) both lost ground. Charts courtesy of www.stockcharts.com
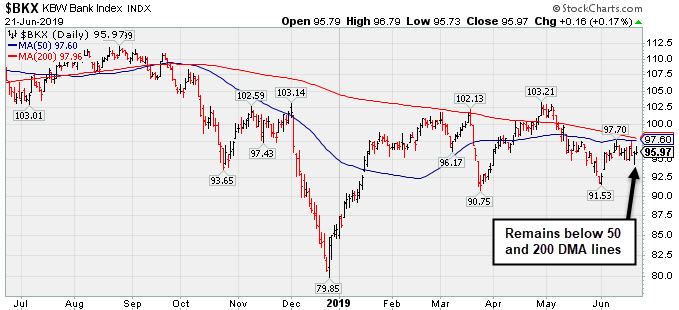 PICTURED: The Bank Index ($BKX +0.17%) has been sputtering below its 50-day and 200-day moving average (DMA) lines.
| Oil Services |
$OSX |
79.28 |
+0.29 |
+0.37% |
-1.64% |
| Integrated Oil |
$XOI |
1,264.79 |
+5.52 |
+0.44% |
+9.12% |
| Semiconductor |
$SOX |
1,410.50 |
-10.53 |
-0.74% |
+22.10% |
| Networking |
$NWX |
573.79 |
-7.46 |
-1.28% |
+17.42% |
| Broker/Dealer |
$XBD |
263.64 |
-0.10 |
-0.04% |
+11.08% |
| Retail |
$RLX |
2,382.72 |
-6.55 |
-0.27% |
+22.10% |
| Gold & Silver |
$XAU |
82.14 |
+0.35 |
+0.43% |
+16.25% |
| Bank |
$BKX |
95.97 |
+0.16 |
+0.17% |
+11.87% |
| Biotech |
$BTK |
4,759.98 |
+17.92 |
+0.38% |
+12.77% |
|
|
|
 |
Undercut 50-Day Moving Average With Volume Behind Losses
Kenneth J. Gruneisen - Passed the CAN SLIM® Master's Exam
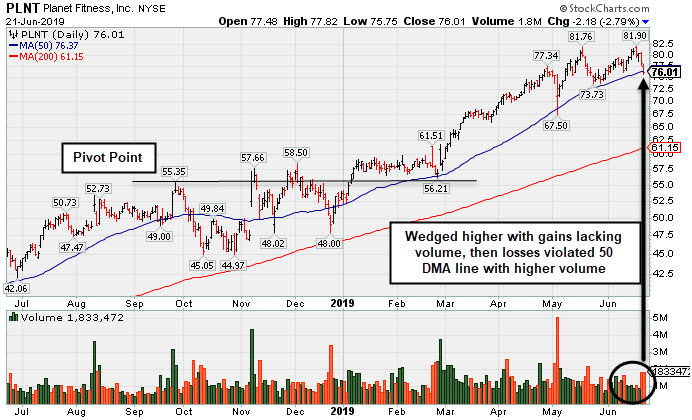
Planet Fitness Inc Cl A (PLNT $76.01 -$2.18 -2.79%) has encountered distributional pressure. Its 2nd consecutive volume-driven loss on Friday violated its 50-day moving average (DMA) line ($76.37) raising concerns and triggering a technical sell signal. The prior low ($73.73 on 5/23/19) defines the next important near-term support top watch. It did not form a sound base and there was a "negative reversal" at its high when last noted with caution following 4 consecutive gains marked by below average volume.
Fundamentals remain strong as it recently reported earnings +30% on +23% sales revenues for its first quarter ended March 31, 2019, marking a 5th consecutive quarterly earnings comparison above the +25% minimum guideline (C criteria). Annual earnings (A criteria) history included a small downturn in FY '15 but has been strong since. Completed its Aug 2015 IPO at $14.06 and completed Secondary Offerings on 6/22/16, 9/26/16, 3/10/17 and 5/08/17.
PLNT found support above its 50 DMA line and wedged higher after last shown in this FSU section on 5/23/19 with an annotated graph under the headline, "Pulling Back From High After Impressive Rally". It traded up as much as +43.4% since first highlighted in yellow with pivot point cited based on its 9/26/18 high plus 10 cents in the 11/07/18 mid-day report (read here).
The number of top-rated funds owning its shares rose from 373 in Dec '17 to 601 in Mar '19, a reassuring sign concerning the I criteria. The current Up/Down Volume Ratio of 1.2 is an unbiased indication its shares have been under slight accumulation over the past 50 days. It has earned a Timeliness Rating of A and Sponsorship Rating of C. Its small supply of 76.9 million shares in the public float can contribute to greater price volatility in the event of institutional buying or selling.
Charts courtesy of www.stockcharts.com
|
|
|
Color Codes Explained :
Y - Better candidates highlighted by our
staff of experts.
G - Previously featured
in past reports as yellow but may no longer be buyable under the
guidelines.
***Last / Change / Volume data in this table is the closing quote data***
Symbol/Exchange
Company Name
Industry Group |
PRICE |
CHANGE
(%Change) |
Day High |
Volume
(% DAV)
(% 50 day avg vol) |
52 Wk Hi
% From Hi |
Featured
Date |
Price
Featured |
Pivot Featured |
|
Max Buy |
 SPSC
-
NASDAQ
SPSC
-
NASDAQ
S P S Commerce Inc
COMPUTER SOFTWARE and SERVICES - Application Software
|
$107.63
|
+0.55
0.51% |
$108.70
|
202,402
135.84% of 50 DAV
50 DAV is 149,000
|
$115.00
-6.41%
|
6/7/2019
|
$107.72
|
PP = $115.10
|
|
MB = $120.86
|
 Most Recent Note - 6/21/2019 6:02:42 PM
Y - Still consolidating above its 50 DMA line ($104.50). Subsequent volume-driven gains above the pivot point are needed to trigger a new (or add-on) technical buy signal. Faces some resistance due to overhead supply up to the $115 level. Recent lows in the $98-99 area define important near-term support to watch. Fundamentals remain strong.
>>> FEATURED STOCK ARTICLE : Base Building Now Above 50-Day Moving Average Line - 6/7/2019 |
View all notes |
Set NEW NOTE alert |
Company Profile |
SEC
News |
Chart |
Request a new note
C
A
S
I |
EPAM
-
NYSE
Epam Systems Inc
COMPUTER SOFTWARE and SERVICES - Information Technology Service
|
$174.08
|
-0.92
-0.53% |
$174.81
|
403,262
82.13% of 50 DAV
50 DAV is 491,000
|
$180.55
-3.58%
|
5/9/2019
|
$169.25
|
PP = $180.55
|
|
MB = $189.58
|
Most Recent Note - 6/21/2019 6:01:53 PM
Y - Remains perched within close striking distance of its 52-week high, consolidating quietly above its 50 DMA line ($172). Subsequent gains above the pivot point backed by at least +40% above average volume may trigger a new (or add-on) technical buy signal.
>>> FEATURED STOCK ARTICLE : Perched Near Pivot Point After a New Flat Base - 6/13/2019 |
View all notes |
Set NEW NOTE alert |
Company Profile |
SEC
News |
Chart |
Request a new note
C
A
S
I |
ENV
-
NYSE
Envestnet Inc
FINANCIAL SERVICES - Diversified Investments
|
$69.23
|
-0.47
-0.67% |
$69.91
|
266,837
91.38% of 50 DAV
50 DAV is 292,000
|
$72.67
-4.73%
|
3/15/2019
|
$66.05
|
PP = $64.90
|
|
MB = $68.15
|
Most Recent Note - 6/18/2019 6:08:28 PM
G - Reversed early gains today and violated its 50 DMA line ($68.95) ending near the session low. Recently reported earnings +5% on +1% sales revenues for the Mar '19 quarter, below the +25% minimum earnings guideline (C criteria). The prior high ($64.80 on 9/14/18) defines important near-term support to watch.
>>> FEATURED STOCK ARTICLE : Rebound Above 50-Day Moving Average Improved Technical Stance - 6/4/2019 |
View all notes |
Set NEW NOTE alert |
Company Profile |
SEC
News |
Chart |
Request a new note
C
A
S
I |
LHCG
-
NASDAQ
L H C Group Inc
HEALTH SERVICES - Home Health Care
|
$114.91
|
+0.69
0.60% |
$116.55
|
420,481
172.33% of 50 DAV
50 DAV is 244,000
|
$122.20
-5.97%
|
4/29/2019
|
$110.94
|
PP = $115.64
|
|
MB = $121.42
|
Most Recent Note - 6/17/2019 5:38:30 PM
Y - Quietly traded back above its pivot point with today's gain backed by lighter than average volume. Its 50 DMA line ($112.40) defines near-term support. Fundamentals remain strong. See the latest FSU analysis for more details and a new annotated graph.
>>> FEATURED STOCK ARTICLE : Prior Gains Lacked Volume; 50-Day Moving Average Defines Support - 6/17/2019 |
View all notes |
Set NEW NOTE alert |
Company Profile |
SEC
News |
Chart |
Request a new note
C
A
S
I |
ENSG
-
NASDAQ
Ensign Group Inc
HEALTH SERVICES - Long-Term Care Facilities
|
$56.52
|
-0.77
-1.34% |
$57.20
|
291,277
96.13% of 50 DAV
50 DAV is 303,000
|
$58.35
-3.14%
|
4/30/2019
|
$51.46
|
PP = $53.30
|
|
MB = $55.97
|
Most Recent Note - 6/18/2019 6:17:12 PM
Y - Touched a new high today but ended the session lower following 4 consecutive gains. Its 50 DMA line ($53.10) and recent low ($52.34 on 5/31/19) define near-term support to watch. Recently reported earnings +22% on +12% sales revenues for the Mar '19 quarter, below the +25% minimum earnings guideline (C criteria), raising fundamental concerns.
>>> FEATURED STOCK ARTICLE : Resilient After Latest Quarterly Report Missed Minimum Guideline - 6/3/2019 |
View all notes |
Set NEW NOTE alert |
Company Profile |
SEC
News |
Chart |
Request a new note
C
A
S
I |
Symbol/Exchange
Company Name
Industry Group |
PRICE |
CHANGE
(%Change) |
Day High |
Volume
(% DAV)
(% 50 day avg vol) |
52 Wk Hi
% From Hi |
Featured
Date |
Price
Featured |
Pivot Featured |
|
Max Buy |
CHDN
-
NASDAQ
Churchill Downs Inc
LEISURE - Gaming Activities
|
$112.25
|
-1.18
-1.04% |
$113.75
|
411,826
125.56% of 50 DAV
50 DAV is 328,000
|
$117.14
-4.17%
|
6/5/2019
|
$108.87
|
PP = $104.96
|
|
MB = $110.21
|
Most Recent Note - 6/17/2019 1:10:38 PM
G - Hovering near its all-time high, holding its ground stubbornly following a recent streak of 8 consecutive gains. Prior highs in the $104 area define initial support to watch on pullbacks. Share price was impacted by a 3:1 split when noted on 1/28/19.
>>> FEATURED STOCK ARTICLE : Consolidating Near 50-Day Moving Average - 6/29/2018 |
View all notes |
Set NEW NOTE alert |
Company Profile |
SEC
News |
Chart |
Request a new note
C
A
S
I |
WWD
-
NASDAQ
Woodward Inc
MANUFACTURING - Diversified Machinery
|
$112.24
|
-2.24
-1.96% |
$114.80
|
558,669
129.02% of 50 DAV
50 DAV is 433,000
|
$116.46
-3.62%
|
6/18/2019
|
$112.34
|
PP = $114.65
|
|
MB = $120.38
|
Most Recent Note - 6/18/2019 6:13:16 PM
Y - Color code was changed to yellow with pivot point cited based on its 4/30/19 high plus 10 cents. Perched near its all-time high, however, recent gains lacked great volume conviction. Subsequent gains above the pivot point backed by at least +40% above average volume may clinch a convincing technical buy signal. Reported earnings +71% on +38% sales revenues for the quarter ended March 31, 2019 versus the year ago period, its 5th consecutive quarterly earnings increase above the +25% minimum earnings (C criteria) guideline. Annual earnings history has been steady. See the latest FSU analysis for more details and a new annotated graph.
>>> FEATURED STOCK ARTICLE : High Ranked Industrial Firm Perched Near All-Time High - 6/18/2019 |
View all notes |
Set NEW NOTE alert |
Company Profile |
SEC
News |
Chart |
Request a new note
C
A
S
I |
LULU
-
NASDAQ
Lululemon Athletica
MANUFACTURING - Textile Manufacturing
|
$181.87
|
-4.63
-2.48% |
$184.80
|
4,015,745
193.81% of 50 DAV
50 DAV is 2,072,000
|
$190.52
-4.54%
|
6/13/2019
|
$174.48
|
PP = $179.60
|
|
MB = $188.58
|
Most Recent Note - 6/21/2019 12:32:34 PM
Y - Pulling back from its all-time high, slumping toward the prior high ($179.50 on 4/24/19) which defines initial support to watch The 50 DMA line ($174) and prior low ($160.88 on 5/29/19) define the next important support. Reported Apr '19 quarterly earnings +35% on +20% sales revenues versus the ear ago period.
>>> FEATURED STOCK ARTICLE : Perched Near High Following Another Strong Earnings Report - 6/14/2019 |
View all notes |
Set NEW NOTE alert |
Company Profile |
SEC
News |
Chart |
Request a new note
C
A
S
I |
ULTA
-
NASDAQ
Ulta Beauty Inc
SPECIALTY RETAIL - Specialty Retail, Other
|
$355.81
|
-2.53
-0.71% |
$360.47
|
705,571
96.13% of 50 DAV
50 DAV is 734,000
|
$365.54
-2.66%
|
3/15/2019
|
$341.27
|
PP = $322.59
|
|
MB = $338.72
|
Most Recent Note - 6/19/2019 5:02:30 PM
G - Posted a solid gain today with below average volume as it challenged it all-time high. Recent rebound above its 50 DMA line ($344) helped its outlook to improve. Reported earnings +17% on +13% sales revenues for the Apr '19 quarter, below the +25% minimum earnings guideline (C criteria), raising fundamental concerns.
>>> FEATURED STOCK ARTICLE : Sputtering Below 50-Day Moving Average Following Sub Par Earnings - 6/6/2019 |
View all notes |
Set NEW NOTE alert |
Company Profile |
SEC
News |
Chart |
Request a new note
C
A
S
I |
ESNT
-
NYSE
Essent Group Ltd
Finance-MrtgandRel Svc
|
$47.51
|
-1.76
-3.57% |
$49.26
|
1,050,080
172.71% of 50 DAV
50 DAV is 608,000
|
$50.51
-5.94%
|
3/18/2019
|
$45.84
|
PP = $45.06
|
|
MB = $47.31
|
Most Recent Note - 6/21/2019 6:12:18 PM
G - Pulled back for big loss today on above average volume after wedging higher this week while challenging its high. Testing its 50 DMA line ($47.41) which has acted as support in recent months. Recently reported earnings +15% on +20% sales revenues for the Mar '19 quarter, below the +25% minimum earnings guideline (C criteria), raising fundamental concerns.
>>> FEATURED STOCK ARTICLE : Still Hovering Not Far From 52-Week High - 6/5/2019 |
View all notes |
Set NEW NOTE alert |
Company Profile |
SEC
News |
Chart |
Request a new note
C
A
S
I |
Symbol/Exchange
Company Name
Industry Group |
PRICE |
CHANGE
(%Change) |
Day High |
Volume
(% DAV)
(% 50 day avg vol) |
52 Wk Hi
% From Hi |
Featured
Date |
Price
Featured |
Pivot Featured |
|
Max Buy |
NOW
-
NYSE
Servicenow Inc
Computer Sftwr-Enterprse
|
$285.74
|
-3.06
-1.06% |
$290.84
|
1,617,059
93.36% of 50 DAV
50 DAV is 1,732,000
|
$292.98
-2.47%
|
4/22/2019
|
$242.64
|
PP = $251.75
|
|
MB = $264.34
|
Most Recent Note - 6/18/2019 6:23:50 PM
G - It did not form a sound base yet hit a new all-time high with today's volume-driven gain. Its 50 DMA line ($262) and prior high ($251.65 on 3/21/19) define near-term support to watch on pullbacks. Recently reported earnings +20% on +34% sales revenues for the Mar '19 quarter, below the +25% minimum earnings guideline (C criteria), raising fundamental concerns.
>>> FEATURED STOCK ARTICLE : Leader Consolidating Above 50-Day Moving Average Line - 5/29/2019 |
View all notes |
Set NEW NOTE alert |
Company Profile |
SEC
News |
Chart |
Request a new note
C
A
S
I |
QLYS
-
NASDAQ
Qualys Inc
Computer Sftwr-Security
|
$87.26
|
-2.48
-2.76% |
$89.75
|
626,761
195.68% of 50 DAV
50 DAV is 320,300
|
$98.30
-11.23%
|
5/23/2019
|
$90.43
|
PP = $98.40
|
|
MB = $103.32
|
Most Recent Note - 6/21/2019 6:14:10 PM
G - Pulled back today with higher volume while consolidating near its 50 DMA line ($86.97) after finding prompt support near its 200 DMA line. It is only -11.2% off its 52-week high, however, its Relative Strength Rating of 74 is below the 80+ minimum guideline for buy candidates. Met stubborn resistance in the $97-98 area. Reported earnings +36% on +16% sales revenues for the Mar '19 quarter, continuing its strong earnings history.
>>> FEATURED STOCK ARTICLE : Encountering Distributional Pressure in Recent Weeks - 6/11/2019 |
View all notes |
Set NEW NOTE alert |
Company Profile |
SEC
News |
Chart |
Request a new note
C
A
S
I |
VEEV
-
NYSE
Veeva Systems Inc Cl A
Computer Sftwr-Medical
|
$168.93
|
-2.22
-1.30% |
$171.20
|
1,610,106
118.13% of 50 DAV
50 DAV is 1,363,000
|
$173.65
-2.72%
|
5/30/2019
|
$154.32
|
PP = $145.80
|
|
MB = $153.09
|
Most Recent Note - 6/17/2019 1:21:23 PM
G -Very extended from any sound base and perched near its all-time high, holding its ground after 7 consecutive gains marked by volume. Reported earnings +52% on +25% sales revenues for the Apr '19 quarter, marking its 5th strong quarter with earnings above the +25% minimum guideline (C criteria).
>>> FEATURED STOCK ARTICLE : Big Volume-Driven Gain for New High Following Earnings News - 5/30/2019 |
View all notes |
Set NEW NOTE alert |
Company Profile |
SEC
News |
Chart |
Request a new note
C
A
S
I |
PAYC
-
NYSE
Paycom Software Inc
COMPUTER SOFTWARE and SERVICES - Application Software
|
$228.25
|
-1.90
-0.83% |
$231.19
|
1,106,055
146.89% of 50 DAV
50 DAV is 753,000
|
$233.43
-2.22%
|
2/6/2019
|
$171.66
|
PP = $164.18
|
|
MB = $172.39
|
Most Recent Note - 6/17/2019 1:22:37 PM
G - Extended from any sound base, and there was a "negative reversal" on 6/10/19 after hitting a new all-time high. Its 50 DMA line ($203) defines near-term support to watch above the recent low ($194.84 on 6/03/19). Reported earnings +25% on +30% sales revenues for the Mar '19 quarter.
>>> FEATURED STOCK ARTICLE : Posted Volume-Driven Gain While Hovering Near All-Time High - 5/31/2019 |
View all notes |
Set NEW NOTE alert |
Company Profile |
SEC
News |
Chart |
Request a new note
C
A
S
I |
PYPL
-
NASDAQ
Paypal Holdings Inc
Finance-CrdtCard/PmtPr
|
$116.21
|
-2.58
-2.17% |
$117.28
|
10,215,119
173.70% of 50 DAV
50 DAV is 5,881,000
|
$119.95
-3.12%
|
1/24/2019
|
$92.56
|
PP = $93.80
|
|
MB = $98.49
|
Most Recent Note - 6/21/2019 12:42:48 PM
G - Gapped down today retreating from a new all-time high after quiet gains. Did not form a sound base, yet promptly rebounded after violating its 50 DMA line and prior low ($106.52) on 6/03/19. Recently reported earnings +37% on +12% sales revenues for the Mar '19 quarter, continuing its strong earnings track record.
>>> FEATURED STOCK ARTICLE : Popular Payments Firm Extended From Any Sound Base - 6/19/2019 |
View all notes |
Set NEW NOTE alert |
Company Profile |
SEC
News |
Chart |
Request a new note
C
A
S
I |
Symbol/Exchange
Company Name
Industry Group |
PRICE |
CHANGE
(%Change) |
Day High |
Volume
(% DAV)
(% 50 day avg vol) |
52 Wk Hi
% From Hi |
Featured
Date |
Price
Featured |
Pivot Featured |
|
Max Buy |
PLNT
-
NYSE
Planet Fitness Inc Cl A
Leisure-Services
|
$76.01
|
-2.18
-2.79% |
$77.82
|
1,792,521
131.80% of 50 DAV
50 DAV is 1,360,000
|
$81.90
-7.19%
|
11/7/2018
|
$57.10
|
PP = $55.45
|
|
MB = $58.22
|
Most Recent Note - 6/21/2019 6:06:11 PM
G - Violated its 50 DMA line ($76.37) today with another volume-driven loss triggering a technical sell signal. The prior low ($73.73 on 5/23/19) defines the next important near-term support to watch. Fundamentals remain strong. See the latest FSU analysis for more details and a new annotated graph.
>>> FEATURED STOCK ARTICLE : Undercut 50-Day Moving Average With Volume Behind Losses - 6/21/2019 |
View all notes |
Set NEW NOTE alert |
Company Profile |
SEC
News |
Chart |
Request a new note
C
A
S
I |
BLD
-
NYSE
Topbuild Corp
Bldg-Constr Prds/Misc
|
$77.67
|
-1.23
-1.56% |
$78.65
|
436,272
130.62% of 50 DAV
50 DAV is 334,000
|
$86.96
-10.68%
|
5/17/2019
|
$82.19
|
PP = $87.31
|
|
MB = $91.68
|
Most Recent Note - 6/17/2019 5:39:52 PM
Y - Pulled back today with slightly higher volume indicative of distributional pressure. Remains within striking distance of its 52-week high. Subsequent gains above the pivot point backed by at least +40% above average volume may trigger a technical buy signal. Fundamentals remain strong.
>>> FEATURED STOCK ARTICLE : Found Support at 50-Day Moving Averge Line - 6/20/2019 |
View all notes |
Set NEW NOTE alert |
Company Profile |
SEC
News |
Chart |
Request a new note
C
A
S
I |
TEAM
-
NASDAQ
Atlassian Corp Plc Cl A
Comp Sftwr-Spec Enterprs
|
$132.87
|
-2.18
-1.61% |
$134.53
|
965,834
53.99% of 50 DAV
50 DAV is 1,789,000
|
$137.78
-3.56%
|
5/24/2019
|
$129.52
|
PP = $132.09
|
|
MB = $138.69
|
Most Recent Note - 6/19/2019 5:04:00 PM
Y - Posted a gain today with below average volume for its second best close ever. The 50 DMA line ($120) and prior low ($115.87 on 6/03/19) define important neat-term support to watch. Reported earnings +133% on +38% sales revenues for the Mar '19 quarter, continuing its strong earnings track record.
>>> FEATURED STOCK ARTICLE : Perched Near All-Time High After "3-Weeks Tight" - 5/24/2019 |
View all notes |
Set NEW NOTE alert |
Company Profile |
SEC
News |
Chart |
Request a new note
C
A
S
I |
UPLD
-
NASDAQ
Upland Software Inc
Computer Sftwr-Enterprse
|
$47.79
|
-3.43
-6.70% |
$50.95
|
615,106
116.06% of 50 DAV
50 DAV is 530,000
|
$54.87
-12.90%
|
6/10/2019
|
$53.30
|
PP = $50.74
|
|
MB = $53.28
|
Most Recent Note - 6/21/2019 6:08:35 PM
Y - Pulled back abruptly today nearly testing its 50 DMA line ($46.57) which defines near-term support to watch. Recent losses completely negated the prior breakout from an advanced ascending base. Completed a new Public Offering on 5/08/19. Quarterly comparisons through Mar '19 have shown impressive sales revenues growth and greatly improved earnings increases above the +25% minimum guideline (C criteria).
>>> FEATURED STOCK ARTICLE : Rose From an Advanced Ascending Base - 6/10/2019 |
View all notes |
Set NEW NOTE alert |
Company Profile |
SEC
News |
Chart |
Request a new note
C
A
S
I |
GLOB
-
NYSE
Globant SA
Computer-Tech Services
|
$105.01
|
+1.48
1.43% |
$105.33
|
747,250
189.18% of 50 DAV
50 DAV is 395,000
|
$104.25
0.73%
|
2/15/2019
|
$69.35
|
PP = $70.00
|
|
MB = $73.50
|
Most Recent Note - 6/17/2019 5:41:53 PM
G - Posted a small gain today with below average volume for a best-ever close. Very extended from any sound base. Its 50 DMA line ($85.76) defines important support where a violation would raise concerns and trigger a technical sell signal. Fundamentals remain strong.
>>> FEATURED STOCK ARTICLE : Posted Big Gain for Another New High Close - 6/12/2019 |
View all notes |
Set NEW NOTE alert |
Company Profile |
SEC
News |
Chart |
Request a new note
C
A
S
I |
Symbol/Exchange
Company Name
Industry Group |
PRICE |
CHANGE
(%Change) |
Day High |
Volume
(% DAV)
(% 50 day avg vol) |
52 Wk Hi
% From Hi |
Featured
Date |
Price
Featured |
Pivot Featured |
|
Max Buy |
|
|
|
THESE ARE NOT BUY RECOMMENDATIONS!
Comments contained in the body of this report are technical
opinions only. The material herein has been obtained
from sources believed to be reliable and accurate, however,
its accuracy and completeness cannot be guaranteed.
This site is not an investment advisor, hence it does
not endorse or recommend any securities or other investments.
Any recommendation contained in this report may not
be suitable for all investors and it is not to be deemed
an offer or solicitation on our part with respect to
the purchase or sale of any securities. All trademarks,
service marks and trade names appearing in this report
are the property of their respective owners, and are
likewise used for identification purposes only.
This report is a service available
only to active Paid Premium Members.
You may opt-out of receiving report notifications
at any time. Questions or comments may be submitted
by writing to Premium Membership Services 665 S.E. 10 Street, Suite 201 Deerfield Beach, FL 33441-5634 or by calling 1-800-965-8307
or 954-785-1121.
|
|
|

