You are not logged in.
This means you
CAN ONLY VIEW reports that were published prior to Tuesday, February 20, 2024.
You
MUST UPGRADE YOUR MEMBERSHIP if you want to see any current reports.
AFTER MARKET UPDATE - WEDNESDAY, JUNE 15TH, 2022
Previous After Market Report Next After Market Report >>>
|
|
|
|
DOW |
+303.70 |
30,668.53 |
+1.00% |
|
Volume |
1,352,213,060 |
+21% |
|
Volume |
5,324,645,000 |
+11% |
|
NASDAQ |
+270.81 |
11,099.15 |
+2.50% |
|
Advancers |
2,230 |
73% |
|
Advancers |
2,777 |
69% |
|
S&P 500 |
+54.51 |
3,789.99 |
+1.46% |
|
Decliners |
822 |
27% |
|
Decliners |
1,274 |
31% |
|
Russell 2000 |
+23.31 |
1,731.14 |
+1.36% |
|
52 Wk Highs |
5 |
|
|
52 Wk Highs |
21 |
|
|
S&P 600 |
+9.92 |
1,143.40 |
+0.88% |
|
52 Wk Lows |
337 |
|
|
52 Wk Lows |
381 |
|
|
The market remains in a correction (M criteria). Discipline and patience remain paramount until a new rally with confirmation marked by a solid follow-through day.
|
 |
Major Indices Posted Gains But Still Lack Leadership
Kenneth J. Gruneisen - Passed the CAN SLIM® Master's Exam
The Dow and S&P 500 snapped a five-day losing streak, with the benchmarks jumping 303 points and 1.5%, respectively. The tech-heavy Nasdaq Composite surged 2.5% as recently beleaguered growth-related stocks outperformed. Volume totals reported were higher than the prior session on the NYSE and on the Nasdaq exchange. Breadth was positive as advancers led decliners by an 11-4 margin on the NYSE and by 2-1 on the Nasdaq exchange. There were 3 high-ranked companies from the Leaders List that hit new 52-week highs and were listed on the BreakOuts Page, matching the total of 3 on the prior session. New 52-week lows totals contracted yet still solidly outnumbered new 52-week highs on the NYSE and on the Nasdaq exchange. The major indices have been in a noted market correction (M criteria).
Chart courtesy of www.stockcharts.com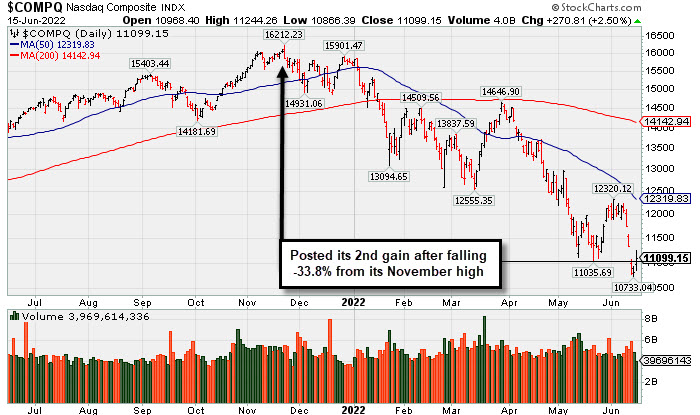 PICTURED: The Nasdaq Composite index posted its 2nd consecutive gain after slumping as much as -33.8% from its November high. Recent losses violated the May 20th lows for all 3 major market averages.
U.S. equities staged a relief rally Wednesday following the Federal Reserve’s (Fed) highly anticipated policy decision. Treasuries strengthened, with the 10-year note yield shedding 17 basis points (0.17%) to 3.30%, though remains 0.15% higher for the week. The more Fed-sensitive two-year note yield sank 20 basis points (0.20%) to 3.22%, trimming its week-to-date rise to 0.16%.
The Fed raised their benchmark rate by 75 basis points (0.75%) to a range of 1.50%-1.75%, signaling the U.S. central bank’s commitment to combat high inflation. The move was the largest hike since 1994, and came in-line with expectations that had reset earlier in the week following last Friday’s hotter-than-expected inflation data. The decision had one dissenting vote from Kansas City Fed President Esther George who favored a 0.50% rise that had previously been telegraphed. Risk sentiment was buoyed after Fed Chair Jerome Powell said that outsized rate hikes should be uncommon, though he left optionality for a 0.50% or 0.75% rate hike next month dependent on incoming data. The Fed’s so-called dot plot implied another 1.75% increase by year-end. A gauge of the U.S. dollar slid 0.7%, its biggest one-day drop in nearly a month.
Ten of 11 S&P 500 sectors finished in positive territory, with Consumer Discretionary outperforming. Energy was the lone laggard amid a 2.5% drop in oil prices. On the data front, retail sales unexpectedly fell 0.3% in May after rising 0.7% in April.
|
 Kenneth J. Gruneisen started out as a licensed stockbroker in August 1987, a couple of months prior to the historic stock market crash that took the Dow Jones Industrial Average down -22.6% in a single day. He has published daily fact-based fundamental and technical analysis on high-ranked stocks online for two decades. Through FACTBASEDINVESTING.COM, Kenneth provides educational articles, news, market commentary, and other information regarding proven investment systems that work in good times and bad.
Comments contained in the body of this report are technical opinions only and are not necessarily those of Gruneisen Growth Corp. The material herein has been obtained from sources believed to be reliable and accurate, however, its accuracy and completeness cannot be guaranteed. Our firm, employees, and customers may effect transactions, including transactions contrary to any recommendation herein, or have positions in the securities mentioned herein or options with respect thereto. Any recommendation contained in this report may not be suitable for all investors and it is not to be deemed an offer or solicitation on our part with respect to the purchase or sale of any securities. |
|
 |
Retail, Tech, Gold & Silver, and Financial Indexes Rose
Kenneth J. Gruneisen - Passed the CAN SLIM® Master's Exam
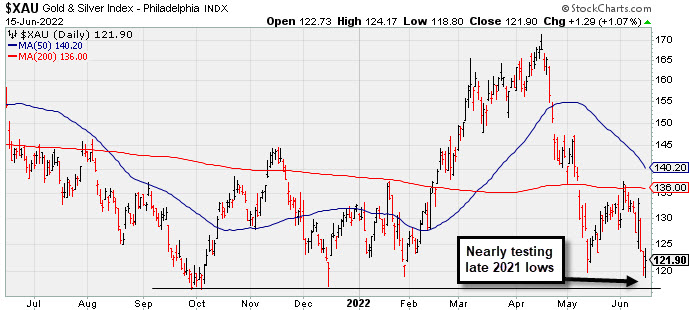
A solid gain from the Retail Index ($RLX +3.06%) helped give the major averages a boost. The tech sector saw unanimous gains from the Biotech Index ($BTK +2.62%), Semiconductor Index ($SOX +1.77%), and Networking Index ($NWX +2.78%). The Broker/Dealer Index ($XBD +1.14%) and Bank Index ($BKX +1.58%) each posted smaller gains. Meanwhile, commodity-linked groups were mixed as the Oil Services Index ($OSX -1.58%) and Integrated Oil Index ($XOI -1.94%) both fell as the Gold & Silver Index ($XAU +1.07%) notched a gain.
PICTURED: The Gold & Silver Index ($XAU +1.07%) is nearly testing its late 2021 low.
| Oil Services |
$OSX |
73.43 |
-1.18 |
-1.58% |
+39.28% |
| Integrated Oil |
$XOI |
1,714.00 |
-33.85 |
-1.94% |
+45.48% |
| Semiconductor |
$SOX |
2,737.54 |
+47.66 |
+1.77% |
-30.63% |
| Networking |
$NWX |
698.62 |
+18.88 |
+2.78% |
-28.06% |
| Broker/Dealer |
$XBD |
378.41 |
+4.27 |
+1.14% |
-22.27% |
| Retail |
$RLX |
2,883.16 |
+85.52 |
+3.06% |
-31.78% |
| Gold & Silver |
$XAU |
121.90 |
+1.29 |
+1.07% |
-7.97% |
| Bank |
$BKX |
102.52 |
+1.59 |
+1.58% |
-22.46% |
| Biotech |
$BTK |
4,318.78 |
+110.36 |
+2.62% |
-21.74% |
|
|
|
 |
Featured Stocks
Kenneth J. Gruneisen - Passed the CAN SLIM® Master's Exam
|
|
|
Color Codes Explained :
Y - Better candidates highlighted by our
staff of experts.
G - Previously featured
in past reports as yellow but may no longer be buyable under the
guidelines.
***Last / Change / Volume data in this table is the closing quote data***
Symbol/Exchange
Company Name
Industry Group |
PRICE |
CHANGE
(%Change) |
Day High |
Volume
(% DAV)
(% 50 day avg vol) |
52 Wk Hi
% From Hi |
Featured
Date |
Price
Featured |
Pivot Featured |
|
Max Buy |
 PAG
-
NYSE
PAG
-
NYSE
Penske Automotive Grp
Retail/Whlsle-Automobile
|
$114.04
|
+0.98
0.87% |
$117.36
|
432,781
121.91% of 50 DAV
50 DAV is 355,000
|
$123.60
-7.73%
|
5/13/2022
|
$114.88
|
PP = $114.57
|
|
MB = $120.30
|
 Most Recent Note - 6/15/2022 5:32:01 PM
Y - Posted another gain today with above average volume. Its slump below prior highs in the $114 area raised concerns. Its 50 DMA line ($107.72) defines important near term support to watch.
>>> FEATURED STOCK ARTICLE : Penske Perched at High With No Resistance Remaining - 6/2/2022 |
View all notes |
Set NEW NOTE alert |
Company Profile |
SEC
News |
Chart |
Request a new note
C
A
S
I |
LLY
-
NYSE
Eli Lilly & Co
Medical-Diversified
|
$292.99
|
+2.20
0.76% |
$296.34
|
1,969,378
65.82% of 50 DAV
50 DAV is 2,992,000
|
$324.08
-9.59%
|
5/16/2022
|
$302.46
|
PP = $314.10
|
|
MB = $329.81
|
Most Recent Note - 6/14/2022 5:13:04 PM
G - Suffered a 4th consecutive loss today with below average volume while slumping further below its 50 DMA line ($298). A rebound above the 50 DMA line is needed for its outlook to improve. Subsequent gains above the pivot point backed by at least +40% above average volume may help clinch a convincing technical buy signal. Fundamentals remain strong.
>>> FEATURED STOCK ARTICLE : Encountering Distributional Pressure After Reaching New Highs - 6/6/2022 |
View all notes |
Set NEW NOTE alert |
Company Profile |
SEC
News |
Chart |
Request a new note
C
A
S
I |
WCC
-
NYSE
Wesco International Inc
WHOLESALE - Electronics Wholesale
|
$120.68
|
+0.47
0.39% |
$124.03
|
552,307
110.02% of 50 DAV
50 DAV is 502,000
|
$144.43
-16.44%
|
6/1/2022
|
$128.79
|
PP = $139.10
|
|
MB = $146.06
|
Most Recent Note - 6/14/2022 5:15:17 PM
G - Today's 5th consecutive loss was backed by lighter volume. Prior losses violated its 50 DMA line and 200 DMA lines triggering a technical sell signal and its color code was changed to green. Fundamentals remain strong. A rebound above the 50 DMA line ($126) is needed for its outlook to improve.
>>> FEATURED STOCK ARTICLE : Big Volume-Driven Gain Helped Technical Stance Improve - 6/1/2022 |
View all notes |
Set NEW NOTE alert |
Company Profile |
SEC
News |
Chart |
Request a new note
C
A
S
I |
COKE
-
NASDAQ
Coca-Cola Consolidated
FOOD and BEVERAGE - Beverages - Soft Drinks
|
$551.00
|
-18.92
-3.32% |
$585.39
|
51,122
124.69% of 50 DAV
50 DAV is 41,000
|
$656.11
-16.02%
|
6/6/2022
|
$629.97
|
PP = $637.49
|
|
MB = $669.36
|
Most Recent Note - 6/15/2022 5:31:13 PM
G - There was a "negative reversal" today as another loss with above average volume raised concerns. Prior mid-day reports repeatedly noted - "A strong gain and close above the pivot point backed by at least +40% above average volume may trigger a technical buy signal."
>>> FEATURED STOCK ARTICLE : Paused After Hitting New High With Volume-Driven Gains - 6/7/2022 |
View all notes |
Set NEW NOTE alert |
Company Profile |
SEC
News |
Chart |
Request a new note
C
A
S
I |
|
|
|
THESE ARE NOT BUY RECOMMENDATIONS!
Comments contained in the body of this report are technical
opinions only. The material herein has been obtained
from sources believed to be reliable and accurate, however,
its accuracy and completeness cannot be guaranteed.
This site is not an investment advisor, hence it does
not endorse or recommend any securities or other investments.
Any recommendation contained in this report may not
be suitable for all investors and it is not to be deemed
an offer or solicitation on our part with respect to
the purchase or sale of any securities. All trademarks,
service marks and trade names appearing in this report
are the property of their respective owners, and are
likewise used for identification purposes only.
This report is a service available
only to active Paid Premium Members.
You may opt-out of receiving report notifications
at any time. Questions or comments may be submitted
by writing to Premium Membership Services 665 S.E. 10 Street, Suite 201 Deerfield Beach, FL 33441-5634 or by calling 1-800-965-8307
or 954-785-1121.
|
|
|