You are not logged in.
This means you
CAN ONLY VIEW reports that were published prior to Sunday, February 25, 2024.
You
MUST UPGRADE YOUR MEMBERSHIP if you want to see any current reports.
AFTER MARKET UPDATE - MONDAY, JUNE 15TH, 2020
Previous After Market Report Next After Market Report >>>
|
|
|
|
DOW |
+157.62 |
25,763.16 |
+0.62% |
|
Volume |
1,222,193,886 |
+5% |
|
Volume |
4,401,466,600 |
+1% |
|
NASDAQ |
+137.21 |
9,726.02 |
+1.43% |
|
Advancers |
1,925 |
67% |
|
Advancers |
2,387 |
72% |
|
S&P 500 |
+25.28 |
3,066.59 |
+0.83% |
|
Decliners |
943 |
33% |
|
Decliners |
930 |
28% |
|
Russell 2000 |
+31.92 |
1,419.61 |
+2.30% |
|
52 Wk Highs |
27 |
|
|
52 Wk Highs |
62 |
|
|
S&P 600 |
+16.80 |
829.29 |
+2.07% |
|
52 Wk Lows |
6 |
|
|
52 Wk Lows |
11 |
|
|
 |
Major Indices Shook Off Early Weakness to Close Higher
Kenneth J. Gruneisen - Passed the CAN SLIM® Master's Exam
The Dow climbed 157 points, erasing an early session loss of more than 760 points. The S&P 500 advanced 0.8%, reversing course from a 2.5% drop. The Nasdaq Composite added 1.4%. Advancers led decliners by more than a 2-1 margin on the NYSE and on the Nasdaq exchange. The reported volume totals were higher than the prior session on the NYSE and on the Nasdaq exchange, indicative of a slight increase in institutional buying demand. There were 18 high-ranked companies from the Leaders List that hit new 52-week highs and were listed on the BreakOuts Page, versus 6 on the prior session. New 52-week highs totals expanded and outnumbered new 52-week lows totals on the NYSE and on the Nasdaq exchange. The major indices remain in a confirmed uptrend (M criteria). Any sustainable rally requires a healthy crop of new leaders, so it will be important to see the new highs totals improve. Charts used courtesy of www.stockcharts.com
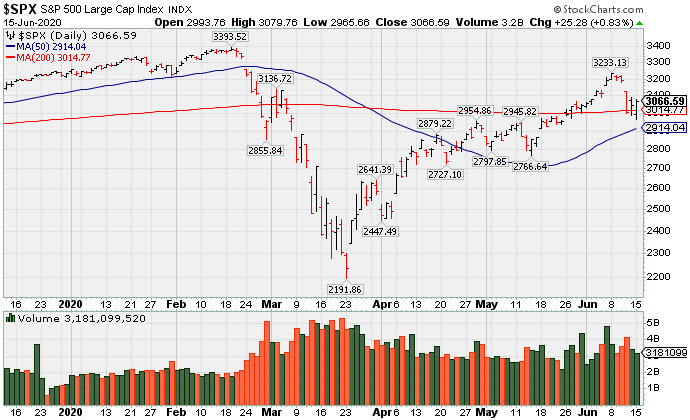
PICTURED: The S&P 500 Index is -9.6% off its record high.
U.S. equities finished higher on Monday as additional stimulus support from the Federal Reserve overshadowed worries surrounding a resurgence in COVID-19 infections. The central bank announced plans to purchase a broad portfolio of individual corporate bonds in the secondary market. Stocks had been pressured in early trading after portions of Beijing closed following a spike in coronavirus cases tied to the largest wholesale food market in Asia. This followed the worst week for U.S. equities since March as a downbeat economic outlook from the Federal Reserve and a rise in reported coronavirus cases weighed on the mood.
All 11 S&P 500 sectors ended in positive territory with Financials pacing gains. In corporate news, BP (BP -1.58%) fell after indicating plans to writedown up to $17.5 billion of assets this quarter following sizeable reductions to its long-term outlook for oil prices. WTI crude rebounded to finish more than 2% higher despite the downbeat forecasts. Elsewhere, Moderna (MRNA +7.37%) rose following reports that Israel was in advanced discussions with the drugmaker to purchase its coronavirus vaccine.
On the data front, industrial production in China increased the most since December last month, but retail sales declined for a fourth-consecutive month. In the U.S., a gauge of manufacturing activity in the New York State region improved more than projected this month. Treasuries finished little changed, with the yield on the 10-year note steady at 0.71%. |
 Kenneth J. Gruneisen started out as a licensed stockbroker in August 1987, a couple of months prior to the historic stock market crash that took the Dow Jones Industrial Average down -22.6% in a single day. He has published daily fact-based fundamental and technical analysis on high-ranked stocks online for two decades. Through FACTBASEDINVESTING.COM, Kenneth provides educational articles, news, market commentary, and other information regarding proven investment systems that work in good times and bad.
Comments contained in the body of this report are technical opinions only and are not necessarily those of Gruneisen Growth Corp. The material herein has been obtained from sources believed to be reliable and accurate, however, its accuracy and completeness cannot be guaranteed. Our firm, employees, and customers may effect transactions, including transactions contrary to any recommendation herein, or have positions in the securities mentioned herein or options with respect thereto. Any recommendation contained in this report may not be suitable for all investors and it is not to be deemed an offer or solicitation on our part with respect to the purchase or sale of any securities. |
|
 |
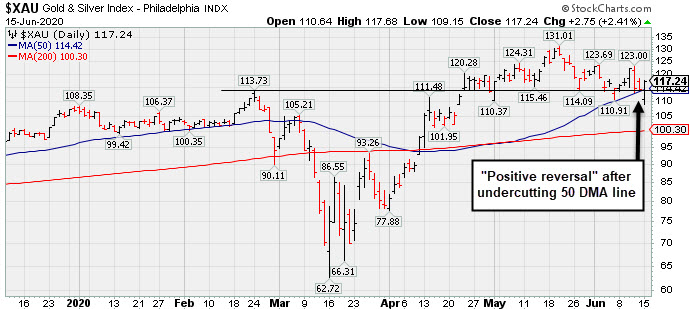
Gold & Silver Index Managed a "Positive Reversal"
Kenneth J. Gruneisen - Passed the CAN SLIM® Master's Exam
The Bank Index ($BKX +1.46%) outpaced the Broker/Dealer Index ($XBD +0.99%) as financials helped underpin the market rebound. The Retail Index ($RLX +0.90%) also rose. The tech sector had a positive bias as the Biotech Index ($BTK +1.02%) and Semiconductor Index ($SOX +1.43%) both rose while the Networking Index ($NWX +0.09%) finished flat. Energy-linked groups were mixed as the Oil Services Index ($OSX +0.24%) and the Integrated Oil Index ($XOI -0.19%) both ended little changed.
PICTURED: The Gold & Silver Index ($XAU +2.41%) was a standout gainer as it managed a "positive reversal" after early weakness undercut its 50-day moving average (DMA) line.
| Oil Services |
$OSX |
35.88 |
+0.09 |
+0.25% |
-54.17% |
| Integrated Oil |
$XOI |
817.72 |
-1.52 |
-0.19% |
-35.64% |
| Semiconductor |
$SOX |
1,931.33 |
+27.48 |
+1.44% |
+4.42% |
| Networking |
$NWX |
550.00 |
+0.51 |
+0.09% |
-5.73% |
| Broker/Dealer |
$XBD |
273.72 |
+2.69 |
+0.99% |
-5.74% |
| Retail |
$RLX |
2,861.03 |
+25.62 |
+0.90% |
+16.81% |
| Gold & Silver |
$XAU |
117.24 |
+2.76 |
+2.41% |
+9.65% |
| Bank |
$BKX |
79.08 |
+1.14 |
+1.46% |
-30.24% |
| Biotech |
$BTK |
5,499.12 |
+55.63 |
+1.02% |
+8.52% |
|
|
|
 |
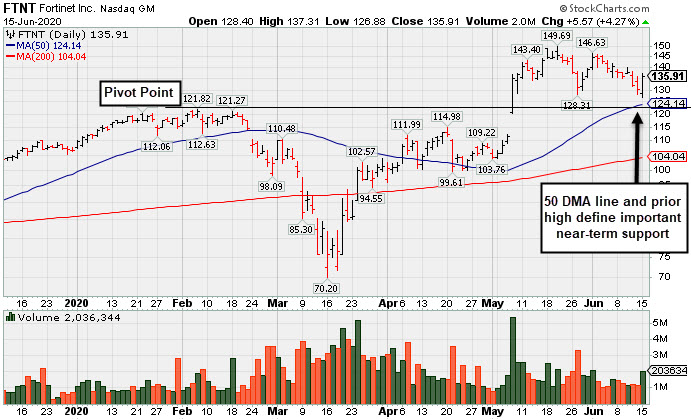
Managed a "Positive Reversal" After Brief Dip Below "Max Buy" Level
Kenneth J. Gruneisen - Passed the CAN SLIM® Master's Exam
Fortinet Inc (FTNT +$5.57 or +4.27% to $135.91) managed a "positive reversal" after briefly undercutting its "max buy" level, posting a solid gain today with higher (+10% above average) volume. It closed -9.2% off its all-time high. Its 50-day moving average (DMA) line ($124.14) and prior highs in the $121 area define important near-term support to watch. FTNT was last shown in this FSU section on 5/22/20 with an annotated graph under the headline, "Extended From Prior Base and Holding Ground Stubbornly".
FTNT finished strong after highlighted in yellow with new pivot point cited based on its 2/06/20 high plus 10 cents in the 5/07/20 mid-day report (read here). Fundamentals remain strong. Bullish action came after reporting earnings +30% on +22% sales revenues for the Mar '20 quarter, its 9th consecutive quarterly comparison with earnings above the +25% minimum guideline (C criteria). Annual earnings (A criteria) have been improving since FY '14, also helping it match with the fact-based investment system's guidelines.
The number of top-rated funds owning its shares rose from 960 in Jun '18 to 1,599 in Mar '20, a reassuring sign concerning the I criteria. Its current Up/Down Volume ratio of 1.4 is an unbiased indication its shares have been neutral concerning accumulation/distribution over the past 50 days. It has a Timeliness rating of A and Sponsorship rating of B.
Charts courtesy of www.stockcharts.com
 |
|
|
Color Codes Explained :
Y - Better candidates highlighted by our
staff of experts.
G - Previously featured
in past reports as yellow but may no longer be buyable under the
guidelines.
***Last / Change / Volume data in this table is the closing quote data***
Symbol/Exchange
Company Name
Industry Group |
PRICE |
CHANGE
(%Change) |
Day High |
Volume
(% DAV)
(% 50 day avg vol) |
52 Wk Hi
% From Hi |
Featured
Date |
Price
Featured |
Pivot Featured |
|
Max Buy |
 FTNT
-
NASDAQ
FTNT
-
NASDAQ
Fortinet Inc
Computer Sftwr-Security
|
$135.91
|
+5.57
4.27% |
$137.31
|
2,031,384
109.86% of 50 DAV
50 DAV is 1,849,000
|
$149.69
-9.21%
|
5/7/2020
|
$134.40
|
PP = $121.92
|
|
MB = $128.02
|
 Most Recent Note - 6/15/2020 5:44:24 PM
G - Closed -9.2% off its all-time high after today's big gain with higher (+10% above average) volume. Its 50 DMA line ($124.14) and prior highs in the $121 area define important near-term support to watch. See the latest FSU analysis for more details and a new annotated graph.
>>> FEATURED STOCK ARTICLE : Managed a "Positive Reversal" After Brief Dip Below "Max Buy" Level - 6/15/2020 |
View all notes |
Set NEW NOTE alert |
Company Profile |
SEC
News |
Chart |
Request a new note
C
A
S
I |
EBS
-
NYSE
Emergent Biosolutions
DRUGS - Biotechnology
|
$71.07
|
+2.29
3.33% |
$71.13
|
542,517
89.67% of 50 DAV
50 DAV is 605,000
|
$93.58
-24.05%
|
6/1/2020
|
$72.10
|
PP = $90.10
|
|
MB = $94.61
|
Most Recent Note - 6/15/2020 5:45:39 PM
G - Posted a gain today with below average volume. Only a prompt rebound above the 50 DMA line ($75.50) would help its outlook improve. Fundamentals remain strong.
>>> FEATURED STOCK ARTICLE : Volume Light Behind Recent Pullback From All-Time High - 5/26/2020 |
View all notes |
Set NEW NOTE alert |
Company Profile |
SEC
News |
Chart |
Request a new note
C
A
S
I |
NBIX
-
NASDAQ
Neurocrine Biosciences
DRUGS - Biotechnology
|
$115.33
|
+0.51
0.44% |
$115.98
|
531,885
64.31% of 50 DAV
50 DAV is 827,000
|
$128.29
-10.10%
|
5/19/2020
|
$123.71
|
PP = $119.75
|
|
MB = $125.74
|
Most Recent Note - 6/11/2020 5:20:28 PM
G - Gapped down today slumping further into the previously noted base raising greater concerns. Recent quarterly comparisons through Mar '20 showed greatly improved sales revenues and earnings increases versus year ago periods (C criteria). After years of losses it reported solid annual earnings (A criteria) in FY '18 and '19.
>>> FEATURED STOCK ARTICLE : Pullback Into Prior Base Negated Recent Breakout - 6/8/2020 |
View all notes |
Set NEW NOTE alert |
Company Profile |
SEC
News |
Chart |
Request a new note
C
A
S
I |
AMD
-
NASDAQ
Advanced Micro Devices
ELECTRONICS - Semiconductor - Broad Line
|
$54.68
|
+1.18
2.21% |
$54.73
|
56,388,337
83.18% of 50 DAV
50 DAV is 67,787,000
|
$59.27
-7.74%
|
6/9/2020
|
$55.41
|
PP = $56.98
|
|
MB = $59.83
|
Most Recent Note - 6/11/2020 5:16:53 PM
Y - Abruptly retreated near its 50 DMA line ($52.97) with volume +15% above average behind today's big loss. Subsequent gains above the pivot point backed by at least +40% above average volume are still needed to trigger a convincing technical buy signal. Previously met stubborn resistance in the $57-59 area. Gains into new high territory may mark the beginning of a substantial leg higher. The 3 latest quarterly comparisons through Mar '20 showed very strong earnings increases with greatly improved sales revenues growth in the Dec '19 and Mar '20 comparisons versus the year ago period.
>>> FEATURED STOCK ARTICLE : Big Chip Firm Showing Strong Sales Revenues and Earnings Increases - 6/9/2020 |
View all notes |
Set NEW NOTE alert |
Company Profile |
SEC
News |
Chart |
Request a new note
C
A
S
I |
TREX
-
NYSE
Trex Company Inc
MATERIALS and CONSTRUCTION - General Building Materials
|
$117.42
|
+4.75
4.22% |
$117.70
|
883,510
87.39% of 50 DAV
50 DAV is 1,011,000
|
$132.84
-11.61%
|
5/5/2020
|
$109.05
|
PP = $111.95
|
|
MB = $117.55
|
Most Recent Note - 6/15/2020 5:48:50 PM
Y - Managed a "positive reversal" today and closed near its "max buy" level. Prior highs in the $111 area define important support to watch above its 50 DMA line ($104.27). Fundamentals remain strong.
>>> FEATURED STOCK ARTICLE : Pullback Toward Prior Highs Which Define Near-Term Support - 6/11/2020 |
View all notes |
Set NEW NOTE alert |
Company Profile |
SEC
News |
Chart |
Request a new note
C
A
S
I |
Symbol/Exchange
Company Name
Industry Group |
PRICE |
CHANGE
(%Change) |
Day High |
Volume
(% DAV)
(% 50 day avg vol) |
52 Wk Hi
% From Hi |
Featured
Date |
Price
Featured |
Pivot Featured |
|
Max Buy |
NFLX
-
NASDAQ
Netflix Inc
SPECIALTY RETAIL - Music and Video Stores
|
$425.50
|
+7.43
1.78% |
$426.49
|
4,374,710
53.74% of 50 DAV
50 DAV is 8,141,000
|
$458.97
-7.29%
|
5/14/2020
|
$441.95
|
PP = $449.62
|
|
MB = $472.10
|
Most Recent Note - 6/12/2020 6:02:10 PM
G - Fell further today after a "negative reversal" on the prior session amid widespread market weakness. Closed below its 50 DMA line ($420.66) raising concerns and its color code was changed to green. Damaging losses below prior lows would trigger a more worrisome technical sell signal. See the latest FSU analysis for more details and a new annotated graph.
>>> FEATURED STOCK ARTICLE : Weak Action Led to 50-Day Moving Average Violation - 6/12/2020 |
View all notes |
Set NEW NOTE alert |
Company Profile |
SEC
News |
Chart |
Request a new note
C
A
S
I |
NOW
-
NYSE
Servicenow Inc
Computer Sftwr-Enterprse
|
$392.50
|
+7.37
1.91% |
$393.98
|
1,433,803
63.36% of 50 DAV
50 DAV is 2,263,000
|
$405.53
-3.21%
|
4/30/2020
|
$343.05
|
PP = $363.05
|
|
MB = $381.20
|
Most Recent Note - 6/12/2020 6:05:40 PM
G - Posted a gain with lighter volume today and its color code is changed to green after rising back above the "max buy" level. Recent gains above the pivot point were not backed by the +40% above average volume necessary to clinch a proper technical buy signal. Prior highs in the $362 area define initial support to watch on pullbacks.
>>> FEATURED STOCK ARTICLE : Quiet Pullback Below "Max Buy" Level for NOW - 6/4/2020 |
View all notes |
Set NEW NOTE alert |
Company Profile |
SEC
News |
Chart |
Request a new note
C
A
S
I |
QLYS
-
NASDAQ
Qualys Inc
Computer Sftwr-Security
|
$101.61
|
-1.50
-1.45% |
$102.38
|
987,585
182.55% of 50 DAV
50 DAV is 541,000
|
$119.20
-14.76%
|
4/9/2020
|
$100.44
|
PP = $97.22
|
|
MB = $102.08
|
Most Recent Note - 6/15/2020 5:52:52 PM
Suffered a damaging loss today with higher volume (above average) but found support and finished in the upper third of its intra-day range. It will be dropped from the Featured Stocks list tonight. Only a prompt rebound above the 50 DMA line ($106) would help its outlook improve. Fundamentals remain strong.
>>> FEATURED STOCK ARTICLE : Qualys is Extended From Prior Base and Perched Near All-Time High - 5/29/2020 |
View all notes |
Set NEW NOTE alert |
Company Profile |
SEC
News |
Chart |
Request a new note
C
A
S
I |
TEAM
-
NASDAQ
Atlassian Corp Plc Cl A
Comp Sftwr-Spec Enterprs
|
$170.73
|
-0.89
-0.52% |
$173.04
|
2,386,606
123.59% of 50 DAV
50 DAV is 1,931,000
|
$191.72
-10.95%
|
5/4/2020
|
$159.70
|
PP = $156.22
|
|
MB = $164.03
|
Most Recent Note - 6/11/2020 5:32:17 PM
G - Consolidating above its 50 DMA line ($163.22) which defines important near-term support above prior highs in the $156 area.
>>> FEATURED STOCK ARTICLE : Positive Reversal Near Prior High and 50 DMA Line - 6/5/2020 |
View all notes |
Set NEW NOTE alert |
Company Profile |
SEC
News |
Chart |
Request a new note
C
A
S
I |
TTD
-
NASDAQ
The Trade Desk Inc Cl A
Comml Svcs-Advertising
|
$370.60
|
+16.09
4.54% |
$373.31
|
2,162,318
98.24% of 50 DAV
50 DAV is 2,201,000
|
$372.88
-0.61%
|
6/3/2020
|
$240.61
|
PP = $327.35
|
|
MB = $343.72
|
Most Recent Note - 6/15/2020 5:50:14 PM
G - Hit a new high and managed its best-ever close today with average volume behind its big gain. Prior highs in the $327 area define important near-term support.
>>> FEATURED STOCK ARTICLE : Trade Desk Posts Powerful Gain for New High - 6/3/2020 |
View all notes |
Set NEW NOTE alert |
Company Profile |
SEC
News |
Chart |
Request a new note
C
A
S
I |
Symbol/Exchange
Company Name
Industry Group |
PRICE |
CHANGE
(%Change) |
Day High |
Volume
(% DAV)
(% 50 day avg vol) |
52 Wk Hi
% From Hi |
Featured
Date |
Price
Featured |
Pivot Featured |
|
Max Buy |
DOCU
-
NASDAQ
Docusign Inc
Computer Sftwr-Enterprse
|
$162.69
|
+12.09
8.03% |
$163.70
|
8,164,758
207.02% of 50 DAV
50 DAV is 3,944,000
|
$155.14
4.87%
|
6/10/2020
|
$149.73
|
PP = $152.10
|
|
MB = $159.71
|
Most Recent Note - 6/15/2020 5:57:15 PM
G - Color code is changed to green after rallying above its "max buy" level today with a big gain above the pivot point backed by +107% above average volume triggering a new (or add-on) technical buy signal.
>>> FEATURED STOCK ARTICLE : Advanced Ascending Base Formed for Strong E-Signature Firm - 6/10/2020 |
View all notes |
Set NEW NOTE alert |
Company Profile |
SEC
News |
Chart |
Request a new note
C
A
S
I |
PING
-
NYSE
Ping Identity Hldg Corp
Computer Sftwr-Security
|
$28.78
|
-0.14
-0.48% |
$29.44
|
620,108
51.50% of 50 DAV
50 DAV is 1,204,000
|
$31.91
-9.81%
|
6/1/2020
|
$29.24
|
PP = $29.90
|
|
MB = $31.40
|
Most Recent Note - 6/12/2020 6:07:33 PM
G - Posted a gain with light volume after testing its 20-day moving average line ($27.88). More damaging losses below the prior low ($27.51 on 6/04/20) would raise greater concerns and trigger a more worrisome technical sell signal.
>>> FEATURED STOCK ARTICLE : Strong Gain for New High Backed by 127% Above Average Volume - 6/1/2020 |
View all notes |
Set NEW NOTE alert |
Company Profile |
SEC
News |
Chart |
Request a new note
C
A
S
I |
AAXN
-
NASDAQ
Axon Enterprise Inc
Security/Sfty
|
$100.35
|
+6.26
6.65% |
$100.41
|
1,418,550
140.59% of 50 DAV
50 DAV is 1,009,000
|
$104.90
-4.34%
|
5/8/2020
|
$84.86
|
PP = $90.20
|
|
MB = $94.71
|
Most Recent Note - 6/15/2020 5:54:48 PM
G - Color code is changed to green after a considerable gain today with above average volume rebounding back above its "max buy" level. Prior highs in the $90-91 area have acted as support following the powerful breakout.
>>> FEATURED STOCK ARTICLE : Quietly Slumping Near 50-Day Moving Average Line - 5/28/2020 |
View all notes |
Set NEW NOTE alert |
Company Profile |
SEC
News |
Chart |
Request a new note
C
A
S
I |
GDDY
-
NYSE
Godaddy Inc Cl A
Computer Sftwr-Enterprse
|
$77.42
|
+1.16
1.52% |
$77.56
|
997,714
66.07% of 50 DAV
50 DAV is 1,510,000
|
$82.47
-6.12%
|
6/2/2020
|
$79.62
|
PP = $82.40
|
|
MB = $86.52
|
Most Recent Note - 6/11/2020 5:31:06 PM
Y - Pulled back today with below average volume for a 3rd consecutive loss. Subsequent gains above the pivot point backed by at least +40% above average volume are needed to trigger a proper technical buy signal. It previously met stubborn resistance in the $82-84 area.
>>> FEATURED STOCK ARTICLE : Godaddy Could Be Ready to Go for New Highs - 6/2/2020 |
View all notes |
Set NEW NOTE alert |
Company Profile |
SEC
News |
Chart |
Request a new note
C
A
S
I |
|
|
|
THESE ARE NOT BUY RECOMMENDATIONS!
Comments contained in the body of this report are technical
opinions only. The material herein has been obtained
from sources believed to be reliable and accurate, however,
its accuracy and completeness cannot be guaranteed.
This site is not an investment advisor, hence it does
not endorse or recommend any securities or other investments.
Any recommendation contained in this report may not
be suitable for all investors and it is not to be deemed
an offer or solicitation on our part with respect to
the purchase or sale of any securities. All trademarks,
service marks and trade names appearing in this report
are the property of their respective owners, and are
likewise used for identification purposes only.
This report is a service available
only to active Paid Premium Members.
You may opt-out of receiving report notifications
at any time. Questions or comments may be submitted
by writing to Premium Membership Services 665 S.E. 10 Street, Suite 201 Deerfield Beach, FL 33441-5634 or by calling 1-800-965-8307
or 954-785-1121.
|
|
|