You are not logged in.
This means you
CAN ONLY VIEW reports that were published prior to Friday, February 16, 2024.
You
MUST UPGRADE YOUR MEMBERSHIP if you want to see any current reports.
AFTER MARKET UPDATE - THURSDAY, JUNE 13TH, 2019
Previous After Market Report Next After Market Report >>>
|
|
|
|
DOW |
+101.94 |
26,106.77 |
+0.39% |
|
Volume |
710,775,630 |
+5% |
|
Volume |
1,834,739,252 |
-6% |
|
NASDAQ |
+44.41 |
7,837.13 |
+0.57% |
|
Advancers |
2,077 |
72% |
|
Advancers |
2,073 |
68% |
|
S&P 500 |
+11.80 |
2,891.64 |
+0.41% |
|
Decliners |
791 |
28% |
|
Decliners |
985 |
32% |
|
Russell 2000 |
+16.01 |
1,535.80 |
+1.05% |
|
52 Wk Highs |
124 |
|
|
52 Wk Highs |
70 |
|
|
S&P 600 |
+10.39 |
932.22 |
+1.13% |
|
52 Wk Lows |
47 |
|
|
52 Wk Lows |
68 |
|
|
 |
Breadth Positive as Major Indices Tallied Gains
Kenneth J. Gruneisen - Passed the CAN SLIM® Master's Exam
The Dow climbed 101 points, while the S&P 500 gained 0.4%. The Nasdaq Composite was up 0.6%. The volume totals reported were mixed, higher on the NYSE and lighter on the Nasdaq exchange. Breadth was positive as advancers led decliners by a 5-2 margin on the NYSE and 2-1 on the Nasdaq exchange. There were 34 high-ranked companies from the Leaders List hit new 52-week highs and were listed on the BreakOuts Page, versus the total of 30 on the prior session. Leadership improved as new 52-week highs totals expanded and outnumbered new 52-week lows on the NYSE and on the Nasdaq exchange. Big gains last Friday marked Day 4 of the new rally attempt, and the major indices (M criteria) established a new "confirmed uptrend" under the fact-based system as the bullish session met the requirements to be a proper follow-through day. The Featured Stocks Page provides the most timely analysis on high-ranked leaders. Charts used courtesy of www.stockcharts.com
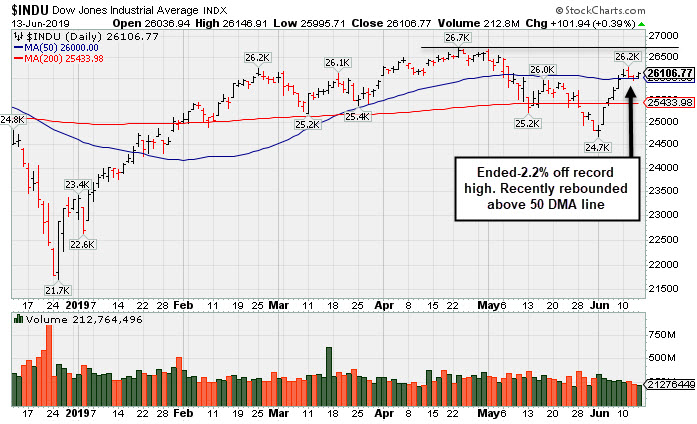
PICTURED: The Dow Jones Industrial Average is perched -2.2% off its record high and recently rebounded above its 50-day moving average (DMA) line helping its technical stance.
Stocks finished higher Thursday. The major averages rebounded from a two-day decline as investors digested economic updates and continued to await further trade and monetary policy developments.
10 of 11 S&P 500 sectors closed in positive territory, with Health Care the sole decliner. Energy shares paced gains, as WTI crude spiked 2.2% to $52.22/barrel amid reports of an attack on oil tankers in the Middle East. The Communication Services sector also outperformed, closing more than 1% higher. Disney (DIS +4.44%) drove gains in the group, jumping on positive analyst commentary surrounding the media giant’s upcoming video subscription service launch.
In earnings, Lululemon (LULU +2.12%) rose after the yoga-wear maker exceeded comparable-store sales expectations and raised its full-year forecast. Restoration Hardware (RH +15.83%) surged after topping Wall Street sales estimates and providing optimistic forward guidance.
On the data front Thursday, initial jobless claims came in at 222,000 in the most recent week, the highest reading in more than a month. A separate release revealed import prices dipped 0.3%, while export prices edged down 0.2% in May. Treasuries strengthened with the yield on the 10-year note down two basis points to 2.10%. Other perceived safe haven assets rallied, with COMEX gold gaining 0.6% to $1,339.80/ounce.
|
 Kenneth J. Gruneisen started out as a licensed stockbroker in August 1987, a couple of months prior to the historic stock market crash that took the Dow Jones Industrial Average down -22.6% in a single day. He has published daily fact-based fundamental and technical analysis on high-ranked stocks online for two decades. Through FACTBASEDINVESTING.COM, Kenneth provides educational articles, news, market commentary, and other information regarding proven investment systems that work in good times and bad.
Comments contained in the body of this report are technical opinions only and are not necessarily those of Gruneisen Growth Corp. The material herein has been obtained from sources believed to be reliable and accurate, however, its accuracy and completeness cannot be guaranteed. Our firm, employees, and customers may effect transactions, including transactions contrary to any recommendation herein, or have positions in the securities mentioned herein or options with respect thereto. Any recommendation contained in this report may not be suitable for all investors and it is not to be deemed an offer or solicitation on our part with respect to the purchase or sale of any securities. |
|
 |
Retail and Commodity-Linked Groups Led Techs and Financials
Kenneth J. Gruneisen - Passed the CAN SLIM® Master's Exam
The Bank Index ($BKX +0.30%) and Broker/Dealer Index ($XBD +0.27%) both posted modest gains. The tech sector had a positive bias as the Semiconductor Index ($SOX +0.58%) and Biotech Index ($BTK +0.60%) posted modest gains and the Networking Index ($NWX +0.19%) also inched higher. Commodity-linked groups were standout gainers as the Gold & Silver Index ($XAU +1.51%), Integrated Oil Index ($XOI +1.19%) and the Oil Services Index ($OSX +3.67%) rose. Charts courtesy of www.stockcharts.com
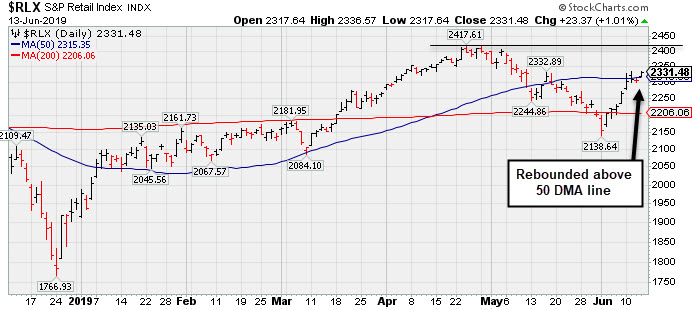 PICTURED: The Retail Index ($RLX +1.01%) recently has rebounded above its 50-day moving average (DMA) line.
| Oil Services |
$OSX |
74.76 |
+2.64 |
+3.66% |
-7.25% |
| Integrated Oil |
$XOI |
1,211.81 |
+14.23 |
+1.19% |
+4.55% |
| Semiconductor |
$SOX |
1,392.94 |
+7.99 |
+0.58% |
+20.58% |
| Networking |
$NWX |
570.78 |
+1.10 |
+0.19% |
+16.80% |
| Broker/Dealer |
$XBD |
263.49 |
+0.70 |
+0.27% |
+11.02% |
| Retail |
$RLX |
2,331.48 |
+23.37 |
+1.01% |
+19.48% |
| Gold & Silver |
$XAU |
75.99 |
+1.13 |
+1.51% |
+7.54% |
| Bank |
$BKX |
95.92 |
+0.28 |
+0.29% |
+11.81% |
| Biotech |
$BTK |
4,559.63 |
+27.35 |
+0.60% |
+8.03% |
|
|
|
 |
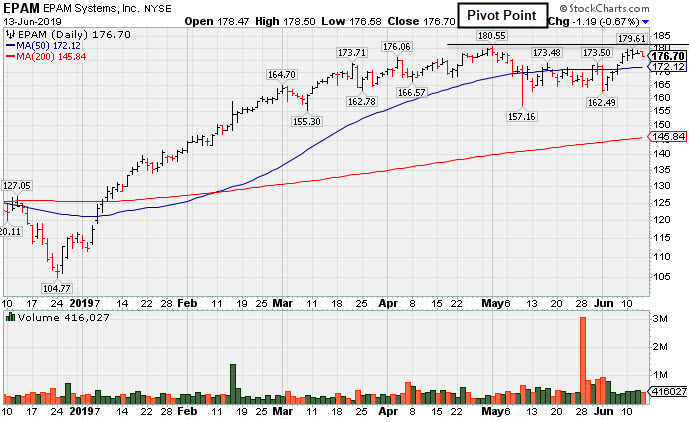
Perched Near Pivot Point After a New Flat Base
Kenneth J. Gruneisen - Passed the CAN SLIM® Master's Exam
Epam Systems Inc (EPAM -$1.19 or -0.67% to $176.70) recently rebounded above its 50-day moving average (DMA) line ($172) helping its outlook to improve. It is perched within close striking distance of its 52-week high. Subsequent gains above the pivot point backed by at least +40% above average volume may trigger a new (or add-on) technical buy signal.
EPAM reported earnings +34% on +23% sales revenues for the Mar '19 quarter, continuing its strong earnings track record. Fundamentals remain strong with a 97 Earnings Per Share Rating, well above the 80+ minimum guideline for buy candidates.The Computer - Tech Services firm's annual earnings history (A criteria) has been strong. It was last shown in this FSU section on 5/09/19 with an annotated graph under the headline, "Found Support and Closed in Upper Third of Day's Range".
The number of top-rated funds owning its shares rose from 462 in Jun '17 to 631 in Mar '19, a reassuring sign concerning the I criteria. Its small supply of only 51.4 million shares (S criteria) in the pubic float can contribute to greater volatility in the event of institutional buying or selling. Its Relative Strength rating of 94 is above the 80+ minimum guideline for buy candidates.
|
|
|
Color Codes Explained :
Y - Better candidates highlighted by our
staff of experts.
G - Previously featured
in past reports as yellow but may no longer be buyable under the
guidelines.
***Last / Change / Volume data in this table is the closing quote data***
Symbol/Exchange
Company Name
Industry Group |
PRICE |
CHANGE
(%Change) |
Day High |
Volume
(% DAV)
(% 50 day avg vol) |
52 Wk Hi
% From Hi |
Featured
Date |
Price
Featured |
Pivot Featured |
|
Max Buy |
 SPSC
-
NASDAQ
SPSC
-
NASDAQ
S P S Commerce Inc
COMPUTER SOFTWARE and SERVICES - Application Software
|
$106.76
|
+0.13
0.12% |
$107.45
|
64,757
41.25% of 50 DAV
50 DAV is 157,000
|
$115.00
-7.17%
|
6/7/2019
|
$107.72
|
PP = $115.10
|
|
MB = $120.86
|
Most Recent Note - 6/7/2019 6:33:00 PM
Y - Rebounded further above its 50 DMA line ($104) with today's gain on light volume. Color code is changed to yellow with new pivot point cited based on its 4/26/19 high plus 10 cents. Subsequent volume-driven gains above the pivot point are needed to trigger a new (or add-on) technical buy signal. Faces some resistance due to overhead supply up to the $115 level. Recent lows in the $98-99 area define important near-term support to watch. Fundamentals remain strong. See the latest FSU analysis for more details and a new annotated graph.
>>> FEATURED STOCK ARTICLE : Base Building Now Above 50-Day Moving Average Line - 6/7/2019 |
View all notes |
Set NEW NOTE alert |
Company Profile |
SEC
News |
Chart |
Request a new note
C
A
S
I |
EPAM
-
NYSE
Epam Systems Inc
COMPUTER SOFTWARE and SERVICES - Information Technology Service
|
$176.70
|
-1.19
-0.67% |
$178.50
|
416,027
82.87% of 50 DAV
50 DAV is 502,000
|
$180.55
-2.13%
|
5/9/2019
|
$169.25
|
PP = $180.55
|
|
MB = $189.58
|
 Most Recent Note - 6/13/2019 5:15:46 PM
Y - Perched within close striking distance of its 52-week high. Subsequent gains above the pivot point backed by at least +40% above average volume may trigger a new (or add-on) technical buy signal.Rebound above its 50 DMA line ($172) helped its outlook to improve. Fundamentals remain strong. See the latest FSU analysis for more details and a new annotated graph.
>>> FEATURED STOCK ARTICLE : Perched Near Pivot Point After a New Flat Base - 6/13/2019 |
View all notes |
Set NEW NOTE alert |
Company Profile |
SEC
News |
Chart |
Request a new note
C
A
S
I |
ENV
-
NYSE
Envestnet Inc
FINANCIAL SERVICES - Diversified Investments
|
$68.87
|
+0.27
0.39% |
$69.20
|
244,631
83.78% of 50 DAV
50 DAV is 292,000
|
$72.67
-5.23%
|
3/15/2019
|
$66.05
|
PP = $64.90
|
|
MB = $68.15
|
Most Recent Note - 6/12/2019 12:05:41 PM
G - Violated its 50 DMA line ($68.72) on the prior session with a damaging volume-driven loss raising concerns. Recently reported earnings +5% on +1% sales revenues for the Mar '19 quarter, below the +25% minimum earnings guideline (C criteria). The prior high ($64.80 on 9/14/18) defines important near-term support to watch.
>>> FEATURED STOCK ARTICLE : Rebound Above 50-Day Moving Average Improved Technical Stance - 6/4/2019 |
View all notes |
Set NEW NOTE alert |
Company Profile |
SEC
News |
Chart |
Request a new note
C
A
S
I |
LHCG
-
NASDAQ
L H C Group Inc
HEALTH SERVICES - Home Health Care
|
$116.50
|
+0.58
0.50% |
$117.98
|
125,031
50.83% of 50 DAV
50 DAV is 246,000
|
$122.20
-4.66%
|
4/29/2019
|
$110.94
|
PP = $115.64
|
|
MB = $121.42
|
Most Recent Note - 6/10/2019 5:21:09 PM
Y - Rebounded further above its pivot point with today's gain backed by lighter than average volume. Its 50 DMA line ($111) defines near-term support. Fundamentals remain strong.
>>> FEATURED STOCK ARTICLE : Long-Term Care Firm Hovering Near All-Time High - 5/14/2019 |
View all notes |
Set NEW NOTE alert |
Company Profile |
SEC
News |
Chart |
Request a new note
C
A
S
I |
ENSG
-
NASDAQ
Ensign Group Inc
HEALTH SERVICES - Long-Term Care Facilities
|
$55.66
|
+0.66
1.20% |
$55.66
|
204,471
68.61% of 50 DAV
50 DAV is 298,000
|
$58.14
-4.27%
|
4/30/2019
|
$51.46
|
PP = $53.30
|
|
MB = $55.97
|
Most Recent Note - 6/7/2019 6:46:41 PM
Y - Showing resilience while consolidating above its 50 DMA line ($52.42) and recent lows which define near-term support to watch. Recently reported earnings +22% on +12% sales revenues for the Mar '19 quarter, below the +25% minimum earnings guideline (C criteria), raising fundamental concerns.
>>> FEATURED STOCK ARTICLE : Resilient After Latest Quarterly Report Missed Minimum Guideline - 6/3/2019 |
View all notes |
Set NEW NOTE alert |
Company Profile |
SEC
News |
Chart |
Request a new note
C
A
S
I |
Symbol/Exchange
Company Name
Industry Group |
PRICE |
CHANGE
(%Change) |
Day High |
Volume
(% DAV)
(% 50 day avg vol) |
52 Wk Hi
% From Hi |
Featured
Date |
Price
Featured |
Pivot Featured |
|
Max Buy |
CHDN
-
NASDAQ
Churchill Downs Inc
LEISURE - Gaming Activities
|
$114.02
|
-0.37
-0.32% |
$115.64
|
183,434
56.62% of 50 DAV
50 DAV is 324,000
|
$115.36
-1.16%
|
6/5/2019
|
$108.87
|
PP = $104.96
|
|
MB = $110.21
|
Most Recent Note - 6/10/2019 5:25:13 PM
G - Color code is changed to green after rallying above its "max buy" level with today's 8th consecutive gain. Prior highs in the $104 area define initial support to watch on pullbacks. Share price was impacted by a 3:1 split when last noted on 1/28/19.
>>> FEATURED STOCK ARTICLE : Consolidating Near 50-Day Moving Average - 6/29/2018 |
View all notes |
Set NEW NOTE alert |
Company Profile |
SEC
News |
Chart |
Request a new note
C
A
S
I |
LULU
-
NASDAQ
Lululemon Athletica
MANUFACTURING - Textile Manufacturing
|
$174.52
|
+3.63
2.12% |
$182.89
|
11,051,299
606.55% of 50 DAV
50 DAV is 1,822,000
|
$179.50
-2.77%
|
6/13/2019
|
$174.48
|
PP = $179.60
|
|
MB = $188.58
|
Most Recent Note - 6/13/2019 12:46:30 PM
Y - Trading above its 50 DMA line ($172) after spiking to a new high with today's early gain. Color code is changed to yellow with new pivot point cited based on its 4/24/19 high plus 10 cents. A gain and strong close above the pivot point backed by at least +40% above average volume may trigger a new (or add-on) technical buy signal. Reported Apr '19 quarterly earnings +35% on +20% sales revenues versus the ear ago period. Volume and volatility often increase near earnings news. Recent low ($160.88 on 5/29/19) defines important support near prior highs.
>>> FEATURED STOCK ARTICLE : Volume Light While Hovering Near High - 5/10/2019 |
View all notes |
Set NEW NOTE alert |
Company Profile |
SEC
News |
Chart |
Request a new note
C
A
S
I |
ULTA
-
NASDAQ
Ulta Beauty Inc
SPECIALTY RETAIL - Specialty Retail, Other
|
$349.81
|
+6.99
2.04% |
$350.20
|
731,882
103.08% of 50 DAV
50 DAV is 710,000
|
$359.69
-2.75%
|
3/15/2019
|
$341.27
|
PP = $322.59
|
|
MB = $338.72
|
Most Recent Note - 6/13/2019 5:17:48 PM
G - Posted a 3rd consecutive gain today with average volume as it rebounded above its 50 DMA line ($344) helping its outlook to improve. Rebounded from a deep early loss on 5/31/19 after gapping down. Reported earnings +17% on +13% sales revenues for the Apr '19 quarter, below the +25% minimum earnings guideline (C criteria), raising fundamental concerns. Faces resistance due to overhead supply up to the $359 level.
>>> FEATURED STOCK ARTICLE : Sputtering Below 50-Day Moving Average Following Sub Par Earnings - 6/6/2019 |
View all notes |
Set NEW NOTE alert |
Company Profile |
SEC
News |
Chart |
Request a new note
C
A
S
I |
ESNT
-
NYSE
Essent Group Ltd
Finance-MrtgandRel Svc
|
$48.60
|
+0.01
0.02% |
$49.05
|
514,920
86.98% of 50 DAV
50 DAV is 592,000
|
$50.51
-3.78%
|
3/18/2019
|
$45.84
|
PP = $45.06
|
|
MB = $47.31
|
Most Recent Note - 6/10/2019 12:00:53 PM
G - Hitting a new all-time high today and its color code is changed to green after rising above its "max buy" level. Found support above its 50 DMA line ($46.79) during its consolidation in recent months. Recently reported earnings +15% on +20% sales revenues for the Mar '19 quarter, below the +25% minimum earnings guideline (C criteria), raising fundamental concerns.
>>> FEATURED STOCK ARTICLE : Still Hovering Not Far From 52-Week High - 6/5/2019 |
View all notes |
Set NEW NOTE alert |
Company Profile |
SEC
News |
Chart |
Request a new note
C
A
S
I |
NOW
-
NYSE
Servicenow Inc
Computer Sftwr-Enterprse
|
$273.79
|
+5.91
2.21% |
$274.09
|
1,171,649
66.84% of 50 DAV
50 DAV is 1,753,000
|
$281.74
-2.82%
|
4/22/2019
|
$242.64
|
PP = $251.75
|
|
MB = $264.34
|
Most Recent Note - 6/11/2019 5:52:38 PM
G - Pulled back abruptly today following 5 consecutive gains. Its 50 DMA line ($258.77) and prior high ($251.65 on 3/21/19) define near-term support to watch. Recently reported earnings +20% on +34% sales revenues for the Mar '19 quarter, below the +25% minimum earnings guideline (C criteria), raising fundamental concerns.
>>> FEATURED STOCK ARTICLE : Leader Consolidating Above 50-Day Moving Average Line - 5/29/2019 |
View all notes |
Set NEW NOTE alert |
Company Profile |
SEC
News |
Chart |
Request a new note
C
A
S
I |
Symbol/Exchange
Company Name
Industry Group |
PRICE |
CHANGE
(%Change) |
Day High |
Volume
(% DAV)
(% 50 day avg vol) |
52 Wk Hi
% From Hi |
Featured
Date |
Price
Featured |
Pivot Featured |
|
Max Buy |
QLYS
-
NASDAQ
Qualys Inc
Computer Sftwr-Security
|
$87.14
|
-0.09
-0.10% |
$88.22
|
210,904
67.25% of 50 DAV
50 DAV is 313,600
|
$98.30
-11.35%
|
5/23/2019
|
$90.43
|
PP = $98.40
|
|
MB = $103.32
|
Most Recent Note - 6/10/2019 5:16:38 PM
G - Rebounded above its 50 ($86.05) today after finding prompt support near its 200 DMA line, however, its Relative Strength Rating is 72, below the 80+ minimum guideline for buy candidates. Met stubborn resistance in the $97-98 area. Reported earnings +36% on +16% sales revenues for the Mar '19 quarter, continuing its strong earnings history.
>>> FEATURED STOCK ARTICLE : Encountering Distributional Pressure in Recent Weeks - 6/11/2019 |
View all notes |
Set NEW NOTE alert |
Company Profile |
SEC
News |
Chart |
Request a new note
C
A
S
I |
VEEV
-
NYSE
Veeva Systems Inc Cl A
Computer Sftwr-Medical
|
$166.33
|
-0.69
-0.41% |
$168.46
|
862,819
64.39% of 50 DAV
50 DAV is 1,340,000
|
$167.92
-0.95%
|
5/30/2019
|
$154.32
|
PP = $145.80
|
|
MB = $153.09
|
Most Recent Note - 6/10/2019 5:18:10 PM
G - Today's 5th consecutive gain with above average volume leaves it very extended from any sound base. Reported earnings +52% on +25% sales revenues for the Apr '19 quarter, marking its 5th strong quarter with earnings above the +25% minimum guideline (C criteria).
>>> FEATURED STOCK ARTICLE : Big Volume-Driven Gain for New High Following Earnings News - 5/30/2019 |
View all notes |
Set NEW NOTE alert |
Company Profile |
SEC
News |
Chart |
Request a new note
C
A
S
I |
PAYC
-
NYSE
Paycom Software Inc
COMPUTER SOFTWARE and SERVICES - Application Software
|
$218.76
|
+4.76
2.22% |
$218.76
|
549,573
73.47% of 50 DAV
50 DAV is 748,000
|
$230.90
-5.26%
|
2/6/2019
|
$171.66
|
PP = $164.18
|
|
MB = $172.39
|
Most Recent Note - 6/11/2019 5:49:56 PM
G - Pulled back today following a "negative reversal" on the prior session after hitting a new all-time high. Extended from any sound base. Its 50 DMA line ($201) and recent low ($194.84 on 6/03/19) define important near-term support to watch on pullbacks. Reported earnings +25% on +30% sales revenues for the Mar '19 quarter.
>>> FEATURED STOCK ARTICLE : Posted Volume-Driven Gain While Hovering Near All-Time High - 5/31/2019 |
View all notes |
Set NEW NOTE alert |
Company Profile |
SEC
News |
Chart |
Request a new note
C
A
S
I |
PYPL
-
NASDAQ
Paypal Holdings Inc
Finance-CrdtCard/PmtPr
|
$115.72
|
+1.22
1.07% |
$115.82
|
4,054,269
66.17% of 50 DAV
50 DAV is 6,127,000
|
$117.45
-1.47%
|
1/24/2019
|
$92.56
|
PP = $93.80
|
|
MB = $98.49
|
Most Recent Note - 6/7/2019 6:44:08 PM
G - Managed a best-ever close with near average volume behind today's 4th consecutive gain. It did not form a sound base yet promptly rebounded after violating its 50 DMA line and prior low ($106.52) on 6/03/19 triggering technical sell signals. Recently reported earnings +37% on +12% sales revenues for the Mar '19 quarter, continuing its strong earnings track record.
>>> FEATURED STOCK ARTICLE : Hovering Near All Time High Extended From Any Sound Base - 5/15/2019 |
View all notes |
Set NEW NOTE alert |
Company Profile |
SEC
News |
Chart |
Request a new note
C
A
S
I |
PLNT
-
NYSE
Planet Fitness Inc Cl A
Leisure-Services
|
$79.57
|
+0.91
1.16% |
$79.67
|
943,094
65.77% of 50 DAV
50 DAV is 1,434,000
|
$81.76
-2.68%
|
11/7/2018
|
$57.10
|
PP = $55.45
|
|
MB = $58.22
|
Most Recent Note - 6/12/2019 5:31:39 PM
G - Extended from any sound base. Found support above its 50 DMA line ($75.17) and prior low during the recent consolidation. Violations would raise concerns and trigger technical sell signals. Fundamentals remain strong.
>>> FEATURED STOCK ARTICLE : Pulling Back From High After Impressive Rally - 5/23/2019 |
View all notes |
Set NEW NOTE alert |
Company Profile |
SEC
News |
Chart |
Request a new note
C
A
S
I |
Symbol/Exchange
Company Name
Industry Group |
PRICE |
CHANGE
(%Change) |
Day High |
Volume
(% DAV)
(% 50 day avg vol) |
52 Wk Hi
% From Hi |
Featured
Date |
Price
Featured |
Pivot Featured |
|
Max Buy |
BLD
-
NYSE
Topbuild Corp
Bldg-Constr Prds/Misc
|
$82.21
|
+1.58
1.96% |
$82.55
|
409,320
131.19% of 50 DAV
50 DAV is 312,000
|
$87.21
-5.73%
|
5/17/2019
|
$82.19
|
PP = $87.31
|
|
MB = $91.68
|
Most Recent Note - 6/7/2019 6:36:20 PM
Y - Posted another gain today with light volume. Subsequent gains above the pivot point backed by at least +40% above average volume may trigger a technical buy signal. Fundamentals remain strong.
>>> FEATURED STOCK ARTICLE : Encountered Distributional Pressure Near Prior High - 5/20/2019 |
View all notes |
Set NEW NOTE alert |
Company Profile |
SEC
News |
Chart |
Request a new note
C
A
S
I |
TEAM
-
NASDAQ
Atlassian Corp Plc Cl A
Comp Sftwr-Spec Enterprs
|
$130.28
|
+1.31
1.02% |
$131.52
|
937,492
50.98% of 50 DAV
50 DAV is 1,839,000
|
$137.78
-5.44%
|
5/24/2019
|
$129.52
|
PP = $132.09
|
|
MB = $138.69
|
Most Recent Note - 6/7/2019 6:35:11 PM
Y - Posted a 4th consecutive gain today with lighter than average volume and ended at a best-ever close. The 50 DMA line and prior high ($117)define important neat-term support to watch. Reported earnings +133% on +38% sales revenues for the Mar '19 quarter, continuing its strong earnings track record.
>>> FEATURED STOCK ARTICLE : Perched Near All-Time High After "3-Weeks Tight" - 5/24/2019 |
View all notes |
Set NEW NOTE alert |
Company Profile |
SEC
News |
Chart |
Request a new note
C
A
S
I |
UPLD
-
NASDAQ
Upland Software Inc
Computer Sftwr-Enterprse
|
$48.24
|
+0.29
0.60% |
$48.91
|
384,474
77.05% of 50 DAV
50 DAV is 499,000
|
$54.87
-12.08%
|
6/10/2019
|
$53.30
|
PP = $50.74
|
|
MB = $53.28
|
Most Recent Note - 6/12/2019 5:30:08 PM
Y - Abruptly retreated with 2 volume-driven losses slumping back into the prior base and raising concerns. Near-term support to watch is at its 50 DMA line ($45.42). Highlighted in yellow in the 6/10/19 mid-day report with pivot point cited based on its 5/17/19 high plus 10 cents as it rose from an advanced ascending base. Completed a new Public Offering on 5/08/19. Quarterly comparisons through Mar '19 have shown impressive sales revenues growth and greatly improved earnings increases above the +25% minimum guideline (C criteria).
>>> FEATURED STOCK ARTICLE : Rose From an Advanced Ascending Base - 6/10/2019 |
View all notes |
Set NEW NOTE alert |
Company Profile |
SEC
News |
Chart |
Request a new note
C
A
S
I |
GLOB
-
NYSE
Globant SA
Computer-Tech Services
|
$101.27
|
+1.67
1.68% |
$102.24
|
460,923
118.79% of 50 DAV
50 DAV is 388,000
|
$100.99
0.28%
|
2/15/2019
|
$69.35
|
PP = $70.00
|
|
MB = $73.50
|
Most Recent Note - 6/12/2019 5:25:52 PM
G - Rallied for a best-ever close with today's big gain on near average volume. Very extended from any sound base. Its 50 DMA line ($84.10) defines important support where a violation would raise concerns and trigger a technical sell signal. Fundamentals remain strong. See the latest FSU analysis for more details and a new annotated graph.
>>> FEATURED STOCK ARTICLE : Posted Big Gain for Another New High Close - 6/12/2019 |
View all notes |
Set NEW NOTE alert |
Company Profile |
SEC
News |
Chart |
Request a new note
C
A
S
I |
|
|
|
THESE ARE NOT BUY RECOMMENDATIONS!
Comments contained in the body of this report are technical
opinions only. The material herein has been obtained
from sources believed to be reliable and accurate, however,
its accuracy and completeness cannot be guaranteed.
This site is not an investment advisor, hence it does
not endorse or recommend any securities or other investments.
Any recommendation contained in this report may not
be suitable for all investors and it is not to be deemed
an offer or solicitation on our part with respect to
the purchase or sale of any securities. All trademarks,
service marks and trade names appearing in this report
are the property of their respective owners, and are
likewise used for identification purposes only.
This report is a service available
only to active Paid Premium Members.
You may opt-out of receiving report notifications
at any time. Questions or comments may be submitted
by writing to Premium Membership Services 665 S.E. 10 Street, Suite 201 Deerfield Beach, FL 33441-5634 or by calling 1-800-965-8307
or 954-785-1121.
|
|
|