You are not logged in.
This means you
CAN ONLY VIEW reports that were published prior to Sunday, February 25, 2024.
You
MUST UPGRADE YOUR MEMBERSHIP if you want to see any current reports.
AFTER MARKET UPDATE - FRIDAY, JUNE 12TH, 2020
Previous After Market Report Next After Market Report >>>
|
|
|
|
DOW |
+477.37 |
25,605.54 |
+1.90% |
|
Volume |
1,163,938,720 |
-12% |
|
Volume |
4,370,056,400 |
-16% |
|
NASDAQ |
+96.08 |
9,588.81 |
+1.01% |
|
Advancers |
2,289 |
78% |
|
Advancers |
2,477 |
75% |
|
S&P 500 |
+39.21 |
3,041.31 |
+1.31% |
|
Decliners |
635 |
22% |
|
Decliners |
844 |
25% |
|
Russell 2000 |
+31.46 |
1,387.68 |
+2.32% |
|
52 Wk Highs |
12 |
|
|
52 Wk Highs |
24 |
|
|
S&P 600 |
+20.24 |
812.49 |
+2.55% |
|
52 Wk Lows |
2 |
|
|
52 Wk Lows |
7 |
|
|
 |
Indices Bounced Back With Lighter Volume After Thursday's Plunge
Kenneth J. Gruneisen - Passed the CAN SLIM® Master's Exam
The Dow pared an 800 point rally to finish 477 points higher. The S&P 500 rose 1.3%, while the Nasdaq Composite added 1%. Despite Friday’s gains, the major averages capped their first weekly decline in four weeks, with the Dow and S&P 500 slumping 5.6% and 4.8%, respectively. The Tech-heavy Nasdaq outperformed its peers on a relative basis, losing 2.3% for the week. Advancers led decliners by a 3-1 margin on the NYSE and on the Nasdaq exchange. The reported volume totals were lighter than the prior session on the NYSE and on the Nasdaq exchange, indicative of less decisive institutional buying demand. There were 6 high-ranked companies from the Leaders List that hit new 52-week highs and were listed on the BreakOuts Page, versus 7 on the prior session, and down from 60 last Friday. New 52-week highs totals still outnumbered new 52-week lows totals on the NYSE and on the Nasdaq exchange. The major indices have clearly seen the recent uptrend come under pressure (M criteria). Any sustainable rally requires a healthy crop of new leaders, so the abrupt contraction in new highs totals is a worrisome sign. Charts used courtesy of www.stockcharts.com
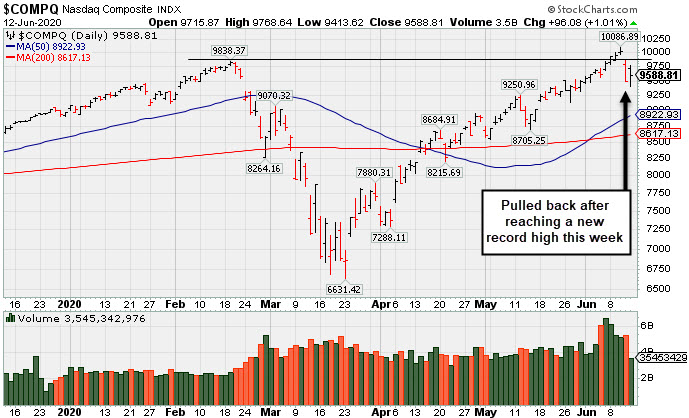
PICTURED: The Nasdaq Composite Index pulled back after reaching a new record high this week.
Stocks rebounded from Thursday’s sharp sell-off on Friday, as Wall Street seemed to “buy the dip.” However, volatility persisted in the session with recent market headwinds such as fears of a resurgence in COVID-19 infections, cautionary commentary from the Federal Reserve on Wednesday, and concerns of outstretched equity valuations pressuring investor sentiment.
Nine of 11 S&P 500 sectors finished in positive territory, with Utilities and Consumer Staples bucking the uptrend. Many of the stocks which sold-off the most in Thursday’s rout led the rebound, with American Airlines (AAL +16.41%) and Norwegian Cruise Lines (NCLH +18.84%) both posting solid gains. In earnings, Lululemon (LULU -3.82%) fell after missing analyst earnings and revenue forecasts for the first time in three years. Adobe (ADBE +4.87%) hit a new all-time high after the company reported an increase in software demand from the work from home environment.
On the data front, a preliminary gauge of consumer sentiment in June from the University of Michigan improved more than anticipated. Treasuries weakened with the yield on the 10-year note adding five basis points to 0.71%, though still 17 basis below last week’s level. In commodities, WTI crude added 0.2% to $36.43/barrel, but fell more than 7% for the week. |
 Kenneth J. Gruneisen started out as a licensed stockbroker in August 1987, a couple of months prior to the historic stock market crash that took the Dow Jones Industrial Average down -22.6% in a single day. He has published daily fact-based fundamental and technical analysis on high-ranked stocks online for two decades. Through FACTBASEDINVESTING.COM, Kenneth provides educational articles, news, market commentary, and other information regarding proven investment systems that work in good times and bad.
Comments contained in the body of this report are technical opinions only and are not necessarily those of Gruneisen Growth Corp. The material herein has been obtained from sources believed to be reliable and accurate, however, its accuracy and completeness cannot be guaranteed. Our firm, employees, and customers may effect transactions, including transactions contrary to any recommendation herein, or have positions in the securities mentioned herein or options with respect thereto. Any recommendation contained in this report may not be suitable for all investors and it is not to be deemed an offer or solicitation on our part with respect to the purchase or sale of any securities. |
|
 |
Financial, Energy, and Tech Groups Led Market Rebound
Kenneth J. Gruneisen - Passed the CAN SLIM® Master's Exam
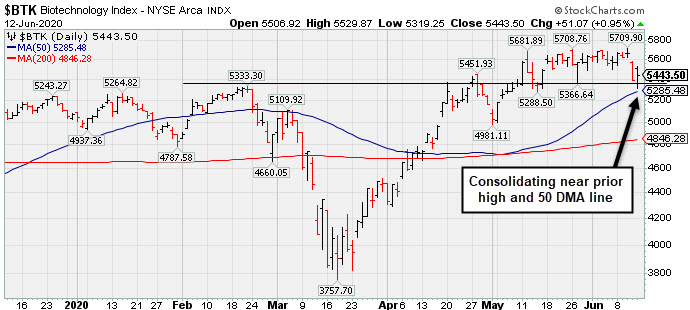
The Bank Index ($BKX +3.97%) outpaced the Broker/Dealer Index ($XBD +2.85%) as financials helped underpin the market rebound. Meanwhile, the Retail Index ($RLX +0.0%) finished flat. The tech sector had a positive bias as the Biotech Index ($BTK +0.95%), Semiconductor Index ($SOX +1.45%) and the Networking Index ($NWX +2.17%) each posted gains. Energy-linked groups were big gainers as the Oil Services Index ($OSX +5.10%) and the Integrated Oil Index ($XOI +3.43%) both bounced, meanwhile, the Gold & Silver Index ($XAU -0.31%) was a laggard.
PICTURED: The Biotech Index ($BTK +0.95%) is consolidating near its prior high and its 50-day moving average (DMA) line.
| Oil Services |
$OSX |
35.79 |
+1.73 |
+5.08% |
-54.29% |
| Integrated Oil |
$XOI |
819.24 |
+27.13 |
+3.43% |
-35.52% |
| Semiconductor |
$SOX |
1,903.85 |
+27.19 |
+1.45% |
+2.93% |
| Networking |
$NWX |
549.49 |
+11.68 |
+2.17% |
-5.81% |
| Broker/Dealer |
$XBD |
271.03 |
+7.51 |
+2.85% |
-6.66% |
| Retail |
$RLX |
2,835.41 |
+0.08 |
+0.00% |
+15.77% |
| Gold & Silver |
$XAU |
114.48 |
-0.36 |
-0.31% |
+7.07% |
| Bank |
$BKX |
77.94 |
+2.97 |
+3.96% |
-31.25% |
| Biotech |
$BTK |
5,443.50 |
+51.07 |
+0.95% |
+7.42% |
|
|
|
 |
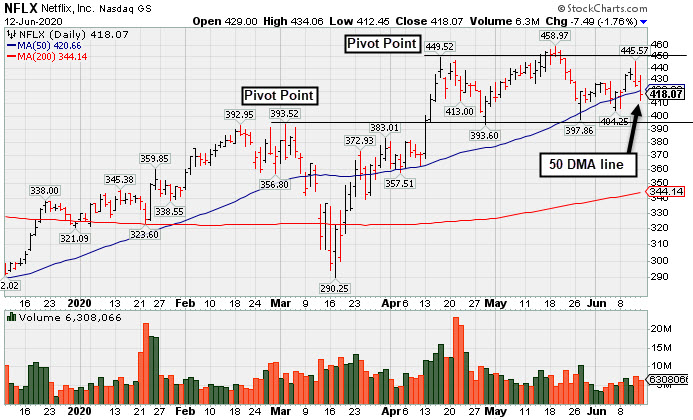
Weak Action Led to 50-Day Moving Average Violation
Kenneth J. Gruneisen - Passed the CAN SLIM® Master's Exam
Netflix Inc (NFLX -$7.49 or -1.76% to $418.07) fell further today after today a "negative reversal" on Thursday amid widespread market weakness. Concerns were raised as it closed just below its 50-day moving average (DMA) line ($420.66) which had acted as support in recent weeks. More damaging losses below prior lows would trigger a more worrisome technical sell signal. A rebound and subsequent gains above the new pivot point cited must be backed by at least +40% above average volume to trigger a proper new (or add-on) technical buy signal. Fundamentals remain strong after it reported earnings +107% on +28% sales revenues for the Mar '20 quarter versus the year ago period, its 3rd consecutive quarterly comparison well above the +25% minimum guideline (C criteria). NFLX finished strong after it was highlighted in yellow with pivot point cited based on its 3/03/20 high plus 10 cents in the 4/13/20 mid-day report (read here). The gain above the pivot point was backed by +55% above average volume and triggered a technical buy signal. NFLX was last shown in this FSU section on 5/21/20 with an annotated graph under the headline, "Pulling Back After Brief New Base Formation". A previously noted downturn in FY '15 earnings (A criteria) has been followed by very strong growth. The number of top-rated funds owning its shares (I criteria) rose from 1,534 in Mar '17 to 2,409 in Mar '20, a reassuring sign concerning the I criteria. The company has 422.2 million shares in the public float (S criteria) which can make it a less likely sprinter. It has a Timeliness rating of A, a Sponsorship rating of B, and an Accumulation/Distribution Rating of B-. Charts courtesy of www.stockcharts.com
 |
|
|
Color Codes Explained :
Y - Better candidates highlighted by our
staff of experts.
G - Previously featured
in past reports as yellow but may no longer be buyable under the
guidelines.
***Last / Change / Volume data in this table is the closing quote data***
Symbol/Exchange
Company Name
Industry Group |
PRICE |
CHANGE
(%Change) |
Day High |
Volume
(% DAV)
(% 50 day avg vol) |
52 Wk Hi
% From Hi |
Featured
Date |
Price
Featured |
Pivot Featured |
|
Max Buy |
 FTNT
-
NASDAQ
FTNT
-
NASDAQ
Fortinet Inc
Computer Sftwr-Security
|
$130.34
|
-1.39
-1.06% |
$135.77
|
1,150,814
60.99% of 50 DAV
50 DAV is 1,887,000
|
$149.69
-12.93%
|
5/7/2020
|
$134.40
|
PP = $121.92
|
|
MB = $128.02
|
Most Recent Note - 6/11/2020 5:30:12 PM
G - Closed -12% off its all-time high with light volume behind yet another loss. Its 50 DMA line ($122.84) and prior highs in the $121 area define important near-term support to watch.
>>> FEATURED STOCK ARTICLE : Extended From Prior Base and Holding Ground Stubbornly - 5/22/2020 |
View all notes |
Set NEW NOTE alert |
Company Profile |
SEC
News |
Chart |
Request a new note
C
A
S
I |
EBS
-
NYSE
Emergent Biosolutions
DRUGS - Biotechnology
|
$68.78
|
+0.67
0.98% |
$70.81
|
793,157
132.63% of 50 DAV
50 DAV is 598,000
|
$93.58
-26.50%
|
6/1/2020
|
$72.10
|
PP = $90.10
|
|
MB = $94.61
|
Most Recent Note - 6/11/2020 5:26:22 PM
G - Suffered another loss with above average volume and sank below recent lows. Only a prompt rebound above the 50 DMA line ($74.93) would help its outlook improve. Fundamentals remain strong.
>>> FEATURED STOCK ARTICLE : Volume Light Behind Recent Pullback From All-Time High - 5/26/2020 |
View all notes |
Set NEW NOTE alert |
Company Profile |
SEC
News |
Chart |
Request a new note
C
A
S
I |
NBIX
-
NASDAQ
Neurocrine Biosciences
DRUGS - Biotechnology
|
$114.82
|
+1.66
1.47% |
$115.77
|
709,272
85.15% of 50 DAV
50 DAV is 833,000
|
$128.29
-10.50%
|
5/19/2020
|
$123.71
|
PP = $119.75
|
|
MB = $125.74
|
Most Recent Note - 6/11/2020 5:20:28 PM
G - Gapped down today slumping further into the previously noted base raising greater concerns. Recent quarterly comparisons through Mar '20 showed greatly improved sales revenues and earnings increases versus year ago periods (C criteria). After years of losses it reported solid annual earnings (A criteria) in FY '18 and '19.
>>> FEATURED STOCK ARTICLE : Pullback Into Prior Base Negated Recent Breakout - 6/8/2020 |
View all notes |
Set NEW NOTE alert |
Company Profile |
SEC
News |
Chart |
Request a new note
C
A
S
I |
AMD
-
NASDAQ
Advanced Micro Devices
ELECTRONICS - Semiconductor - Broad Line
|
$53.50
|
+0.67
1.27% |
$55.60
|
71,055,196
104.18% of 50 DAV
50 DAV is 68,204,000
|
$59.27
-9.74%
|
6/9/2020
|
$55.41
|
PP = $56.98
|
|
MB = $59.83
|
Most Recent Note - 6/11/2020 5:16:53 PM
Y - Abruptly retreated near its 50 DMA line ($52.97) with volume +15% above average behind today's big loss. Subsequent gains above the pivot point backed by at least +40% above average volume are still needed to trigger a convincing technical buy signal. Previously met stubborn resistance in the $57-59 area. Gains into new high territory may mark the beginning of a substantial leg higher. The 3 latest quarterly comparisons through Mar '20 showed very strong earnings increases with greatly improved sales revenues growth in the Dec '19 and Mar '20 comparisons versus the year ago period.
>>> FEATURED STOCK ARTICLE : Big Chip Firm Showing Strong Sales Revenues and Earnings Increases - 6/9/2020 |
View all notes |
Set NEW NOTE alert |
Company Profile |
SEC
News |
Chart |
Request a new note
C
A
S
I |
TREX
-
NYSE
Trex Company Inc
MATERIALS and CONSTRUCTION - General Building Materials
|
$112.67
|
-1.16
-1.02% |
$118.72
|
1,082,437
106.43% of 50 DAV
50 DAV is 1,017,000
|
$132.84
-15.18%
|
5/5/2020
|
$109.05
|
PP = $111.95
|
|
MB = $117.55
|
Most Recent Note - 6/11/2020 5:11:27 PM
Y - Pulled back below its "max buy" level with today's big loss with near average volume and its color code is changed to yellow. Prior highs in the $111 area define initial support to watch. Fundamentals remain strong. See the latest FSU analysis for more details and a new annotated graph.
>>> FEATURED STOCK ARTICLE : Pullback Toward Prior Highs Which Define Near-Term Support - 6/11/2020 |
View all notes |
Set NEW NOTE alert |
Company Profile |
SEC
News |
Chart |
Request a new note
C
A
S
I |
Symbol/Exchange
Company Name
Industry Group |
PRICE |
CHANGE
(%Change) |
Day High |
Volume
(% DAV)
(% 50 day avg vol) |
52 Wk Hi
% From Hi |
Featured
Date |
Price
Featured |
Pivot Featured |
|
Max Buy |
NFLX
-
NASDAQ
Netflix Inc
SPECIALTY RETAIL - Music and Video Stores
|
$418.07
|
-7.49
-1.76% |
$434.06
|
6,455,608
79.26% of 50 DAV
50 DAV is 8,145,000
|
$458.97
-8.91%
|
5/14/2020
|
$441.95
|
PP = $449.62
|
|
MB = $472.10
|
 Most Recent Note - 6/12/2020 6:02:10 PM
G - Fell further today after a "negative reversal" on the prior session amid widespread market weakness. Closed below its 50 DMA line ($420.66) raising concerns and its color code was changed to green. Damaging losses below prior lows would trigger a more worrisome technical sell signal. See the latest FSU analysis for more details and a new annotated graph.
>>> FEATURED STOCK ARTICLE : Weak Action Led to 50-Day Moving Average Violation - 6/12/2020 |
View all notes |
Set NEW NOTE alert |
Company Profile |
SEC
News |
Chart |
Request a new note
C
A
S
I |
NOW
-
NYSE
Servicenow Inc
Computer Sftwr-Enterprse
|
$385.13
|
+10.08
2.69% |
$392.38
|
1,555,577
68.23% of 50 DAV
50 DAV is 2,280,000
|
$405.53
-5.03%
|
4/30/2020
|
$343.05
|
PP = $363.05
|
|
MB = $381.20
|
Most Recent Note - 6/12/2020 6:05:40 PM
G - Posted a gain with lighter volume today and its color code is changed to green after rising back above the "max buy" level. Recent gains above the pivot point were not backed by the +40% above average volume necessary to clinch a proper technical buy signal. Prior highs in the $362 area define initial support to watch on pullbacks.
>>> FEATURED STOCK ARTICLE : Quiet Pullback Below "Max Buy" Level for NOW - 6/4/2020 |
View all notes |
Set NEW NOTE alert |
Company Profile |
SEC
News |
Chart |
Request a new note
C
A
S
I |
QLYS
-
NASDAQ
Qualys Inc
Computer Sftwr-Security
|
$103.11
|
+0.83
0.81% |
$104.97
|
516,783
95.88% of 50 DAV
50 DAV is 539,000
|
$119.20
-13.50%
|
4/9/2020
|
$100.44
|
PP = $97.22
|
|
MB = $102.08
|
Most Recent Note - 6/11/2020 5:24:43 PM
G - Suffered another damaging loss today with higher volume (near average) as it violated its 50 DMA line ($105.42) triggering a technical sell signal. Only a prompt rebound above the 50 DMA line would help its outlook improve. Fundamentals remain strong.
>>> FEATURED STOCK ARTICLE : Qualys is Extended From Prior Base and Perched Near All-Time High - 5/29/2020 |
View all notes |
Set NEW NOTE alert |
Company Profile |
SEC
News |
Chart |
Request a new note
C
A
S
I |
TEAM
-
NASDAQ
Atlassian Corp Plc Cl A
Comp Sftwr-Spec Enterprs
|
$171.62
|
-1.88
-1.08% |
$179.53
|
1,562,259
80.86% of 50 DAV
50 DAV is 1,932,000
|
$191.72
-10.48%
|
5/4/2020
|
$159.70
|
PP = $156.22
|
|
MB = $164.03
|
Most Recent Note - 6/11/2020 5:32:17 PM
G - Consolidating above its 50 DMA line ($163.22) which defines important near-term support above prior highs in the $156 area.
>>> FEATURED STOCK ARTICLE : Positive Reversal Near Prior High and 50 DMA Line - 6/5/2020 |
View all notes |
Set NEW NOTE alert |
Company Profile |
SEC
News |
Chart |
Request a new note
C
A
S
I |
TTD
-
NASDAQ
The Trade Desk Inc Cl A
Comml Svcs-Advertising
|
$354.51
|
+6.97
2.01% |
$363.50
|
1,299,792
58.63% of 50 DAV
50 DAV is 2,217,000
|
$372.88
-4.93%
|
6/3/2020
|
$240.61
|
PP = $327.35
|
|
MB = $343.72
|
Most Recent Note - 6/11/2020 5:13:33 PM
G - Pulled back today with below average volume as it slumped toward its "max buy" level. Prior highs in the $327 area define important near-term support.
>>> FEATURED STOCK ARTICLE : Trade Desk Posts Powerful Gain for New High - 6/3/2020 |
View all notes |
Set NEW NOTE alert |
Company Profile |
SEC
News |
Chart |
Request a new note
C
A
S
I |
Symbol/Exchange
Company Name
Industry Group |
PRICE |
CHANGE
(%Change) |
Day High |
Volume
(% DAV)
(% 50 day avg vol) |
52 Wk Hi
% From Hi |
Featured
Date |
Price
Featured |
Pivot Featured |
|
Max Buy |
DOCU
-
NASDAQ
Docusign Inc
Computer Sftwr-Enterprse
|
$150.60
|
+1.70
1.14% |
$155.14
|
3,982,498
100.62% of 50 DAV
50 DAV is 3,958,000
|
$154.00
-2.21%
|
6/10/2020
|
$149.73
|
PP = $152.10
|
|
MB = $159.71
|
Most Recent Note - 6/11/2020 12:14:03 PM
Y - Showing strength today amid widespread market weakness. Highlighted in yellow with pivot point cited based on its 5/02/20 high plus 10 cents after forming an advanced "ascending base" marked by 3 pullbacks of 10-20% during its ongoing ascent. Subsequent gains above the pivot point backed by at least +40% above average volume may trigger a new (or add-on) technical buy signal. Reported earnings +71% on +39% sales revenues for the Apr '20 quarter versus the year ago period. The past 3 quarterly comparisons versus the year ago period were well above the +25% minimum guideline (C criteria). After years of losses it had solid earnings in FY '19 and "20 with very strong with solid sales revenues growth. See the latest FSU analysis for more details and an annotated graph.
>>> FEATURED STOCK ARTICLE : Advanced Ascending Base Formed for Strong E-Signature Firm - 6/10/2020 |
View all notes |
Set NEW NOTE alert |
Company Profile |
SEC
News |
Chart |
Request a new note
C
A
S
I |
PING
-
NYSE
Ping Identity Hldg Corp
Computer Sftwr-Security
|
$28.92
|
+1.21
4.37% |
$29.57
|
936,476
77.85% of 50 DAV
50 DAV is 1,203,000
|
$31.91
-9.37%
|
6/1/2020
|
$29.24
|
PP = $29.90
|
|
MB = $31.40
|
Most Recent Note - 6/12/2020 6:07:33 PM
G - Posted a gain with light volume after testing its 20-day moving average line ($27.88). More damaging losses below the prior low ($27.51 on 6/04/20) would raise greater concerns and trigger a more worrisome technical sell signal.
>>> FEATURED STOCK ARTICLE : Strong Gain for New High Backed by 127% Above Average Volume - 6/1/2020 |
View all notes |
Set NEW NOTE alert |
Company Profile |
SEC
News |
Chart |
Request a new note
C
A
S
I |
AAXN
-
NASDAQ
Axon Enterprise Inc
Security/Sfty
|
$94.09
|
+4.08
4.53% |
$97.60
|
1,132,607
113.26% of 50 DAV
50 DAV is 1,000,000
|
$104.90
-10.31%
|
5/8/2020
|
$84.86
|
PP = $90.20
|
|
MB = $94.71
|
Most Recent Note - 6/12/2020 6:04:05 PM
Y - Posted a gain today with near average volume while rebounding near its "max buy" level. Prior highs in the $90-91 area have acted as support following the powerful breakout.
>>> FEATURED STOCK ARTICLE : Quietly Slumping Near 50-Day Moving Average Line - 5/28/2020 |
View all notes |
Set NEW NOTE alert |
Company Profile |
SEC
News |
Chart |
Request a new note
C
A
S
I |
GDDY
-
NYSE
Godaddy Inc Cl A
Computer Sftwr-Enterprse
|
$76.26
|
+0.99
1.32% |
$78.60
|
856,128
54.08% of 50 DAV
50 DAV is 1,583,000
|
$82.47
-7.53%
|
6/2/2020
|
$79.62
|
PP = $82.40
|
|
MB = $86.52
|
Most Recent Note - 6/11/2020 5:31:06 PM
Y - Pulled back today with below average volume for a 3rd consecutive loss. Subsequent gains above the pivot point backed by at least +40% above average volume are needed to trigger a proper technical buy signal. It previously met stubborn resistance in the $82-84 area.
>>> FEATURED STOCK ARTICLE : Godaddy Could Be Ready to Go for New Highs - 6/2/2020 |
View all notes |
Set NEW NOTE alert |
Company Profile |
SEC
News |
Chart |
Request a new note
C
A
S
I |
|
|
|
THESE ARE NOT BUY RECOMMENDATIONS!
Comments contained in the body of this report are technical
opinions only. The material herein has been obtained
from sources believed to be reliable and accurate, however,
its accuracy and completeness cannot be guaranteed.
This site is not an investment advisor, hence it does
not endorse or recommend any securities or other investments.
Any recommendation contained in this report may not
be suitable for all investors and it is not to be deemed
an offer or solicitation on our part with respect to
the purchase or sale of any securities. All trademarks,
service marks and trade names appearing in this report
are the property of their respective owners, and are
likewise used for identification purposes only.
This report is a service available
only to active Paid Premium Members.
You may opt-out of receiving report notifications
at any time. Questions or comments may be submitted
by writing to Premium Membership Services 665 S.E. 10 Street, Suite 201 Deerfield Beach, FL 33441-5634 or by calling 1-800-965-8307
or 954-785-1121.
|
|
|