You are not logged in.
This means you
CAN ONLY VIEW reports that were published prior to Sunday, February 25, 2024.
You
MUST UPGRADE YOUR MEMBERSHIP if you want to see any current reports.
AFTER MARKET UPDATE - WEDNESDAY, JUNE 12TH, 2019
Previous After Market Report Next After Market Report >>>
|
|
|
|
DOW |
-43.68 |
26,004.83 |
-0.17% |
|
Volume |
677,342,280 |
-22% |
|
Volume |
1,947,664,960 |
-7% |
|
NASDAQ |
-29.85 |
7,792.72 |
-0.38% |
|
Advancers |
1,323 |
46% |
|
Advancers |
1,486 |
49% |
|
S&P 500 |
-5.88 |
2,879.84 |
-0.20% |
|
Decliners |
1,523 |
53% |
|
Decliners |
1,557 |
51% |
|
Russell 2000 |
+0.68 |
1,519.79 |
+0.05% |
|
52 Wk Highs |
112 |
|
|
52 Wk Highs |
45 |
|
|
S&P 600 |
-2.21 |
921.83 |
-0.24% |
|
52 Wk Lows |
87 |
|
|
52 Wk Lows |
107 |
|
|
 |
Major Indices Fell With Lighter Volume Totals
Kenneth J. Gruneisen - Passed the CAN SLIM® Master's Exam
Stocks finished lower Wednesday as investors await further trade and monetary policy updates. The Dow dropped 43 points, while the S&P 500 lost 0.2%. The Nasdaq Composite was down 0.4%. The volume totals reported were lighter on the NYSE and on the Nasdaq exchange, indicating less institutional selling conviction. Decliners narrowly led advancers on the NYSE and on the Nasdaq exchange. There were 30 high-ranked companies from the Leaders List hit new 52-week highs and were listed on the BreakOuts Page, versus the total of 59 on the prior session. New 52-week highs totals still outnumbered new 52-week lows on the NYSE, but new lows outnumbered new highs on the Nasdaq exchange. Big gains last Friday marked Day 4 of the new rally attempt, and the major indices (M criteria) established a new "confirmed uptrend" under the fact-based system as the bullish session met the requirements to be a proper follow-through day. The Featured Stocks Page provides the most timely analysis on high-ranked leaders. Charts used courtesy of www.stockcharts.com
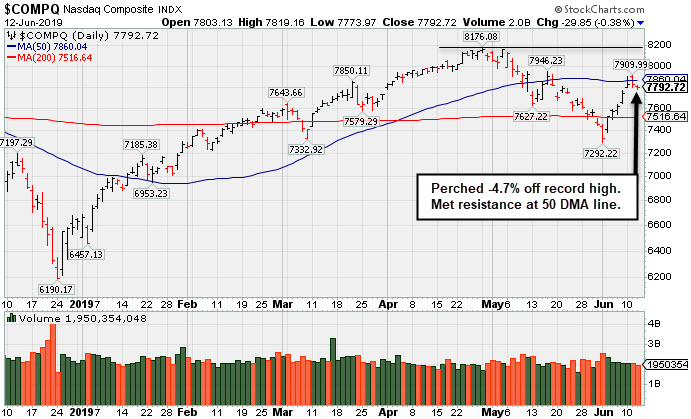
PICTURED: The Nasdaq Composite Index is perched -4.7% off its record high and met resistance at its 50-day moving average (DMA) line while rebounding.
Energy stocks led decliners Wednesday, now the worst-performing S&P 500 sector year-to-date, as oil prices slumped to the lowest since January. WTI crude fell 4% to $51.14/barrel after U.S. crude stockpiles increased to the highest level since 2017. Financials closed nearly 1% lower. Tech shares were pressured by weakness in semiconductors, with the Philadelphia Semiconductor Index slipping 2.3%. Utilities outperformed, with the defensive group up 1.3%.
In earnings, Dave & Busters (PLAY-22.38%) fell after the restaurant and entertainment chain missed analyst profit estimates. In other corporate news, Qualcomm (QCOM -2.32%) fell after the Federal Trade Commission opposed the chip supplier's attempt to delay an antitrust ruling.
Investors digested inflation data ahead of the Federal Reserve’s policy meeting next week. The Consumer Price Index edged 0.1% higher in May, slowing from April’s 0.3% uptick. Meanwhile, core CPI (excluding food and energy) rose at a 2% annualized pace in May, matching the Fed’s target inflation rate. Treasuries strengthened following the weaker-than-anticipated inflation figures, with the yield on the benchmark 10-year note down two basis points to 2.12%. A separate release revealed mortgage applications surged 26.8% in the most recent week.
|
 Kenneth J. Gruneisen started out as a licensed stockbroker in August 1987, a couple of months prior to the historic stock market crash that took the Dow Jones Industrial Average down -22.6% in a single day. He has published daily fact-based fundamental and technical analysis on high-ranked stocks online for two decades. Through FACTBASEDINVESTING.COM, Kenneth provides educational articles, news, market commentary, and other information regarding proven investment systems that work in good times and bad.
Comments contained in the body of this report are technical opinions only and are not necessarily those of Gruneisen Growth Corp. The material herein has been obtained from sources believed to be reliable and accurate, however, its accuracy and completeness cannot be guaranteed. Our firm, employees, and customers may effect transactions, including transactions contrary to any recommendation herein, or have positions in the securities mentioned herein or options with respect thereto. Any recommendation contained in this report may not be suitable for all investors and it is not to be deemed an offer or solicitation on our part with respect to the purchase or sale of any securities. |
|
 |
Oil Services Index Dove; Biotech and Gold & Silver Indexes Rose
Kenneth J. Gruneisen - Passed the CAN SLIM® Master's Exam
The Retail Index ($RLX -0.08%) finished flat while weakness in the Bank Index ($BKX -1.18%) and the Broker/Dealer Index ($XBD -1.50%) weighed on the major indices. The tech sector led lower by weakness in the Semiconductor Index ($SOX -2.33%) and the Networking Index ($NWX -0.38%), meanwhile, the Biotech Index ($BTK +0.62%) posted a modest gain. The Gold & Silver Index ($XAU +1.29%) ended the session higher, meanwhile the Integrated Oil Index ($XOI -1.43%) lost ground and the Oil Services Index ($OSX -5.06%) was a standout decliner. Charts courtesy of www.stockcharts.com
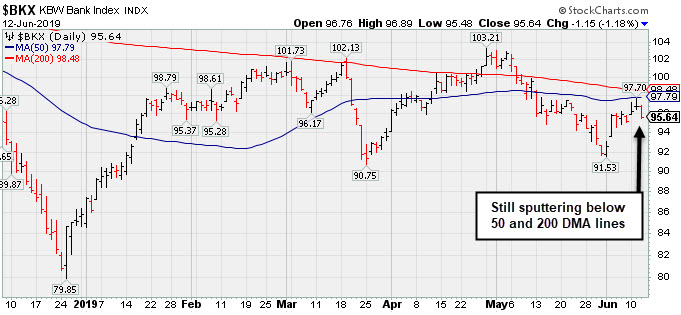 PICTURED: The Bank Index ($BKX -1.18%) is sputtering below its 50-day and 200-day moving average (DMA) lines.
| Oil Services |
$OSX |
72.12 |
-3.84 |
-5.06% |
-10.52% |
| Integrated Oil |
$XOI |
1,197.58 |
-17.39 |
-1.43% |
+3.32% |
| Semiconductor |
$SOX |
1,384.95 |
-33.07 |
-2.33% |
+19.89% |
| Networking |
$NWX |
569.68 |
-2.19 |
-0.38% |
+16.58% |
| Broker/Dealer |
$XBD |
262.79 |
-4.00 |
-1.50% |
+10.72% |
| Retail |
$RLX |
2,308.11 |
-1.79 |
-0.08% |
+18.28% |
| Gold & Silver |
$XAU |
74.86 |
+0.96 |
+1.30% |
+5.94% |
| Bank |
$BKX |
95.64 |
-1.14 |
-1.18% |
+11.48% |
| Biotech |
$BTK |
4,532.27 |
+28.12 |
+0.62% |
+7.38% |
|
|
|
 |
Posted Big Gain for Another New High Close
Kenneth J. Gruneisen - Passed the CAN SLIM® Master's Exam
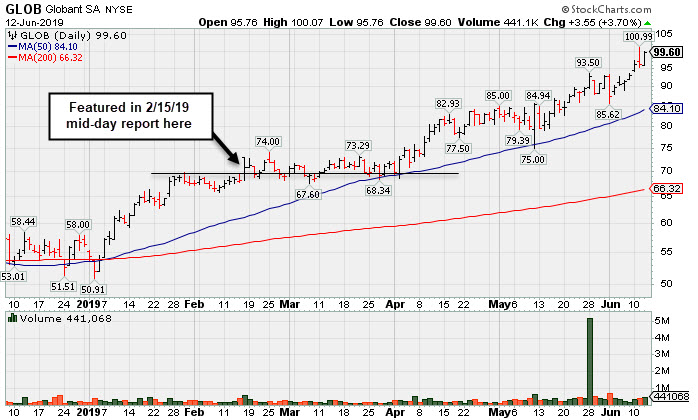
Globant SA (GLOB +$3.55 +3.70% to $99.60) rallied for a big gain today with near average volume for its best-ever close. It is very extended from any sound base. Its 50-day moving average (DMA) line ($84.10) defines important support to watch on pullbacks. A violation would raise concerns and trigger a technical sell signal.
Fundamentals remain strong. Bullish action came after it reported earnings +32% on +22% sales revenues for the quarter ended March 31st, 2019 versus the year ago period, continuing its strong earning track record. GLOB was last shown in this FSU section on 5/07/19 with an annotated graph under the headline, "Earnings News Due While Perched Near All-Time High". It was highlighted in yellow with pivot point cited based on its 1/30/19 high plus 10 cents in the 2/15/19 mid-day report (read here). Prior quarterly comparisons versus the year ago periods were very near or above the +25% minimum earnings guideline (C criteria). It has a strong annual earnings (A criteria) history and has a 95 Earnings Per Share Rating.
This Luxembourg-based Computer - Tech Services firm completed a Secondary Offering on 6/21/18. The number of top-rated funds owning its shares rose from 235 in Mar '18 to 359 in Mar '19, a reassuring sign concerning the I criteria. Its current Up/Down Volume Ratio of 2.6 is an unbiased indication its shares have been under slight accumulation over the past 50 days. It has a Timeliness rating of A and Sponsorship Rating of B. Its small supply of 35.9 million shares outstanding (S criteria) can contribute to greater volatility in the event of institutional buying or selling.
Charts courtesy of www.stockcharts.com
|
|
|
Color Codes Explained :
Y - Better candidates highlighted by our
staff of experts.
G - Previously featured
in past reports as yellow but may no longer be buyable under the
guidelines.
***Last / Change / Volume data in this table is the closing quote data***
Symbol/Exchange
Company Name
Industry Group |
PRICE |
CHANGE
(%Change) |
Day High |
Volume
(% DAV)
(% 50 day avg vol) |
52 Wk Hi
% From Hi |
Featured
Date |
Price
Featured |
Pivot Featured |
|
Max Buy |
 SPSC
-
NASDAQ
SPSC
-
NASDAQ
S P S Commerce Inc
COMPUTER SOFTWARE and SERVICES - Application Software
|
$106.63
|
-0.54
-0.50% |
$107.41
|
64,432
40.27% of 50 DAV
50 DAV is 160,000
|
$115.00
-7.28%
|
6/7/2019
|
$107.72
|
PP = $115.10
|
|
MB = $120.86
|
Most Recent Note - 6/7/2019 6:33:00 PM
Y - Rebounded further above its 50 DMA line ($104) with today's gain on light volume. Color code is changed to yellow with new pivot point cited based on its 4/26/19 high plus 10 cents. Subsequent volume-driven gains above the pivot point are needed to trigger a new (or add-on) technical buy signal. Faces some resistance due to overhead supply up to the $115 level. Recent lows in the $98-99 area define important near-term support to watch. Fundamentals remain strong. See the latest FSU analysis for more details and a new annotated graph.
>>> FEATURED STOCK ARTICLE : Base Building Now Above 50-Day Moving Average Line - 6/7/2019 |
View all notes |
Set NEW NOTE alert |
Company Profile |
SEC
News |
Chart |
Request a new note
C
A
S
I |
EPAM
-
NYSE
Epam Systems Inc
COMPUTER SOFTWARE and SERVICES - Information Technology Service
|
$177.89
|
+0.44
0.25% |
$179.27
|
455,744
91.51% of 50 DAV
50 DAV is 498,000
|
$180.55
-1.47%
|
5/9/2019
|
$169.25
|
PP = $180.55
|
|
MB = $189.58
|
Most Recent Note - 6/7/2019 6:39:59 PM
Y - Color code is changed to yellow after rebounding above its 50 DMA line ($171) helping its outlook to improve. Perched within close striking distance of its 52-week high. Subsequent gains above the pivot point backed by at least +40% above average volume may trigger a new (or add-on) technical buy signal. Fundamentals remain strong.
>>> FEATURED STOCK ARTICLE : Found Support and Closed in Upper Third of Day's Range - 5/9/2019 |
View all notes |
Set NEW NOTE alert |
Company Profile |
SEC
News |
Chart |
Request a new note
C
A
S
I |
ENV
-
NYSE
Envestnet Inc
FINANCIAL SERVICES - Diversified Investments
|
$68.60
|
+1.25
1.86% |
$68.75
|
385,997
133.56% of 50 DAV
50 DAV is 289,000
|
$72.67
-5.60%
|
3/15/2019
|
$66.05
|
PP = $64.90
|
|
MB = $68.15
|
 Most Recent Note - 6/12/2019 12:05:41 PM
G - Violated its 50 DMA line ($68.72) on the prior session with a damaging volume-driven loss raising concerns. Recently reported earnings +5% on +1% sales revenues for the Mar '19 quarter, below the +25% minimum earnings guideline (C criteria). The prior high ($64.80 on 9/14/18) defines important near-term support to watch.
>>> FEATURED STOCK ARTICLE : Rebound Above 50-Day Moving Average Improved Technical Stance - 6/4/2019 |
View all notes |
Set NEW NOTE alert |
Company Profile |
SEC
News |
Chart |
Request a new note
C
A
S
I |
LHCG
-
NASDAQ
L H C Group Inc
HEALTH SERVICES - Home Health Care
|
$115.92
|
+0.79
0.69% |
$116.21
|
153,346
61.83% of 50 DAV
50 DAV is 248,000
|
$122.20
-5.14%
|
4/29/2019
|
$110.94
|
PP = $115.64
|
|
MB = $121.42
|
Most Recent Note - 6/10/2019 5:21:09 PM
Y - Rebounded further above its pivot point with today's gain backed by lighter than average volume. Its 50 DMA line ($111) defines near-term support. Fundamentals remain strong.
>>> FEATURED STOCK ARTICLE : Long-Term Care Firm Hovering Near All-Time High - 5/14/2019 |
View all notes |
Set NEW NOTE alert |
Company Profile |
SEC
News |
Chart |
Request a new note
C
A
S
I |
ENSG
-
NASDAQ
Ensign Group Inc
HEALTH SERVICES - Long-Term Care Facilities
|
$55.00
|
+0.51
0.94% |
$55.29
|
213,129
71.28% of 50 DAV
50 DAV is 299,000
|
$58.14
-5.40%
|
4/30/2019
|
$51.46
|
PP = $53.30
|
|
MB = $55.97
|
Most Recent Note - 6/7/2019 6:46:41 PM
Y - Showing resilience while consolidating above its 50 DMA line ($52.42) and recent lows which define near-term support to watch. Recently reported earnings +22% on +12% sales revenues for the Mar '19 quarter, below the +25% minimum earnings guideline (C criteria), raising fundamental concerns.
>>> FEATURED STOCK ARTICLE : Resilient After Latest Quarterly Report Missed Minimum Guideline - 6/3/2019 |
View all notes |
Set NEW NOTE alert |
Company Profile |
SEC
News |
Chart |
Request a new note
C
A
S
I |
Symbol/Exchange
Company Name
Industry Group |
PRICE |
CHANGE
(%Change) |
Day High |
Volume
(% DAV)
(% 50 day avg vol) |
52 Wk Hi
% From Hi |
Featured
Date |
Price
Featured |
Pivot Featured |
|
Max Buy |
CHDN
-
NASDAQ
Churchill Downs Inc
LEISURE - Gaming Activities
|
$114.39
|
+1.64
1.45% |
$114.40
|
194,858
60.14% of 50 DAV
50 DAV is 324,000
|
$115.36
-0.84%
|
6/5/2019
|
$108.87
|
PP = $104.96
|
|
MB = $110.21
|
Most Recent Note - 6/10/2019 5:25:13 PM
G - Color code is changed to green after rallying above its "max buy" level with today's 8th consecutive gain. Prior highs in the $104 area define initial support to watch on pullbacks. Share price was impacted by a 3:1 split when last noted on 1/28/19.
>>> FEATURED STOCK ARTICLE : Consolidating Near 50-Day Moving Average - 6/29/2018 |
View all notes |
Set NEW NOTE alert |
Company Profile |
SEC
News |
Chart |
Request a new note
C
A
S
I |
LULU
-
NASDAQ
Lululemon Athletica
MANUFACTURING - Textile Manufacturing
|
$170.89
|
-0.74
-0.43% |
$173.45
|
4,346,927
242.44% of 50 DAV
50 DAV is 1,793,000
|
$179.50
-4.80%
|
3/28/2019
|
$169.20
|
PP = $164.89
|
|
MB = $173.13
|
Most Recent Note - 6/12/2019 5:29:03 PM
G - Reported Apr '19 quarterly earnings +35% on +20% sales revenues versus the ear ago period after the close today. Volume and volatility often increase near earnings news. Sputtered below its 50 DMA line ($172). Recent low ($160.88 on 5/29/19) defines important support near prior highs.
>>> FEATURED STOCK ARTICLE : Volume Light While Hovering Near High - 5/10/2019 |
View all notes |
Set NEW NOTE alert |
Company Profile |
SEC
News |
Chart |
Request a new note
C
A
S
I |
ULTA
-
NASDAQ
Ulta Beauty Inc
SPECIALTY RETAIL - Specialty Retail, Other
|
$342.82
|
+2.81
0.83% |
$343.88
|
478,577
67.12% of 50 DAV
50 DAV is 713,000
|
$359.69
-4.69%
|
3/15/2019
|
$341.27
|
PP = $322.59
|
|
MB = $338.72
|
Most Recent Note - 6/6/2019 4:56:13 PM
G - Posted a 3rd consecutive gain today with light volume. Still needs gains above its 50 DMA line ($345) for its outlook to improve. Rebounded from a deep early loss on 5/31/19 after gapping down. Reported earnings +17% on +13% sales revenues for the Apr '19 quarter, below the +25% minimum earnings guideline (C criteria), raising fundamental concerns. Faces resistance due to overhead supply up to the $359 level. See the latest FSU analysis for more details and a new annotated graph.
>>> FEATURED STOCK ARTICLE : Sputtering Below 50-Day Moving Average Following Sub Par Earnings - 6/6/2019 |
View all notes |
Set NEW NOTE alert |
Company Profile |
SEC
News |
Chart |
Request a new note
C
A
S
I |
ESNT
-
NYSE
Essent Group Ltd
Finance-MrtgandRel Svc
|
$48.59
|
-0.39
-0.80% |
$49.33
|
347,471
58.40% of 50 DAV
50 DAV is 595,000
|
$50.51
-3.80%
|
3/18/2019
|
$45.84
|
PP = $45.06
|
|
MB = $47.31
|
Most Recent Note - 6/10/2019 12:00:53 PM
G - Hitting a new all-time high today and its color code is changed to green after rising above its "max buy" level. Found support above its 50 DMA line ($46.79) during its consolidation in recent months. Recently reported earnings +15% on +20% sales revenues for the Mar '19 quarter, below the +25% minimum earnings guideline (C criteria), raising fundamental concerns.
>>> FEATURED STOCK ARTICLE : Still Hovering Not Far From 52-Week High - 6/5/2019 |
View all notes |
Set NEW NOTE alert |
Company Profile |
SEC
News |
Chart |
Request a new note
C
A
S
I |
NOW
-
NYSE
Servicenow Inc
Computer Sftwr-Enterprse
|
$267.88
|
+1.59
0.60% |
$270.34
|
941,678
53.23% of 50 DAV
50 DAV is 1,769,000
|
$281.74
-4.92%
|
4/22/2019
|
$242.64
|
PP = $251.75
|
|
MB = $264.34
|
Most Recent Note - 6/11/2019 5:52:38 PM
G - Pulled back abruptly today following 5 consecutive gains. Its 50 DMA line ($258.77) and prior high ($251.65 on 3/21/19) define near-term support to watch. Recently reported earnings +20% on +34% sales revenues for the Mar '19 quarter, below the +25% minimum earnings guideline (C criteria), raising fundamental concerns.
>>> FEATURED STOCK ARTICLE : Leader Consolidating Above 50-Day Moving Average Line - 5/29/2019 |
View all notes |
Set NEW NOTE alert |
Company Profile |
SEC
News |
Chart |
Request a new note
C
A
S
I |
Symbol/Exchange
Company Name
Industry Group |
PRICE |
CHANGE
(%Change) |
Day High |
Volume
(% DAV)
(% 50 day avg vol) |
52 Wk Hi
% From Hi |
Featured
Date |
Price
Featured |
Pivot Featured |
|
Max Buy |
QLYS
-
NASDAQ
Qualys Inc
Computer Sftwr-Security
|
$87.23
|
+1.10
1.28% |
$87.38
|
181,582
57.76% of 50 DAV
50 DAV is 314,400
|
$98.30
-11.26%
|
5/23/2019
|
$90.43
|
PP = $98.40
|
|
MB = $103.32
|
Most Recent Note - 6/10/2019 5:16:38 PM
G - Rebounded above its 50 ($86.05) today after finding prompt support near its 200 DMA line, however, its Relative Strength Rating is 72, below the 80+ minimum guideline for buy candidates. Met stubborn resistance in the $97-98 area. Reported earnings +36% on +16% sales revenues for the Mar '19 quarter, continuing its strong earnings history.
>>> FEATURED STOCK ARTICLE : Encountering Distributional Pressure in Recent Weeks - 6/11/2019 |
View all notes |
Set NEW NOTE alert |
Company Profile |
SEC
News |
Chart |
Request a new note
C
A
S
I |
VEEV
-
NYSE
Veeva Systems Inc Cl A
Computer Sftwr-Medical
|
$167.02
|
+2.58
1.57% |
$167.92
|
1,693,280
127.99% of 50 DAV
50 DAV is 1,323,000
|
$166.93
0.05%
|
5/30/2019
|
$154.32
|
PP = $145.80
|
|
MB = $153.09
|
Most Recent Note - 6/10/2019 5:18:10 PM
G - Today's 5th consecutive gain with above average volume leaves it very extended from any sound base. Reported earnings +52% on +25% sales revenues for the Apr '19 quarter, marking its 5th strong quarter with earnings above the +25% minimum guideline (C criteria).
>>> FEATURED STOCK ARTICLE : Big Volume-Driven Gain for New High Following Earnings News - 5/30/2019 |
View all notes |
Set NEW NOTE alert |
Company Profile |
SEC
News |
Chart |
Request a new note
C
A
S
I |
PAYC
-
NYSE
Paycom Software Inc
COMPUTER SOFTWARE and SERVICES - Application Software
|
$214.00
|
+0.17
0.08% |
$214.65
|
654,194
87.58% of 50 DAV
50 DAV is 747,000
|
$230.90
-7.32%
|
2/6/2019
|
$171.66
|
PP = $164.18
|
|
MB = $172.39
|
Most Recent Note - 6/11/2019 5:49:56 PM
G - Pulled back today following a "negative reversal" on the prior session after hitting a new all-time high. Extended from any sound base. Its 50 DMA line ($201) and recent low ($194.84 on 6/03/19) define important near-term support to watch on pullbacks. Reported earnings +25% on +30% sales revenues for the Mar '19 quarter.
>>> FEATURED STOCK ARTICLE : Posted Volume-Driven Gain While Hovering Near All-Time High - 5/31/2019 |
View all notes |
Set NEW NOTE alert |
Company Profile |
SEC
News |
Chart |
Request a new note
C
A
S
I |
PYPL
-
NASDAQ
Paypal Holdings Inc
Finance-CrdtCard/PmtPr
|
$114.50
|
-0.10
-0.09% |
$114.89
|
3,852,707
62.42% of 50 DAV
50 DAV is 6,172,000
|
$117.45
-2.51%
|
1/24/2019
|
$92.56
|
PP = $93.80
|
|
MB = $98.49
|
Most Recent Note - 6/7/2019 6:44:08 PM
G - Managed a best-ever close with near average volume behind today's 4th consecutive gain. It did not form a sound base yet promptly rebounded after violating its 50 DMA line and prior low ($106.52) on 6/03/19 triggering technical sell signals. Recently reported earnings +37% on +12% sales revenues for the Mar '19 quarter, continuing its strong earnings track record.
>>> FEATURED STOCK ARTICLE : Hovering Near All Time High Extended From Any Sound Base - 5/15/2019 |
View all notes |
Set NEW NOTE alert |
Company Profile |
SEC
News |
Chart |
Request a new note
C
A
S
I |
PLNT
-
NYSE
Planet Fitness Inc Cl A
Leisure-Services
|
$78.66
|
+2.06
2.69% |
$78.88
|
1,061,897
74.26% of 50 DAV
50 DAV is 1,430,000
|
$81.76
-3.79%
|
11/7/2018
|
$57.10
|
PP = $55.45
|
|
MB = $58.22
|
Most Recent Note - 6/12/2019 5:31:39 PM
G - Extended from any sound base. Found support above its 50 DMA line ($75.17) and prior low during the recent consolidation. Violations would raise concerns and trigger technical sell signals. Fundamentals remain strong.
>>> FEATURED STOCK ARTICLE : Pulling Back From High After Impressive Rally - 5/23/2019 |
View all notes |
Set NEW NOTE alert |
Company Profile |
SEC
News |
Chart |
Request a new note
C
A
S
I |
Symbol/Exchange
Company Name
Industry Group |
PRICE |
CHANGE
(%Change) |
Day High |
Volume
(% DAV)
(% 50 day avg vol) |
52 Wk Hi
% From Hi |
Featured
Date |
Price
Featured |
Pivot Featured |
|
Max Buy |
BLD
-
NYSE
Topbuild Corp
Bldg-Constr Prds/Misc
|
$80.63
|
-0.10
-0.12% |
$81.60
|
247,920
79.46% of 50 DAV
50 DAV is 312,000
|
$87.21
-7.55%
|
5/17/2019
|
$82.19
|
PP = $87.31
|
|
MB = $91.68
|
Most Recent Note - 6/7/2019 6:36:20 PM
Y - Posted another gain today with light volume. Subsequent gains above the pivot point backed by at least +40% above average volume may trigger a technical buy signal. Fundamentals remain strong.
>>> FEATURED STOCK ARTICLE : Encountered Distributional Pressure Near Prior High - 5/20/2019 |
View all notes |
Set NEW NOTE alert |
Company Profile |
SEC
News |
Chart |
Request a new note
C
A
S
I |
TEAM
-
NASDAQ
Atlassian Corp Plc Cl A
Comp Sftwr-Spec Enterprs
|
$128.97
|
+0.04
0.03% |
$130.73
|
1,334,788
72.66% of 50 DAV
50 DAV is 1,837,000
|
$137.78
-6.39%
|
5/24/2019
|
$129.52
|
PP = $132.09
|
|
MB = $138.69
|
Most Recent Note - 6/7/2019 6:35:11 PM
Y - Posted a 4th consecutive gain today with lighter than average volume and ended at a best-ever close. The 50 DMA line and prior high ($117)define important neat-term support to watch. Reported earnings +133% on +38% sales revenues for the Mar '19 quarter, continuing its strong earnings track record.
>>> FEATURED STOCK ARTICLE : Perched Near All-Time High After "3-Weeks Tight" - 5/24/2019 |
View all notes |
Set NEW NOTE alert |
Company Profile |
SEC
News |
Chart |
Request a new note
C
A
S
I |
UPLD
-
NASDAQ
Upland Software Inc
Computer Sftwr-Enterprse
|
$47.95
|
-1.59
-3.21% |
$49.69
|
977,413
201.53% of 50 DAV
50 DAV is 485,000
|
$54.87
-12.61%
|
6/10/2019
|
$53.30
|
PP = $50.74
|
|
MB = $53.28
|
Most Recent Note - 6/12/2019 5:30:08 PM
Y - Abruptly retreated with 2 volume-driven losses slumping back into the prior base and raising concerns. Near-term support to watch is at its 50 DMA line ($45.42). Highlighted in yellow in the 6/10/19 mid-day report with pivot point cited based on its 5/17/19 high plus 10 cents as it rose from an advanced ascending base. Completed a new Public Offering on 5/08/19. Quarterly comparisons through Mar '19 have shown impressive sales revenues growth and greatly improved earnings increases above the +25% minimum guideline (C criteria).
>>> FEATURED STOCK ARTICLE : Rose From an Advanced Ascending Base - 6/10/2019 |
View all notes |
Set NEW NOTE alert |
Company Profile |
SEC
News |
Chart |
Request a new note
C
A
S
I |
GLOB
-
NYSE
Globant SA
Computer-Tech Services
|
$99.60
|
+3.55
3.70% |
$100.07
|
440,768
114.19% of 50 DAV
50 DAV is 386,000
|
$100.99
-1.38%
|
2/15/2019
|
$69.35
|
PP = $70.00
|
|
MB = $73.50
|
Most Recent Note - 6/12/2019 5:25:52 PM
G - Rallied for a best-ever close with today's big gain on near average volume. Very extended from any sound base. Its 50 DMA line ($84.10) defines important support where a violation would raise concerns and trigger a technical sell signal. Fundamentals remain strong. See the latest FSU analysis for more details and a new annotated graph.
>>> FEATURED STOCK ARTICLE : Posted Big Gain for Another New High Close - 6/12/2019 |
View all notes |
Set NEW NOTE alert |
Company Profile |
SEC
News |
Chart |
Request a new note
C
A
S
I |
|
|
|
THESE ARE NOT BUY RECOMMENDATIONS!
Comments contained in the body of this report are technical
opinions only. The material herein has been obtained
from sources believed to be reliable and accurate, however,
its accuracy and completeness cannot be guaranteed.
This site is not an investment advisor, hence it does
not endorse or recommend any securities or other investments.
Any recommendation contained in this report may not
be suitable for all investors and it is not to be deemed
an offer or solicitation on our part with respect to
the purchase or sale of any securities. All trademarks,
service marks and trade names appearing in this report
are the property of their respective owners, and are
likewise used for identification purposes only.
This report is a service available
only to active Paid Premium Members.
You may opt-out of receiving report notifications
at any time. Questions or comments may be submitted
by writing to Premium Membership Services 665 S.E. 10 Street, Suite 201 Deerfield Beach, FL 33441-5634 or by calling 1-800-965-8307
or 954-785-1121.
|
|
|

