You are not logged in.
This means you
CAN ONLY VIEW reports that were published prior to Tuesday, February 20, 2024.
You
MUST UPGRADE YOUR MEMBERSHIP if you want to see any current reports.
AFTER MARKET UPDATE - THURSDAY, JUNE 11TH, 2020
Previous After Market Report Next After Market Report >>>
|
|
|
|
DOW |
-1,861.82 |
25,128.17 |
-6.90% |
|
Volume |
1,327,685,741 |
+12% |
|
Volume |
5,226,986,400 |
+2% |
|
NASDAQ |
-527.62 |
9,492.73 |
-5.27% |
|
Advancers |
86 |
3% |
|
Advancers |
242 |
7% |
|
S&P 500 |
-188.04 |
3,002.10 |
-5.89% |
|
Decliners |
2,859 |
97% |
|
Decliners |
3,125 |
93% |
|
Russell 2000 |
-111.17 |
1,356.22 |
-7.58% |
|
52 Wk Highs |
8 |
|
|
52 Wk Highs |
25 |
|
|
S&P 600 |
-70.84 |
792.25 |
-8.21% |
|
52 Wk Lows |
4 |
|
|
52 Wk Lows |
11 |
|
|
 |
Decisive Distributional Pressure Whacks Major Indices
Kenneth J. Gruneisen - Passed the CAN SLIM® Master's Exam
The Dow plunged 1,861 points, marking its worst daily performance since mid-March. The S&P 500 declined 5.9% finishing in negative territory for the third consecutive day. Meanwhile, the Nasdaq Composite retreated 5.3%, snapping a four-day winning streak. Decliners decisively led advancers by a 33-1 margin on the NYSE and by almost a 13-1 margin on the Nasdaq exchange. The reported volume totals were higher than the prior session on the NYSE and on the Nasdaq exchange, indicative of a decisive increase in institutional selling pressure. There were 7 high-ranked companies from the Leaders List that hit new 52-week highs and were listed on the BreakOuts Page, down abruptly from the 32 on the prior session. New 52-week highs totals contracted yet still outnumbered new 52-week lows totals on the NYSE and on the Nasdaq exchange. The major indices have clearly seen the recent uptrend come under pressure (M criteria). Any sustainable rally requires a healthy crop of new leaders, so the abrupt contraction in new highs totals is a worrisome sign. Charts used courtesy of www.stockcharts.com
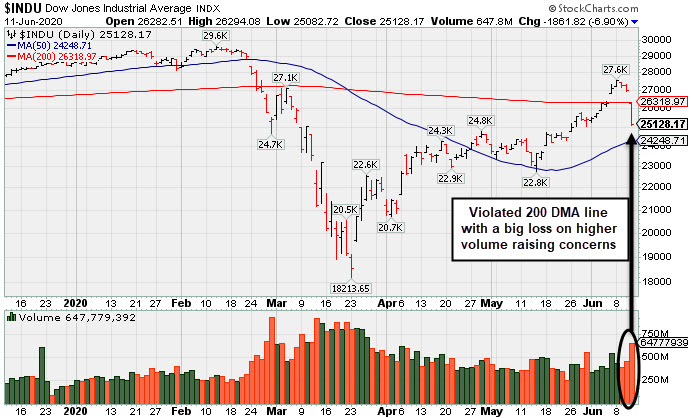
PICTURED: The Dow Jones Industrial Average fell on higher volume and slumped back below its 200-day moving average (DMA) line.
U.S. equities finished sharply lower Thursday, as renewed concerns surrounding a possible second wave of coronavirus in some states dampened recent optimism tied to easing lockdown measures. Cautious commentary from the Federal Reserve on Wednesday, along with concerns about the speed of the rebound also weighed on investor sentiment.
Amid the perceived “risk-off” mood, Treasuries strengthened with the yield on the 10-year note slipping six basis points to 0.66%. This extends yesterday’s 10 basis points drop, which was the maturity’s biggest daily decline in nearly two months. Despite a strong dollar, COMEX gold also caught a bid, rising 1.1% to $1,731.30/ounce. On the data front, initial jobless claims came in at 1.5 million in the week ending June 6, easing from the prior period’s upwardly revised 1.9 million reading.
All 11 S&P 500 sectors fell at least 3.5%, with Energy stocks leading the retreat as WTI crude slumped 8.4% to $35.86/barrel. Airliners, hotels, and cruise operators, which were more vulnerable during the coronavirus-inspired rout, saw steep declines. Financials also underperformed, with the KBW Bank Index slipping 9.0%. Elsewhere, Apple (AAPL -4.78%) and Microsoft (MSFT -5.37%) slumped, a day after both Tech giants closed at fresh all-time highs. Meanwhile, shares of Zoom Video (ZM +0.48%) was the lone advancer in the Nasdaq 100. |
 Kenneth J. Gruneisen started out as a licensed stockbroker in August 1987, a couple of months prior to the historic stock market crash that took the Dow Jones Industrial Average down -22.6% in a single day. He has published daily fact-based fundamental and technical analysis on high-ranked stocks online for two decades. Through FACTBASEDINVESTING.COM, Kenneth provides educational articles, news, market commentary, and other information regarding proven investment systems that work in good times and bad.
Comments contained in the body of this report are technical opinions only and are not necessarily those of Gruneisen Growth Corp. The material herein has been obtained from sources believed to be reliable and accurate, however, its accuracy and completeness cannot be guaranteed. Our firm, employees, and customers may effect transactions, including transactions contrary to any recommendation herein, or have positions in the securities mentioned herein or options with respect thereto. Any recommendation contained in this report may not be suitable for all investors and it is not to be deemed an offer or solicitation on our part with respect to the purchase or sale of any securities. |
|
 |
Financial, Commodity, Tech, and Retail Indexes Fell
Kenneth J. Gruneisen - Passed the CAN SLIM® Master's Exam
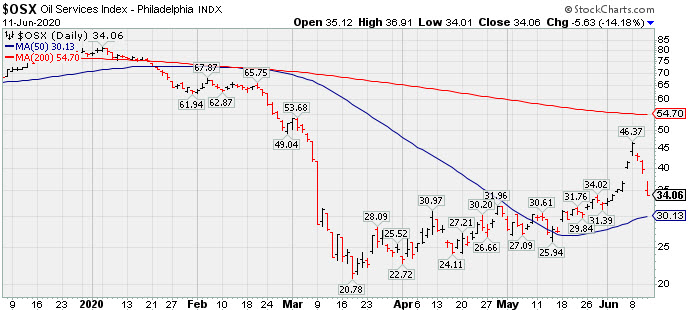
The Bank Index ($BKX -9.00%) outpaced the Broker/Dealer Index ($XBD -7.11%) to the downside while the Retail Index ($RLX -4.00%) also sank. The tech sector had a negative bias as the Biotech Index ($BTK -4.78%), Semiconductor Index ($SOX -6.39%) and the Networking Index ($NWX -7.03%) fell. Commodity-linked groups were big decliners as the Oil Services Index ($OSX -14.18%) and the Integrated Oil Index ($XOI -9.65%) both fell abruptly, and the Gold & Silver Index ($XAU -6.19%) rounded out the widely negative session with a big loss.
PICTURED: The Oil Services Index ($OSX -14.18%) had been approaching its 200-day moving average (DMA) line, but it has abruptly slumped back toward its 50 DM line with 3 consecutive damaging losses.
| Oil Services |
$OSX |
34.06 |
-5.62 |
-14.16% |
-56.50% |
| Integrated Oil |
$XOI |
792.11 |
-84.59 |
-9.65% |
-37.66% |
| Semiconductor |
$SOX |
1,877.22 |
-127.44 |
-6.36% |
+1.49% |
| Networking |
$NWX |
537.81 |
-40.68 |
-7.03% |
-7.82% |
| Broker/Dealer |
$XBD |
263.53 |
-20.16 |
-7.11% |
-9.25% |
| Retail |
$RLX |
2,835.33 |
-118.28 |
-4.00% |
+15.76% |
| Gold & Silver |
$XAU |
114.84 |
-7.58 |
-6.19% |
+7.41% |
| Bank |
$BKX |
74.96 |
-7.42 |
-9.01% |
-33.87% |
| Biotech |
$BTK |
5,392.42 |
-270.76 |
-4.78% |
+6.41% |
|
|
|
 |
Pullback Toward Prior Highs Which Define Near-Term Support
Kenneth J. Gruneisen - Passed the CAN SLIM® Master's Exam
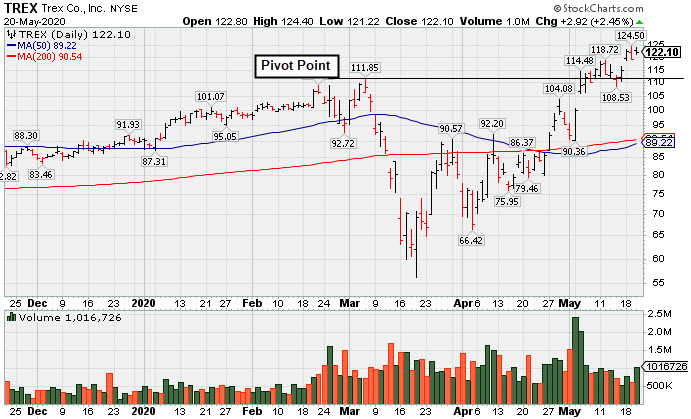
Trex Company Inc (TREX -$8.62 or -7.04% to $113.83) pulled back below its "max buy" level with today's big loss with near average volume and its color code was changed to yellow. Prior highs in the $111 area define initial support to watch.
TREX was highlighted in yellow with pivot point cited based on its 3/05/20 high plus 10 cents in the 5/05/20 mid-day report (read here). It rebounded impressively after a deep slump below its 50-day and 200-day moving average (DMA) lines during the recent market correction. It was last shown in this FSU section on 5/20/20 with an annotated graph under the headline, "Bullish Action Continues for Top Wood Alternative Firm".
Fundamentals remain strong. It has earned the highest possible 99 Earnings Per Share Rating. TREX reported earnings +35% on +12% sales revenues for the Mar '20 quarter versus the year ago period, its 3rd consecutive quarterly comparison above the +25% minimum earnings guideline (C criteria). Annual earnings (A criteria) growth has been strong. The company hails from the General Building Materials industry group which currently has a Group Relative Strength Rating of B+.
The company has a new CEO as of 4/29/20. It has a small supply (S criteria) of only 57.9 million shares outstanding. The number of top-rated funds owning its shares rose from 540 in Jun '19 to 627 in Mar '20, a reassuring sign concerning the I criteria. Its current Up/Down Volume Ratio of 1.6 is an unbiased indication its shares have been under accumulation over the past 50 days. It has a Timeliness rating of A and a Sponsorship Rating of C.
|
|
|
Color Codes Explained :
Y - Better candidates highlighted by our
staff of experts.
G - Previously featured
in past reports as yellow but may no longer be buyable under the
guidelines.
***Last / Change / Volume data in this table is the closing quote data***
Symbol/Exchange
Company Name
Industry Group |
PRICE |
CHANGE
(%Change) |
Day High |
Volume
(% DAV)
(% 50 day avg vol) |
52 Wk Hi
% From Hi |
Featured
Date |
Price
Featured |
Pivot Featured |
|
Max Buy |
 FTNT
-
NASDAQ
FTNT
-
NASDAQ
Fortinet Inc
Computer Sftwr-Security
|
$131.73
|
-5.91
-4.29% |
$137.97
|
1,239,970
64.51% of 50 DAV
50 DAV is 1,922,000
|
$149.69
-12.00%
|
5/7/2020
|
$134.40
|
PP = $121.92
|
|
MB = $128.02
|
 Most Recent Note - 6/11/2020 5:30:12 PM
G - Closed -12% off its all-time high with light volume behind yet another loss. Its 50 DMA line ($122.84) and prior highs in the $121 area define important near-term support to watch.
>>> FEATURED STOCK ARTICLE : Extended From Prior Base and Holding Ground Stubbornly - 5/22/2020 |
View all notes |
Set NEW NOTE alert |
Company Profile |
SEC
News |
Chart |
Request a new note
C
A
S
I |
EBS
-
NYSE
Emergent Biosolutions
DRUGS - Biotechnology
|
$68.11
|
-3.11
-4.37% |
$72.40
|
893,279
151.15% of 50 DAV
50 DAV is 591,000
|
$93.58
-27.22%
|
6/1/2020
|
$72.10
|
PP = $90.10
|
|
MB = $94.61
|
Most Recent Note - 6/11/2020 5:26:22 PM
G - Suffered another loss with above average volume and sank below recent lows. Only a prompt rebound above the 50 DMA line ($74.93) would help its outlook improve. Fundamentals remain strong.
>>> FEATURED STOCK ARTICLE : Volume Light Behind Recent Pullback From All-Time High - 5/26/2020 |
View all notes |
Set NEW NOTE alert |
Company Profile |
SEC
News |
Chart |
Request a new note
C
A
S
I |
NBIX
-
NASDAQ
Neurocrine Biosciences
DRUGS - Biotechnology
|
$113.16
|
-5.18
-4.38% |
$116.85
|
650,679
76.96% of 50 DAV
50 DAV is 845,500
|
$128.29
-11.79%
|
5/19/2020
|
$123.71
|
PP = $119.75
|
|
MB = $125.74
|
Most Recent Note - 6/11/2020 5:20:28 PM
G - Gapped down today slumping further into the previously noted base raising greater concerns. Recent quarterly comparisons through Mar '20 showed greatly improved sales revenues and earnings increases versus year ago periods (C criteria). After years of losses it reported solid annual earnings (A criteria) in FY '18 and '19.
>>> FEATURED STOCK ARTICLE : Pullback Into Prior Base Negated Recent Breakout - 6/8/2020 |
View all notes |
Set NEW NOTE alert |
Company Profile |
SEC
News |
Chart |
Request a new note
C
A
S
I |
AMD
-
NASDAQ
Advanced Micro Devices
ELECTRONICS - Semiconductor - Broad Line
|
$52.83
|
-4.61
-8.03% |
$56.68
|
78,173,703
114.46% of 50 DAV
50 DAV is 68,300,000
|
$59.27
-10.87%
|
6/9/2020
|
$55.41
|
PP = $56.98
|
|
MB = $59.83
|
Most Recent Note - 6/11/2020 5:16:53 PM
Y - Abruptly retreated near its 50 DMA line ($52.97) with volume +15% above average behind today's big loss. Subsequent gains above the pivot point backed by at least +40% above average volume are still needed to trigger a convincing technical buy signal. Previously met stubborn resistance in the $57-59 area. Gains into new high territory may mark the beginning of a substantial leg higher. The 3 latest quarterly comparisons through Mar '20 showed very strong earnings increases with greatly improved sales revenues growth in the Dec '19 and Mar '20 comparisons versus the year ago period.
>>> FEATURED STOCK ARTICLE : Big Chip Firm Showing Strong Sales Revenues and Earnings Increases - 6/9/2020 |
View all notes |
Set NEW NOTE alert |
Company Profile |
SEC
News |
Chart |
Request a new note
C
A
S
I |
TREX
-
NYSE
Trex Company Inc
MATERIALS and CONSTRUCTION - General Building Materials
|
$113.83
|
-8.62
-7.04% |
$117.93
|
937,092
91.96% of 50 DAV
50 DAV is 1,019,000
|
$132.84
-14.31%
|
5/5/2020
|
$109.05
|
PP = $111.95
|
|
MB = $117.55
|
Most Recent Note - 6/11/2020 5:11:27 PM
Y - Pulled back below its "max buy" level with today's big loss with near average volume and its color code is changed to yellow. Prior highs in the $111 area define initial support to watch. Fundamentals remain strong. See the latest FSU analysis for more details and a new annotated graph.
>>> FEATURED STOCK ARTICLE : Pullback Toward Prior Highs Which Define Near-Term Support - 6/11/2020 |
View all notes |
Set NEW NOTE alert |
Company Profile |
SEC
News |
Chart |
Request a new note
C
A
S
I |
Symbol/Exchange
Company Name
Industry Group |
PRICE |
CHANGE
(%Change) |
Day High |
Volume
(% DAV)
(% 50 day avg vol) |
52 Wk Hi
% From Hi |
Featured
Date |
Price
Featured |
Pivot Featured |
|
Max Buy |
NFLX
-
NASDAQ
Netflix Inc
SPECIALTY RETAIL - Music and Video Stores
|
$425.56
|
-8.92
-2.05% |
$445.57
|
7,419,231
90.67% of 50 DAV
50 DAV is 8,183,000
|
$458.97
-7.28%
|
5/14/2020
|
$441.95
|
PP = $449.62
|
|
MB = $472.10
|
Most Recent Note - 6/11/2020 5:22:10 PM
Y - Erased a solid gain today with a "negative reversal" amid widespread market weakness. Found prompt support near its 50 DMA line ($419.58) in recent weeks while volume totals cooled. More damaging losses leading to a violation would trigger a technical sell signal. Subsequent gains above the pivot point must be backed by at least +40% above average volume to trigger a proper new (or add-on) technical buy signal. Fundamentals remain strong.
>>> FEATURED STOCK ARTICLE : Pulling Back After Brief New Base Formation - 5/21/2020 |
View all notes |
Set NEW NOTE alert |
Company Profile |
SEC
News |
Chart |
Request a new note
C
A
S
I |
NOW
-
NYSE
Servicenow Inc
Computer Sftwr-Enterprse
|
$375.05
|
-26.61
-6.63% |
$397.46
|
2,902,796
126.82% of 50 DAV
50 DAV is 2,289,000
|
$405.53
-7.52%
|
4/30/2020
|
$343.05
|
PP = $363.05
|
|
MB = $381.20
|
Most Recent Note - 6/11/2020 5:18:57 PM
Y - Retreated from its all-time high with today's big loss backed by higher volume +27% above average. Color code is changed to yellow after slumping back below the "max buy" level. Recent gains above the pivot point were not backed by the +40% above average volume necessary to clinch a proper technical buy signal. Prior highs in the $362 area define initial support to watch on pullbacks.
>>> FEATURED STOCK ARTICLE : Quiet Pullback Below "Max Buy" Level for NOW - 6/4/2020 |
View all notes |
Set NEW NOTE alert |
Company Profile |
SEC
News |
Chart |
Request a new note
C
A
S
I |
QLYS
-
NASDAQ
Qualys Inc
Computer Sftwr-Security
|
$102.28
|
-5.73
-5.31% |
$107.80
|
519,117
95.96% of 50 DAV
50 DAV is 541,000
|
$119.20
-14.19%
|
4/9/2020
|
$100.44
|
PP = $97.22
|
|
MB = $102.08
|
Most Recent Note - 6/11/2020 5:24:43 PM
G - Suffered another damaging loss today with higher volume (near average) as it violated its 50 DMA line ($105.42) triggering a technical sell signal. Only a prompt rebound above the 50 DMA line would help its outlook improve. Fundamentals remain strong.
>>> FEATURED STOCK ARTICLE : Qualys is Extended From Prior Base and Perched Near All-Time High - 5/29/2020 |
View all notes |
Set NEW NOTE alert |
Company Profile |
SEC
News |
Chart |
Request a new note
C
A
S
I |
TEAM
-
NASDAQ
Atlassian Corp Plc Cl A
Comp Sftwr-Spec Enterprs
|
$173.50
|
-6.53
-3.63% |
$178.69
|
1,430,688
73.98% of 50 DAV
50 DAV is 1,934,000
|
$191.72
-9.50%
|
5/4/2020
|
$159.70
|
PP = $156.22
|
|
MB = $164.03
|
Most Recent Note - 6/11/2020 5:32:17 PM
G - Consolidating above its 50 DMA line ($163.22) which defines important near-term support above prior highs in the $156 area.
>>> FEATURED STOCK ARTICLE : Positive Reversal Near Prior High and 50 DMA Line - 6/5/2020 |
View all notes |
Set NEW NOTE alert |
Company Profile |
SEC
News |
Chart |
Request a new note
C
A
S
I |
TTD
-
NASDAQ
The Trade Desk Inc Cl A
Comml Svcs-Advertising
|
$347.54
|
-20.98
-5.69% |
$364.37
|
1,854,521
83.61% of 50 DAV
50 DAV is 2,218,000
|
$372.88
-6.80%
|
6/3/2020
|
$240.61
|
PP = $327.35
|
|
MB = $343.72
|
Most Recent Note - 6/11/2020 5:13:33 PM
G - Pulled back today with below average volume as it slumped toward its "max buy" level. Prior highs in the $327 area define important near-term support.
>>> FEATURED STOCK ARTICLE : Trade Desk Posts Powerful Gain for New High - 6/3/2020 |
View all notes |
Set NEW NOTE alert |
Company Profile |
SEC
News |
Chart |
Request a new note
C
A
S
I |
Symbol/Exchange
Company Name
Industry Group |
PRICE |
CHANGE
(%Change) |
Day High |
Volume
(% DAV)
(% 50 day avg vol) |
52 Wk Hi
% From Hi |
Featured
Date |
Price
Featured |
Pivot Featured |
|
Max Buy |
DOCU
-
NASDAQ
Docusign Inc
Computer Sftwr-Enterprse
|
$148.90
|
+0.85
0.57% |
$154.00
|
5,542,057
139.00% of 50 DAV
50 DAV is 3,987,000
|
$152.00
-2.04%
|
6/10/2020
|
$149.73
|
PP = $152.10
|
|
MB = $159.71
|
Most Recent Note - 6/11/2020 12:14:03 PM
Y - Showing strength today amid widespread market weakness. Highlighted in yellow with pivot point cited based on its 5/02/20 high plus 10 cents after forming an advanced "ascending base" marked by 3 pullbacks of 10-20% during its ongoing ascent. Subsequent gains above the pivot point backed by at least +40% above average volume may trigger a new (or add-on) technical buy signal. Reported earnings +71% on +39% sales revenues for the Apr '20 quarter versus the year ago period. The past 3 quarterly comparisons versus the year ago period were well above the +25% minimum guideline (C criteria). After years of losses it had solid earnings in FY '19 and "20 with very strong with solid sales revenues growth. See the latest FSU analysis for more details and an annotated graph.
>>> FEATURED STOCK ARTICLE : Advanced Ascending Base Formed for Strong E-Signature Firm - 6/10/2020 |
View all notes |
Set NEW NOTE alert |
Company Profile |
SEC
News |
Chart |
Request a new note
C
A
S
I |
PING
-
NYSE
Ping Identity Hldg Corp
Computer Sftwr-Security
|
$27.71
|
-2.96
-9.65% |
$29.92
|
1,146,193
96.24% of 50 DAV
50 DAV is 1,191,000
|
$31.91
-13.16%
|
6/1/2020
|
$29.24
|
PP = $29.90
|
|
MB = $31.40
|
Most Recent Note - 6/11/2020 3:18:14 PM
G - Color code is changed to green while slumping back into the prior base again with today's big loss on higher volume raising concerns. More damaging losses below the prior low ($27.51 on 6/04/20) would raise greater concerns and trigger a more worrisome technical sell signal.
>>> FEATURED STOCK ARTICLE : Strong Gain for New High Backed by 127% Above Average Volume - 6/1/2020 |
View all notes |
Set NEW NOTE alert |
Company Profile |
SEC
News |
Chart |
Request a new note
C
A
S
I |
AAXN
-
NASDAQ
Axon Enterprise Inc
Security/Sfty
|
$90.01
|
-13.24
-12.82% |
$98.58
|
1,488,828
149.48% of 50 DAV
50 DAV is 996,000
|
$104.90
-14.19%
|
5/8/2020
|
$84.86
|
PP = $90.20
|
|
MB = $94.71
|
Most Recent Note - 6/11/2020 12:09:59 PM
Y - Color code is changed to yellow after abruptly retreating below its "max buy" level today amid widespread market weakness. Prior highs in the $90-91 area acted as support following the powerful breakout last week..
>>> FEATURED STOCK ARTICLE : Quietly Slumping Near 50-Day Moving Average Line - 5/28/2020 |
View all notes |
Set NEW NOTE alert |
Company Profile |
SEC
News |
Chart |
Request a new note
C
A
S
I |
GDDY
-
NYSE
Godaddy Inc Cl A
Computer Sftwr-Enterprse
|
$75.27
|
-4.17
-5.25% |
$77.71
|
989,679
60.31% of 50 DAV
50 DAV is 1,641,000
|
$82.47
-8.73%
|
6/2/2020
|
$79.62
|
PP = $82.40
|
|
MB = $86.52
|
Most Recent Note - 6/11/2020 5:31:06 PM
Y - Pulled back today with below average volume for a 3rd consecutive loss. Subsequent gains above the pivot point backed by at least +40% above average volume are needed to trigger a proper technical buy signal. It previously met stubborn resistance in the $82-84 area.
>>> FEATURED STOCK ARTICLE : Godaddy Could Be Ready to Go for New Highs - 6/2/2020 |
View all notes |
Set NEW NOTE alert |
Company Profile |
SEC
News |
Chart |
Request a new note
C
A
S
I |
|
|
|
THESE ARE NOT BUY RECOMMENDATIONS!
Comments contained in the body of this report are technical
opinions only. The material herein has been obtained
from sources believed to be reliable and accurate, however,
its accuracy and completeness cannot be guaranteed.
This site is not an investment advisor, hence it does
not endorse or recommend any securities or other investments.
Any recommendation contained in this report may not
be suitable for all investors and it is not to be deemed
an offer or solicitation on our part with respect to
the purchase or sale of any securities. All trademarks,
service marks and trade names appearing in this report
are the property of their respective owners, and are
likewise used for identification purposes only.
This report is a service available
only to active Paid Premium Members.
You may opt-out of receiving report notifications
at any time. Questions or comments may be submitted
by writing to Premium Membership Services 665 S.E. 10 Street, Suite 201 Deerfield Beach, FL 33441-5634 or by calling 1-800-965-8307
or 954-785-1121.
|
|
|