You are not logged in.
This means you
CAN ONLY VIEW reports that were published prior to Friday, February 23, 2024.
You
MUST UPGRADE YOUR MEMBERSHIP if you want to see any current reports.
AFTER MARKET UPDATE - MONDAY, JUNE 10TH, 2019
Previous After Market Report Next After Market Report >>>
|
|
|
|
DOW |
+78.74 |
26,062.68 |
+0.30% |
|
Volume |
741,313,560 |
+2% |
|
Volume |
2,018,677,752 |
-2% |
|
NASDAQ |
+81.07 |
7,823.17 |
+1.05% |
|
Advancers |
1,753 |
61% |
|
Advancers |
1,951 |
63% |
|
S&P 500 |
+13.39 |
2,886.73 |
+0.47% |
|
Decliners |
1,108 |
39% |
|
Decliners |
1,133 |
37% |
|
Russell 2000 |
+9.17 |
1,523.56 |
+0.61% |
|
52 Wk Highs |
208 |
|
|
52 Wk Highs |
120 |
|
|
S&P 600 |
+6.71 |
926.60 |
+0.73% |
|
52 Wk Lows |
27 |
|
|
52 Wk Lows |
52 |
|
|
 |
Major Indices Added to New Rally
Kenneth J. Gruneisen - Passed the CAN SLIM® Master's Exam
Stocks finished higher Monday, as an immigration deal between the U.S. and Mexico helped extend last week’s rally. Over the weekend, President Trump announced that proposed tariffs on Mexican goods would be suspended “for now”. The Dow added 78 points, while the S&P 500 and NASDAQ advanced 0.5% and 1.1%, respectively. The volume totals reported were mixed, higher on the NYSE and lighter on the Nasdaq exchange. Advancers led decliners by almost a 3-2 margin on the NYSE and near a 2-1 margin on the Nasdaq exchange. There were 99 high-ranked companies from the Leaders List hit new 52-week highs and were listed on the BreakOuts Page, versus the total of 121 on the prior session. New 52-week highs totals easily outnumbered new 52-week lows on the NYSE on the Nasdaq exchange. Big gains on Friday marked Day 4 of the new rally attempt, and the major indices (M criteria) established a new "confirmed uptrend" under the fact-based system as the bullish session met the requirements to be a proper follow-through day. The Featured Stocks Page provides the most timely analysis on high-ranked leaders. Charts used courtesy of www.stockcharts.com
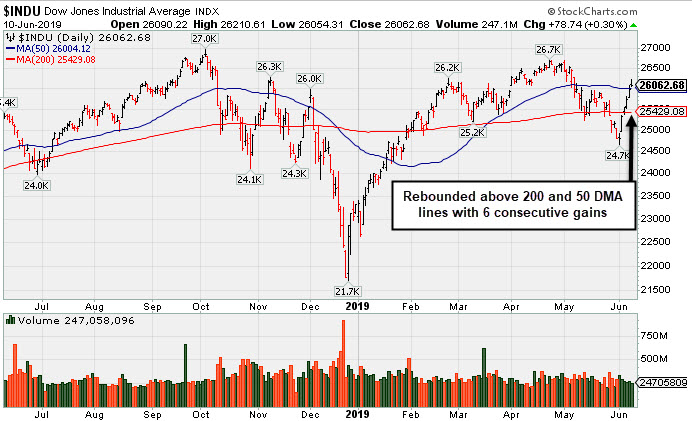
PICTURED: The Dow Jones Industrial Average rebounded above its 200-day and 50-day moving average (DMA) lines with 6 consecutive gains.
Stocks entered the week coming off their best week of the year after a soft non-farm payrolls report increased speculation concerning Fed rate cuts this year. On the data front today, the Jobs Openings and Labor Turnover Survey (JOLTS) showed U.S. job openings declined modestly in April.
Treasuries were weaker, with the yield on the 10-year note up six basis points to 2.14%. In the commodity pits, WTI crude slipped 1.2% to $53.33/barrel despite reports of OPEC’s plan to extend production cuts. COMEX gold fell 1.0%, its first decline in eight sessions.
The Consumer Discretionary sector paced the gains as a rebound in automakers helped the group climb roughly 1.1%. Technology shares also outperformed as Advanced Micro Devices (AMD +2.53%) rose following reports that the new Xbox will contain the chipmaker’s products. In M&A news, United Technologies (UTX -3.13%) fell while Raytheon (RTN +0.69%) rose after the two sides agreed to merge in a $21 billion deal. Meanwhile, Tableau (DATA +33.70%) gapped up to an all-time high after agreeing to be acquired by Salesforce.com (CRM -5.26%) in an all-stock transaction worth $15.3 billion.
|
 Kenneth J. Gruneisen started out as a licensed stockbroker in August 1987, a couple of months prior to the historic stock market crash that took the Dow Jones Industrial Average down -22.6% in a single day. He has published daily fact-based fundamental and technical analysis on high-ranked stocks online for two decades. Through FACTBASEDINVESTING.COM, Kenneth provides educational articles, news, market commentary, and other information regarding proven investment systems that work in good times and bad.
Comments contained in the body of this report are technical opinions only and are not necessarily those of Gruneisen Growth Corp. The material herein has been obtained from sources believed to be reliable and accurate, however, its accuracy and completeness cannot be guaranteed. Our firm, employees, and customers may effect transactions, including transactions contrary to any recommendation herein, or have positions in the securities mentioned herein or options with respect thereto. Any recommendation contained in this report may not be suitable for all investors and it is not to be deemed an offer or solicitation on our part with respect to the purchase or sale of any securities. |
|
 |
Retail, Financial, and Semiconductor Indexes Led Group Gainers
Kenneth J. Gruneisen - Passed the CAN SLIM® Master's Exam
The Retail Index ($RLX +1.66%), Broker/Dealer Index ($XBD +1.21%), and the Bank Index ($BKX +1.14%) posted unanimous gains. The tech sector had a positive bias as the Semiconductor Index ($SOX +2.54%) outpaced the Networking Index ($NWX +0.44%), but the Biotech Index ($BTK -0.39%) fell. The Integrated Oil Index ($XOI +0.45%) edged higher but the Oil Services Index ($OSX -0.18%) and the Gold & Silver Index ($XAU -1.36%) both ended the session in the red. Charts courtesy of www.stockcharts.com
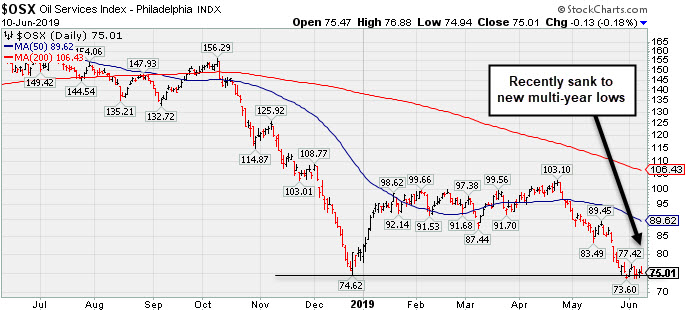 PICTURED: The Oil Services Index ($OSX -0.18%) recently sank below its December 2018 low to new multi-year lows.
| Oil Services |
$OSX |
75.01 |
-0.13 |
-0.17% |
-6.94% |
| Integrated Oil |
$XOI |
1,211.52 |
+5.43 |
+0.45% |
+4.52% |
| Semiconductor |
$SOX |
1,413.89 |
+35.08 |
+2.54% |
+22.40% |
| Networking |
$NWX |
575.29 |
+2.51 |
+0.44% |
+17.73% |
| Broker/Dealer |
$XBD |
266.93 |
+3.18 |
+1.21% |
+12.47% |
| Retail |
$RLX |
2,304.55 |
+37.64 |
+1.66% |
+18.10% |
| Gold & Silver |
$XAU |
73.32 |
-1.01 |
-1.36% |
+3.76% |
| Bank |
$BKX |
96.30 |
+1.09 |
+1.14% |
+12.25% |
| Biotech |
$BTK |
4,516.95 |
-17.61 |
-0.39% |
+7.02% |
|
|
|
 |
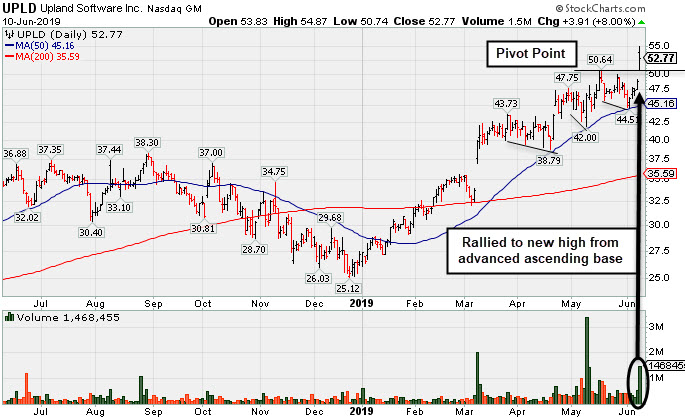
Rose From an Advanced Ascending Base
Kenneth J. Gruneisen - Passed the CAN SLIM® Master's Exam
Upland Software Inc (UPLD +$3.91 or +8.00% to $52.77) was highlighted in yellow in the earlier mid-day report (read here) with pivot point cited based on its 5/17/19 high plus 10 cents after an advanced ascending base. It gapped up today with a big volume-driven gain triggering a technical buy signal. It found support above its 50-day moving average (DMA) line ($45.17) during the recent consolidation.
The number of top-rated funds owning its shares rose from 200 in Jun '18 to 247 in Mar '19, a reassuring sign concerning the I criteria. Its current Up/Down Volume Ratio of 2.0 is an unbiased indication its shares have been under accumulation over the past 50 days. It completed a new Public Offering on 5/08/19. Such offerings often hinder price progress for the short-term, yet they usually serve to attract greater institutional interest. It has a small supply of only 24.8 million shares outstanding (S criteria), which can contribute to greater price volatility in the event of institutional buying or selling.
Quarterly comparisons through Mar '19 have shown impressive sales revenues growth and greatly improved earnings increases above the +25% minimum guideline (C criteria). After years of losses it had a profitable FY '16 and strong annual earnings (A criteria) growth. That helps it better match with the fact-based investment system's fundamental guidelines calling for 3-5 years of strong and steady earnings growth. |
|
|
Color Codes Explained :
Y - Better candidates highlighted by our
staff of experts.
G - Previously featured
in past reports as yellow but may no longer be buyable under the
guidelines.
***Last / Change / Volume data in this table is the closing quote data***
Symbol/Exchange
Company Name
Industry Group |
PRICE |
CHANGE
(%Change) |
Day High |
Volume
(% DAV)
(% 50 day avg vol) |
52 Wk Hi
% From Hi |
Featured
Date |
Price
Featured |
Pivot Featured |
|
Max Buy |
 SPSC
-
NASDAQ
SPSC
-
NASDAQ
S P S Commerce Inc
COMPUTER SOFTWARE and SERVICES - Application Software
|
$108.05
|
+0.33
0.31% |
$109.78
|
104,109
65.89% of 50 DAV
50 DAV is 158,000
|
$115.00
-6.04%
|
6/7/2019
|
$107.72
|
PP = $115.10
|
|
MB = $120.86
|
Most Recent Note - 6/7/2019 6:33:00 PM
Y - Rebounded further above its 50 DMA line ($104) with today's gain on light volume. Color code is changed to yellow with new pivot point cited based on its 4/26/19 high plus 10 cents. Subsequent volume-driven gains above the pivot point are needed to trigger a new (or add-on) technical buy signal. Faces some resistance due to overhead supply up to the $115 level. Recent lows in the $98-99 area define important near-term support to watch. Fundamentals remain strong. See the latest FSU analysis for more details and a new annotated graph.
>>> FEATURED STOCK ARTICLE : Base Building Now Above 50-Day Moving Average Line - 6/7/2019 |
View all notes |
Set NEW NOTE alert |
Company Profile |
SEC
News |
Chart |
Request a new note
C
A
S
I |
EPAM
-
NYSE
Epam Systems Inc
COMPUTER SOFTWARE and SERVICES - Information Technology Service
|
$177.11
|
+0.36
0.20% |
$179.36
|
426,058
86.60% of 50 DAV
50 DAV is 492,000
|
$180.55
-1.91%
|
5/9/2019
|
$169.25
|
PP = $180.55
|
|
MB = $189.58
|
Most Recent Note - 6/7/2019 6:39:59 PM
Y - Color code is changed to yellow after rebounding above its 50 DMA line ($171) helping its outlook to improve. Perched within close striking distance of its 52-week high. Subsequent gains above the pivot point backed by at least +40% above average volume may trigger a new (or add-on) technical buy signal. Fundamentals remain strong.
>>> FEATURED STOCK ARTICLE : Found Support and Closed in Upper Third of Day's Range - 5/9/2019 |
View all notes |
Set NEW NOTE alert |
Company Profile |
SEC
News |
Chart |
Request a new note
C
A
S
I |
ENV
-
NYSE
Envestnet Inc
FINANCIAL SERVICES - Diversified Investments
|
$69.09
|
+0.01
0.01% |
$70.39
|
340,424
120.29% of 50 DAV
50 DAV is 283,000
|
$72.67
-4.93%
|
3/15/2019
|
$66.05
|
PP = $64.90
|
|
MB = $68.15
|
 Most Recent Note - 6/10/2019 5:22:54 PM
G - Consolidating above its 50 DMA line ($68.64). Recently reported earnings +5% on +1% sales revenues for the Mar '19 quarter, below the +25% minimum earnings guideline (C criteria). The prior high ($64.80 on 9/14/18) defines important near-term support to watch.
>>> FEATURED STOCK ARTICLE : Rebound Above 50-Day Moving Average Improved Technical Stance - 6/4/2019 |
View all notes |
Set NEW NOTE alert |
Company Profile |
SEC
News |
Chart |
Request a new note
C
A
S
I |
LHCG
-
NASDAQ
L H C Group Inc
HEALTH SERVICES - Home Health Care
|
$116.23
|
+1.06
0.92% |
$118.20
|
165,901
66.36% of 50 DAV
50 DAV is 250,000
|
$122.20
-4.89%
|
4/29/2019
|
$110.94
|
PP = $115.64
|
|
MB = $121.42
|
Most Recent Note - 6/10/2019 5:21:09 PM
Y - Rebounded further above its pivot point with today's gain backed by lighter than average volume. Its 50 DMA line ($111) defines near-term support. Fundamentals remain strong.
>>> FEATURED STOCK ARTICLE : Long-Term Care Firm Hovering Near All-Time High - 5/14/2019 |
View all notes |
Set NEW NOTE alert |
Company Profile |
SEC
News |
Chart |
Request a new note
C
A
S
I |
ENSG
-
NASDAQ
Ensign Group Inc
HEALTH SERVICES - Long-Term Care Facilities
|
$55.34
|
+0.23
0.42% |
$56.23
|
245,971
81.18% of 50 DAV
50 DAV is 303,000
|
$58.14
-4.82%
|
4/30/2019
|
$51.46
|
PP = $53.30
|
|
MB = $55.97
|
Most Recent Note - 6/7/2019 6:46:41 PM
Y - Showing resilience while consolidating above its 50 DMA line ($52.42) and recent lows which define near-term support to watch. Recently reported earnings +22% on +12% sales revenues for the Mar '19 quarter, below the +25% minimum earnings guideline (C criteria), raising fundamental concerns.
>>> FEATURED STOCK ARTICLE : Resilient After Latest Quarterly Report Missed Minimum Guideline - 6/3/2019 |
View all notes |
Set NEW NOTE alert |
Company Profile |
SEC
News |
Chart |
Request a new note
C
A
S
I |
Symbol/Exchange
Company Name
Industry Group |
PRICE |
CHANGE
(%Change) |
Day High |
Volume
(% DAV)
(% 50 day avg vol) |
52 Wk Hi
% From Hi |
Featured
Date |
Price
Featured |
Pivot Featured |
|
Max Buy |
CHDN
-
NASDAQ
Churchill Downs Inc
LEISURE - Gaming Activities
|
$114.19
|
+1.92
1.71% |
$114.88
|
295,923
91.62% of 50 DAV
50 DAV is 323,000
|
$113.97
0.19%
|
6/5/2019
|
$108.87
|
PP = $104.96
|
|
MB = $110.21
|
Most Recent Note - 6/10/2019 5:25:13 PM
G - Color code is changed to green after rallying above its "max buy" level with today's 8th consecutive gain. Prior highs in the $104 area define initial support to watch on pullbacks. Share price was impacted by a 3:1 split when last noted on 1/28/19.
>>> FEATURED STOCK ARTICLE : Consolidating Near 50-Day Moving Average - 6/29/2018 |
View all notes |
Set NEW NOTE alert |
Company Profile |
SEC
News |
Chart |
Request a new note
C
A
S
I |
LULU
-
NASDAQ
Lululemon Athletica
MANUFACTURING - Textile Manufacturing
|
$171.35
|
-1.14
-0.66% |
$176.38
|
1,893,393
87.98% of 50 DAV
50 DAV is 2,152,000
|
$179.50
-4.54%
|
3/28/2019
|
$169.20
|
PP = $164.89
|
|
MB = $173.13
|
Most Recent Note - 6/6/2019 4:58:41 PM
G - Sputtering near its 50 DMA line ($171) after it found support last week near prior highs. Due to report Apr '19 quarterly earnings news after the close on Wednesday, June 12th. Volume and volatility often increase near earnings news.
>>> FEATURED STOCK ARTICLE : Volume Light While Hovering Near High - 5/10/2019 |
View all notes |
Set NEW NOTE alert |
Company Profile |
SEC
News |
Chart |
Request a new note
C
A
S
I |
ULTA
-
NASDAQ
Ulta Beauty Inc
SPECIALTY RETAIL - Specialty Retail, Other
|
$337.05
|
-1.11
-0.33% |
$344.49
|
560,871
78.22% of 50 DAV
50 DAV is 717,000
|
$359.69
-6.29%
|
3/15/2019
|
$341.27
|
PP = $322.59
|
|
MB = $338.72
|
Most Recent Note - 6/6/2019 4:56:13 PM
G - Posted a 3rd consecutive gain today with light volume. Still needs gains above its 50 DMA line ($345) for its outlook to improve. Rebounded from a deep early loss on 5/31/19 after gapping down. Reported earnings +17% on +13% sales revenues for the Apr '19 quarter, below the +25% minimum earnings guideline (C criteria), raising fundamental concerns. Faces resistance due to overhead supply up to the $359 level. See the latest FSU analysis for more details and a new annotated graph.
>>> FEATURED STOCK ARTICLE : Sputtering Below 50-Day Moving Average Following Sub Par Earnings - 6/6/2019 |
View all notes |
Set NEW NOTE alert |
Company Profile |
SEC
News |
Chart |
Request a new note
C
A
S
I |
ESNT
-
NYSE
Essent Group Ltd
Finance-MrtgandRel Svc
|
$49.34
|
+0.54
1.11% |
$50.51
|
840,143
144.60% of 50 DAV
50 DAV is 581,000
|
$49.47
-0.26%
|
3/18/2019
|
$45.84
|
PP = $45.06
|
|
MB = $47.31
|
Most Recent Note - 6/10/2019 12:00:53 PM
G - Hitting a new all-time high today and its color code is changed to green after rising above its "max buy" level. Found support above its 50 DMA line ($46.79) during its consolidation in recent months. Recently reported earnings +15% on +20% sales revenues for the Mar '19 quarter, below the +25% minimum earnings guideline (C criteria), raising fundamental concerns.
>>> FEATURED STOCK ARTICLE : Still Hovering Not Far From 52-Week High - 6/5/2019 |
View all notes |
Set NEW NOTE alert |
Company Profile |
SEC
News |
Chart |
Request a new note
C
A
S
I |
NOW
-
NYSE
Servicenow Inc
Computer Sftwr-Enterprse
|
$275.87
|
+1.32
0.48% |
$280.56
|
1,235,474
69.96% of 50 DAV
50 DAV is 1,766,000
|
$281.74
-2.08%
|
4/22/2019
|
$242.64
|
PP = $251.75
|
|
MB = $264.34
|
Most Recent Note - 6/6/2019 4:57:26 PM
G - Rebounded further above its 50 DMA line ($257) with lighter volume behind today's 3rd consecutive gain. Found support near the prior high ($251.65 on 3/21/19). Recently reported earnings +20% on +34% sales revenues for the Mar '19 quarter, below the +25% minimum earnings guideline (C criteria), raising concerns, fundamentally.
>>> FEATURED STOCK ARTICLE : Leader Consolidating Above 50-Day Moving Average Line - 5/29/2019 |
View all notes |
Set NEW NOTE alert |
Company Profile |
SEC
News |
Chart |
Request a new note
C
A
S
I |
Symbol/Exchange
Company Name
Industry Group |
PRICE |
CHANGE
(%Change) |
Day High |
Volume
(% DAV)
(% 50 day avg vol) |
52 Wk Hi
% From Hi |
Featured
Date |
Price
Featured |
Pivot Featured |
|
Max Buy |
QLYS
-
NASDAQ
Qualys Inc
Computer Sftwr-Security
|
$88.73
|
+2.84
3.31% |
$89.65
|
308,340
98.76% of 50 DAV
50 DAV is 312,200
|
$98.30
-9.74%
|
5/23/2019
|
$90.43
|
PP = $98.40
|
|
MB = $103.32
|
Most Recent Note - 6/10/2019 5:16:38 PM
G - Rebounded above its 50 ($86.05) today after finding prompt support near its 200 DMA line, however, its Relative Strength Rating is 72, below the 80+ minimum guideline for buy candidates. Met stubborn resistance in the $97-98 area. Reported earnings +36% on +16% sales revenues for the Mar '19 quarter, continuing its strong earnings history.
>>> FEATURED STOCK ARTICLE : Rallying to Challenge Previously Stubborn Resistance - 5/2/2019 |
View all notes |
Set NEW NOTE alert |
Company Profile |
SEC
News |
Chart |
Request a new note
C
A
S
I |
VEEV
-
NYSE
Veeva Systems Inc Cl A
Computer Sftwr-Medical
|
$162.51
|
+0.31
0.19% |
$166.93
|
2,030,836
157.67% of 50 DAV
50 DAV is 1,288,000
|
$164.60
-1.27%
|
5/30/2019
|
$154.32
|
PP = $145.80
|
|
MB = $153.09
|
Most Recent Note - 6/10/2019 5:18:10 PM
G - Today's 5th consecutive gain with above average volume leaves it very extended from any sound base. Reported earnings +52% on +25% sales revenues for the Apr '19 quarter, marking its 5th strong quarter with earnings above the +25% minimum guideline (C criteria).
>>> FEATURED STOCK ARTICLE : Big Volume-Driven Gain for New High Following Earnings News - 5/30/2019 |
View all notes |
Set NEW NOTE alert |
Company Profile |
SEC
News |
Chart |
Request a new note
C
A
S
I |
PAYC
-
NYSE
Paycom Software Inc
COMPUTER SOFTWARE and SERVICES - Application Software
|
$221.91
|
-0.54
-0.24% |
$230.90
|
1,076,802
146.70% of 50 DAV
50 DAV is 734,000
|
$223.89
-0.88%
|
2/6/2019
|
$171.66
|
PP = $164.18
|
|
MB = $172.39
|
Most Recent Note - 6/10/2019 12:18:23 PM
G - Hitting another new all-time high with today's 5th consecutive gain, getting more extended from any sound base. Its 50 DMA line ($200.74) and recent low ($194.84 on 6/03/19) define important near-term support to watch on pullbacks. Reported earnings +25% on +30% sales revenues for the Mar '19 quarter.
>>> FEATURED STOCK ARTICLE : Posted Volume-Driven Gain While Hovering Near All-Time High - 5/31/2019 |
View all notes |
Set NEW NOTE alert |
Company Profile |
SEC
News |
Chart |
Request a new note
C
A
S
I |
PYPL
-
NASDAQ
Paypal Holdings Inc
Finance-CrdtCard/PmtPr
|
$115.62
|
+1.60
1.40% |
$117.35
|
6,449,746
104.99% of 50 DAV
50 DAV is 6,143,000
|
$115.14
0.42%
|
1/24/2019
|
$92.56
|
PP = $93.80
|
|
MB = $98.49
|
Most Recent Note - 6/7/2019 6:44:08 PM
G - Managed a best-ever close with near average volume behind today's 4th consecutive gain. It did not form a sound base yet promptly rebounded after violating its 50 DMA line and prior low ($106.52) on 6/03/19 triggering technical sell signals. Recently reported earnings +37% on +12% sales revenues for the Mar '19 quarter, continuing its strong earnings track record.
>>> FEATURED STOCK ARTICLE : Hovering Near All Time High Extended From Any Sound Base - 5/15/2019 |
View all notes |
Set NEW NOTE alert |
Company Profile |
SEC
News |
Chart |
Request a new note
C
A
S
I |
PLNT
-
NYSE
Planet Fitness Inc Cl A
Leisure-Services
|
$78.29
|
+0.33
0.42% |
$78.93
|
1,175,438
83.13% of 50 DAV
50 DAV is 1,414,000
|
$81.76
-4.24%
|
11/7/2018
|
$57.10
|
PP = $55.45
|
|
MB = $58.22
|
Most Recent Note - 6/10/2019 5:26:43 PM
G - Extended from any sound base. Found support above its 50 DMA line ($74.83) and prior low during the recent consolidation. Violations would raise concerns and trigger technical sell signals. Fundamentals remain strong.
>>> FEATURED STOCK ARTICLE : Pulling Back From High After Impressive Rally - 5/23/2019 |
View all notes |
Set NEW NOTE alert |
Company Profile |
SEC
News |
Chart |
Request a new note
C
A
S
I |
Symbol/Exchange
Company Name
Industry Group |
PRICE |
CHANGE
(%Change) |
Day High |
Volume
(% DAV)
(% 50 day avg vol) |
52 Wk Hi
% From Hi |
Featured
Date |
Price
Featured |
Pivot Featured |
|
Max Buy |
BLD
-
NYSE
Topbuild Corp
Bldg-Constr Prds/Misc
|
$81.99
|
-0.73
-0.88% |
$84.38
|
209,524
67.81% of 50 DAV
50 DAV is 309,000
|
$87.21
-5.99%
|
5/17/2019
|
$82.19
|
PP = $87.31
|
|
MB = $91.68
|
Most Recent Note - 6/7/2019 6:36:20 PM
Y - Posted another gain today with light volume. Subsequent gains above the pivot point backed by at least +40% above average volume may trigger a technical buy signal. Fundamentals remain strong.
>>> FEATURED STOCK ARTICLE : Encountered Distributional Pressure Near Prior High - 5/20/2019 |
View all notes |
Set NEW NOTE alert |
Company Profile |
SEC
News |
Chart |
Request a new note
C
A
S
I |
TEAM
-
NASDAQ
Atlassian Corp Plc Cl A
Comp Sftwr-Spec Enterprs
|
$133.00
|
+1.57
1.19% |
$137.78
|
1,656,472
91.22% of 50 DAV
50 DAV is 1,816,000
|
$132.87
0.10%
|
5/24/2019
|
$129.52
|
PP = $132.09
|
|
MB = $138.69
|
Most Recent Note - 6/7/2019 6:35:11 PM
Y - Posted a 4th consecutive gain today with lighter than average volume and ended at a best-ever close. The 50 DMA line and prior high ($117)define important neat-term support to watch. Reported earnings +133% on +38% sales revenues for the Mar '19 quarter, continuing its strong earnings track record.
>>> FEATURED STOCK ARTICLE : Perched Near All-Time High After "3-Weeks Tight" - 5/24/2019 |
View all notes |
Set NEW NOTE alert |
Company Profile |
SEC
News |
Chart |
Request a new note
C
A
S
I |
UPLD
-
NASDAQ
Upland Software Inc
Computer Sftwr-Enterprse
|
$52.77
|
+3.91
8.00% |
$54.87
|
1,468,455
330.73% of 50 DAV
50 DAV is 444,000
|
$50.64
4.21%
|
6/10/2019
|
$53.30
|
PP = $50.74
|
|
MB = $53.28
|
Most Recent Note - 6/10/2019 12:35:37 PM
Y - Color code is changed to yellow with pivot point cited based on its 5/17/19 high plus 10 cents after an advanced ascending base. Gapped up today with a big volume-driven gain triggering a technical buy signal. Found support above its 50 DMA line ($45.17). Completed a new Public Offering on 5/08/19. Quarterly comparisons through Mar '19 have shown impressive sales revenues growth and greatly improved earnings increases above the +25% minimum guideline (C criteria). After years of losses it had a profitable FY '16 and strong annual earnings (A criteria) growth. That helps it better match with the fact-based investment system's fundamental guidelines calling for 3-5 years of strong and steady earnings growth.
>>> FEATURED STOCK ARTICLE : Rose From an Advanced Ascending Base - 6/10/2019 |
View all notes |
Set NEW NOTE alert |
Company Profile |
SEC
News |
Chart |
Request a new note
C
A
S
I |
GLOB
-
NYSE
Globant SA
Computer-Tech Services
|
$96.12
|
+2.95
3.17% |
$97.23
|
325,689
86.62% of 50 DAV
50 DAV is 376,000
|
$93.54
2.76%
|
2/15/2019
|
$69.35
|
PP = $70.00
|
|
MB = $73.50
|
Most Recent Note - 6/10/2019 5:19:56 PM
G - Hit another new all-time high with today's 5th consecutive gain on lighter than average volume. Very extended from any sound base. Its 50 DMA line ($83) defines important support where a violation would raise concerns and trigger a technical sell signal. Fundamentals remain strong.
>>> FEATURED STOCK ARTICLE : Earnings News Due While Perched Near All-Time High - 5/7/2019 |
View all notes |
Set NEW NOTE alert |
Company Profile |
SEC
News |
Chart |
Request a new note
C
A
S
I |
|
|
|
THESE ARE NOT BUY RECOMMENDATIONS!
Comments contained in the body of this report are technical
opinions only. The material herein has been obtained
from sources believed to be reliable and accurate, however,
its accuracy and completeness cannot be guaranteed.
This site is not an investment advisor, hence it does
not endorse or recommend any securities or other investments.
Any recommendation contained in this report may not
be suitable for all investors and it is not to be deemed
an offer or solicitation on our part with respect to
the purchase or sale of any securities. All trademarks,
service marks and trade names appearing in this report
are the property of their respective owners, and are
likewise used for identification purposes only.
This report is a service available
only to active Paid Premium Members.
You may opt-out of receiving report notifications
at any time. Questions or comments may be submitted
by writing to Premium Membership Services 665 S.E. 10 Street, Suite 201 Deerfield Beach, FL 33441-5634 or by calling 1-800-965-8307
or 954-785-1121.
|
|
|