You are not logged in.
This means you
CAN ONLY VIEW reports that were published prior to Sunday, February 25, 2024.
You
MUST UPGRADE YOUR MEMBERSHIP if you want to see any current reports.
AFTER MARKET UPDATE - THURSDAY, JUNE 9TH, 2022
Previous After Market Report Next After Market Report >>>
|
|
|
|
DOW |
-638.11 |
32,272.79 |
-1.94% |
|
Volume |
895,476,401 |
+5% |
|
Volume |
5,359,613,500 |
+15% |
|
NASDAQ |
-332.05 |
11,754.23 |
-2.75% |
|
Advancers |
472 |
15% |
|
Advancers |
1,129 |
26% |
|
S&P 500 |
-97.95 |
4,017.82 |
-2.38% |
|
Decliners |
2,647 |
85% |
|
Decliners |
3,241 |
74% |
|
Russell 2000 |
-40.15 |
1,850.86 |
-2.12% |
|
52 Wk Highs |
12 |
|
|
52 Wk Highs |
25 |
|
|
S&P 600 |
-23.82 |
1,220.04 |
-1.92% |
|
52 Wk Lows |
111 |
|
|
52 Wk Lows |
177 |
|
|
The market remains in a correction (M criteria), as arguably the rally still needs a solid confirmation. An opportunity for a valid follow-through day remains open unless the recent lows or May 20th lows are violated.
|
 |
Breadth Negative as Major Averages Slumped With Higher Volume
Kenneth J. Gruneisen - Passed the CAN SLIM® Master's Exam
The Dow slumped 638 points, while the S&P 500 fell 2.4%. The Nasdaq Composite slid 2.8%. Volume totals were reported higher than the prior session on the NYSE and on the Nasdaq exchange, indicative of an increase in institutional selling pressure. Breadth was negative as decliners led advancers by more that a 5-1 margin on the NYSE and nearly 3-1 on the Nasdaq exchange. There were 5 high-ranked companies from the Leaders List that hit new 52-week highs and were listed on the BreakOuts Page, versus the total of 30 on the prior session. New 52-week lows outnumbered new 52-week highs on the NYSE and on the Nasdaq exchange. The major indices have been in a noted market correction (M criteria). Sources at the newspaper, following the Thursday 5/26/22 session, relabeled it a "confirmed uptrend" despite flaws noted in our ongoing market commentaries. Followers of the fact-based investment system know to watch for a follow-through day backed by higher volume which could signal a new confirmed uptrend.Chart courtesy of www.stockcharts.com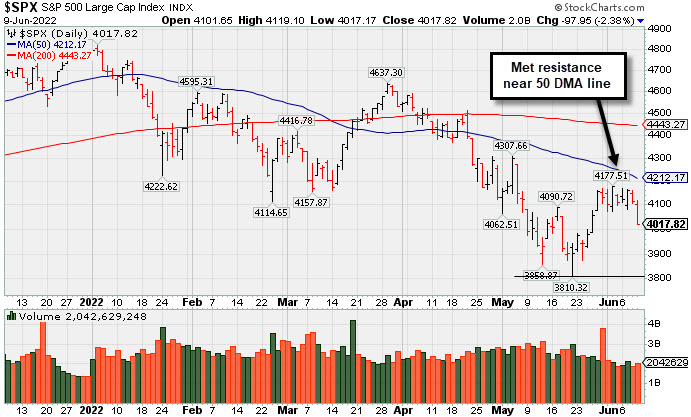 PICTURED: The S&P 500 Index slumped for a loss with higher volume after recently meeting resistance near its 50-day moving average line. The 3 major indexes cannot be said to be in "healthy" technical shape while all of them are sputtering well below both their 50-day and 200-day moving average (DMA) lines.
Regular readers of this commentary know to be watching closely for signs of truly increasing institutional buying demand. Arguably, the rally still needs confirmation, and an opportunity for a valid follow-through day remains open unless the recent lows or May 20th lows are violated.
U.S. stocks finished near session lows on Thursday as Wall Street continued to weigh lingering economic growth concerns ahead of Friday’s inflation update. Following their worst day in over three weeks, the major averages are set to decline for a second consecutive week. Treasuries modestly weakened, with the 10-year note yield adding one basis point (0.01%) to 3.05%.
Tomorrow’s update on inflation is the highlight of the week, with the Consumer Price Index (CPI) forecasted to have climbed 8.2% year-over-year in May, easing slightly from the previous 8.3% annual gain but still elevated around the highest level in four decades. The report could have implications for the Federal Reserve’s course of action, with officials meeting June 14-15. Meanwhile, the European Central Bank’s (ECB) decision was in focus. As expected, policymakers announced the end of their bond-buying program next month, setting the stage for a 0.25% rate hike. The euro reversed earlier gains versus the U.S. dollar, helping the greenback climb 0.8% against a basket of its peers.
All 11 S&P 500 sectors lost more than 1.5%, with Communication Services and Information Technology the worst performing groups. In corporate news, NXP Semiconductors NV (NXPI +4.04%) rose amid speculation the Dutch chipmaker could be targeted for a takeover.
On the data front, weekly initial jobless claims came in at 229,000, rising above the prior period’s 202,000 figure by the largest margin since July. Separately, a release revealed U.S. household net worth decreased during the first quarter from a record high.
|
 Kenneth J. Gruneisen started out as a licensed stockbroker in August 1987, a couple of months prior to the historic stock market crash that took the Dow Jones Industrial Average down -22.6% in a single day. He has published daily fact-based fundamental and technical analysis on high-ranked stocks online for two decades. Through FACTBASEDINVESTING.COM, Kenneth provides educational articles, news, market commentary, and other information regarding proven investment systems that work in good times and bad.
Comments contained in the body of this report are technical opinions only and are not necessarily those of Gruneisen Growth Corp. The material herein has been obtained from sources believed to be reliable and accurate, however, its accuracy and completeness cannot be guaranteed. Our firm, employees, and customers may effect transactions, including transactions contrary to any recommendation herein, or have positions in the securities mentioned herein or options with respect thereto. Any recommendation contained in this report may not be suitable for all investors and it is not to be deemed an offer or solicitation on our part with respect to the purchase or sale of any securities. |
|
 |
Tech, Retail, Financial, and Commodity-Linked Groups Fell
Kenneth J. Gruneisen - Passed the CAN SLIM® Master's Exam
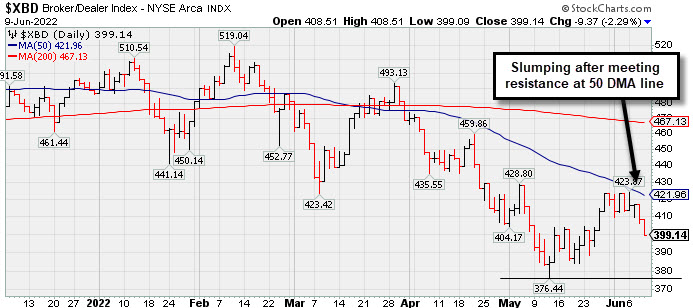
The tech sector had a negative bias as the Semiconductor Index ($SOX -2.69%), Biotech Index ($BTK -3.31%), and Networking Index ($NWX -2.47%) each lost ground. The Broker/Dealer Index ($XBD -2.29%) and Bank Index ($BKX -3.16%) added pressure on the major averages along with the Retail Index ($RLX -2.16%). Commodity-linked groups also fell as the Gold & Silver Index ($XAU -3.71%), Oil Services Index ($OSX -3.67%), and Integrated Oil Index ($XOI -2.06%) suffered unanimous losses.
PICTURED: The Broker/Dealer Index ($XBD -2.29%) has been slumping after recently meeting resistance near its 50-day moving average (DMA) line.
| Oil Services |
$OSX |
84.65 |
-3.22 |
-3.67% |
+60.57% |
| Integrated Oil |
$XOI |
1,859.15 |
-39.04 |
-2.06% |
+57.80% |
| Semiconductor |
$SOX |
2,937.79 |
-81.31 |
-2.69% |
-25.55% |
| Networking |
$NWX |
741.49 |
-18.76 |
-2.47% |
-23.64% |
| Broker/Dealer |
$XBD |
399.14 |
-9.37 |
-2.29% |
-18.02% |
| Retail |
$RLX |
3,085.67 |
-68.16 |
-2.16% |
-26.99% |
| Gold & Silver |
$XAU |
127.15 |
-4.90 |
-3.71% |
-4.00% |
| Bank |
$BKX |
110.15 |
-3.60 |
-3.16% |
-16.70% |
| Biotech |
$BTK |
4,508.15 |
-154.42 |
-3.31% |
-18.31% |
|
|
|
 |
Featured Stocks
Kenneth J. Gruneisen - Passed the CAN SLIM® Master's Exam
|
|
|
Color Codes Explained :
Y - Better candidates highlighted by our
staff of experts.
G - Previously featured
in past reports as yellow but may no longer be buyable under the
guidelines.
***Last / Change / Volume data in this table is the closing quote data***
Symbol/Exchange
Company Name
Industry Group |
PRICE |
CHANGE
(%Change) |
Day High |
Volume
(% DAV)
(% 50 day avg vol) |
52 Wk Hi
% From Hi |
Featured
Date |
Price
Featured |
Pivot Featured |
|
Max Buy |
 CI
-
NYSE
CI
-
NYSE
Cigna Corp
Medical-Managed Care
|
$257.58
|
-3.20
-1.23% |
$262.54
|
1,101,372
72.08% of 50 DAV
50 DAV is 1,528,000
|
$273.58
-5.85%
|
5/6/2022
|
$263.52
|
PP = $269.97
|
|
MB = $283.47
|
 Most Recent Note - 6/9/2022 5:42:23 PM
Y - Fell today with light volume testing near its 50 DMA line ($257.64). More damaging losses below the 50 DMA line and the prior low ($253.69 on 6/03/22) would raise greater concerns. Fundamentals remain strong.
>>> FEATURED STOCK ARTICLE : Consolidating Above 50-Day Moving Average Near All-Time High - 5/25/2022 |
View all notes |
Set NEW NOTE alert |
Company Profile |
SEC
News |
Chart |
Request a new note
C
A
S
I |
PAG
-
NYSE
Penske Automotive Grp
Retail/Whlsle-Automobile
|
$121.25
|
+1.03
0.86% |
$123.60
|
454,649
127.35% of 50 DAV
50 DAV is 357,000
|
$122.12
-0.71%
|
5/13/2022
|
$114.88
|
PP = $114.57
|
|
MB = $120.30
|
Most Recent Note - 6/9/2022 5:50:31 PM
G - Posted a volume-driven gain today and hit another new all-time high above its "max buy" level and its color code is changed to green. No overhead supply remains to act as resistance. Prior highs in the $114 area define initial support to watch above its 50 DMA line ($106.29) defines important near term support to watch.
>>> FEATURED STOCK ARTICLE : Penske Perched at High With No Resistance Remaining - 6/2/2022 |
View all notes |
Set NEW NOTE alert |
Company Profile |
SEC
News |
Chart |
Request a new note
C
A
S
I |
LLY
-
NYSE
Eli Lilly & Co
Medical-Diversified
|
$303.25
|
-10.24
-3.27% |
$311.92
|
1,908,341
63.11% of 50 DAV
50 DAV is 3,024,000
|
$324.08
-6.43%
|
5/16/2022
|
$302.46
|
PP = $314.10
|
|
MB = $329.81
|
Most Recent Note - 6/9/2022 5:45:35 PM
Y - Pulled back with light volume today slumping toward its 50 DMA line ($298) and prior low defining important near-term support. Pivot point cited was based on its 4/07/22 high plus 10 cents. Subsequent gains above the pivot point backed by at least +40% above average volume may help clinch a convincing technical buy signal. Fundamentals remain strong.
>>> FEATURED STOCK ARTICLE : Encountering Distributional Pressure After Reaching New Highs - 6/6/2022 |
View all notes |
Set NEW NOTE alert |
Company Profile |
SEC
News |
Chart |
Request a new note
C
A
S
I |
WCC
-
NYSE
Wesco International Inc
WHOLESALE - Electronics Wholesale
|
$133.68
|
-2.87
-2.10% |
$136.02
|
348,998
70.36% of 50 DAV
50 DAV is 496,000
|
$144.43
-7.44%
|
6/1/2022
|
$128.79
|
PP = $139.10
|
|
MB = $146.06
|
Most Recent Note - 6/9/2022 5:51:18 PM
Y - Pulled back further today with below average volume. Fundamentals remain strong after it reported Mar '22 quarterly earnings +154% on +22% sales revenues versus the year ago period.
>>> FEATURED STOCK ARTICLE : Big Volume-Driven Gain Helped Technical Stance Improve - 6/1/2022 |
View all notes |
Set NEW NOTE alert |
Company Profile |
SEC
News |
Chart |
Request a new note
C
A
S
I |
COKE
-
NASDAQ
Coca-Cola Consolidated
FOOD and BEVERAGE - Beverages - Soft Drinks
|
$589.50
|
-42.62
-6.74% |
$634.19
|
69,827
179.04% of 50 DAV
50 DAV is 39,000
|
$656.11
-10.15%
|
6/6/2022
|
$629.97
|
PP = $637.49
|
|
MB = $669.36
|
Most Recent Note - 6/9/2022 5:43:57 PM
Y - Suffered a big loss today with +75% above average volume raising concerns. Prior mid-day reports noted - "A strong gain and close above the pivot point backed by at least +40% above average volume may trigger a technical buy signal. Reported earnings increases above the +25% minimum in the of the past 4 quarterly comparisons through Mar '22 quarters versus the year ago periods. Annual earnings (A criteria) growth has been strong after a downturn in FY '18."
>>> FEATURED STOCK ARTICLE : Paused After Hitting New High With Volume-Driven Gains - 6/7/2022 |
View all notes |
Set NEW NOTE alert |
Company Profile |
SEC
News |
Chart |
Request a new note
C
A
S
I |
Symbol/Exchange
Company Name
Industry Group |
PRICE |
CHANGE
(%Change) |
Day High |
Volume
(% DAV)
(% 50 day avg vol) |
52 Wk Hi
% From Hi |
Featured
Date |
Price
Featured |
Pivot Featured |
|
Max Buy |
|
|
|
THESE ARE NOT BUY RECOMMENDATIONS!
Comments contained in the body of this report are technical
opinions only. The material herein has been obtained
from sources believed to be reliable and accurate, however,
its accuracy and completeness cannot be guaranteed.
This site is not an investment advisor, hence it does
not endorse or recommend any securities or other investments.
Any recommendation contained in this report may not
be suitable for all investors and it is not to be deemed
an offer or solicitation on our part with respect to
the purchase or sale of any securities. All trademarks,
service marks and trade names appearing in this report
are the property of their respective owners, and are
likewise used for identification purposes only.
This report is a service available
only to active Paid Premium Members.
You may opt-out of receiving report notifications
at any time. Questions or comments may be submitted
by writing to Premium Membership Services 665 S.E. 10 Street, Suite 201 Deerfield Beach, FL 33441-5634 or by calling 1-800-965-8307
or 954-785-1121.
|
|
|