You are not logged in.
This means you
CAN ONLY VIEW reports that were published prior to Sunday, February 25, 2024.
You
MUST UPGRADE YOUR MEMBERSHIP if you want to see any current reports.
AFTER MARKET UPDATE - TUESDAY, JUNE 9TH, 2020
Previous After Market Report Next After Market Report >>>
|
|
|
|
DOW |
-300.14 |
27,272.30 |
-1.09% |
|
Volume |
1,152,476,653 |
-19% |
|
Volume |
5,225,579,500 |
-14% |
|
NASDAQ |
+28.52 |
9,953.26 |
+0.29% |
|
Advancers |
620 |
21% |
|
Advancers |
1,157 |
35% |
|
S&P 500 |
-25.21 |
3,207.18 |
-0.78% |
|
Decliners |
2,282 |
79% |
|
Decliners |
2,162 |
65% |
|
Russell 2000 |
-29.84 |
1,507.05 |
-1.94% |
|
52 Wk Highs |
36 |
|
|
52 Wk Highs |
88 |
|
|
S&P 600 |
-23.04 |
894.77 |
-2.51% |
|
52 Wk Lows |
3 |
|
|
52 Wk Lows |
5 |
|
|
 |
Leadership Waned as Major Indices Fell With Lighter Volume Totals
Kenneth J. Gruneisen - Passed the CAN SLIM® Master's Exam
The S&P 500 fell 0.8%, a day after closing slightly in positive territory for the year. The Dow lost 300 points, snapping a six-session winning streak. The Nasdaq Composite briefly traded above the 10,000 level for the first time ever, but pared back some gains to end 0.3% higher at a fresh closing record high of 9,953. The small cap Russell 2000 Index slipped 1.7% after climbing more than 10% during the first six trading sessions of June. Decliners led advancers by more than a 3-1 margin on the NYSE and by nearly 2-1 margin on the Nasdaq exchange. The reported volume totals were lighter than the prior session on the NYSE and on the Nasdaq exchange, indicative of only light selling coming from the institutional crowd. There were 17 high-ranked companies from the Leaders List that hit new 52-week highs and were listed on the BreakOuts Page, versus the 43 on the prior session. New 52-week highs totals contracted yet still outnumbered new 52-week lows totals which were in the single digits on the NYSE and on the Nasdaq exchange. The major indices are in a confirmed uptrend (M criteria). Any sustainable rally requires a healthy crop of new leaders, so the recent improvement in new highs totals was noted as an encouraging sign. Charts used courtesy of www.stockcharts.com
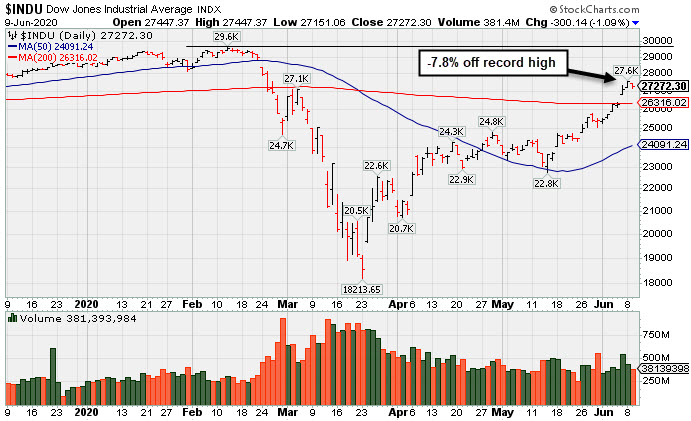
PICTURED: The Dow Jones Industrial Average is now -7.8% off its record high.
Stocks finished mixed on Tuesday as investors assessed Wall Street’s recent rally. Nine of 11 S&P 500 sectors finished in negative territory, with the Technology and Communication Services groups bucking the downtrend. Energy and Industrials shares, which have staged a rebound in recent weeks, led laggards. In corporate news, Apple (AAPL +3.16%) after the iPhone maker announced plans to switch from Intel’s (INTC -0.99%) main processors to its own in chips in Mac computers. Tiffany & Co (TIF +1.95%) rose as an encouraging rebound in its Chinese market overshadowed disappointing quarterly figures. Amazon Inc (AMZN +3.03%) rose above $2,600 for the first time as it hit a new all-time high.
Amid the perceived “risk-off” mood, Treasuries strengthened. The yield on the benchmark 10-year note was down five basis points to 0.82%. On the data front, the NFIB’s gauge of small business optimism improved more than expected in May. Separately, the Job Openings and Labor Turnover Survey (JOLTS) showed only 5 million jobs openings in April after March’s 6 million figure was the lowest since at least May 2017. In commodities, WTI crude added 1.5% to $38.78/barrel, while COMEX gold rose 0.8% to $1,712.00/ounce amid a weaker dollar. |
 Kenneth J. Gruneisen started out as a licensed stockbroker in August 1987, a couple of months prior to the historic stock market crash that took the Dow Jones Industrial Average down -22.6% in a single day. He has published daily fact-based fundamental and technical analysis on high-ranked stocks online for two decades. Through FACTBASEDINVESTING.COM, Kenneth provides educational articles, news, market commentary, and other information regarding proven investment systems that work in good times and bad.
Comments contained in the body of this report are technical opinions only and are not necessarily those of Gruneisen Growth Corp. The material herein has been obtained from sources believed to be reliable and accurate, however, its accuracy and completeness cannot be guaranteed. Our firm, employees, and customers may effect transactions, including transactions contrary to any recommendation herein, or have positions in the securities mentioned herein or options with respect thereto. Any recommendation contained in this report may not be suitable for all investors and it is not to be deemed an offer or solicitation on our part with respect to the purchase or sale of any securities. |
|
 |
Retail and Gold & Silver Indexes Posted Gains
Kenneth J. Gruneisen - Passed the CAN SLIM® Master's Exam
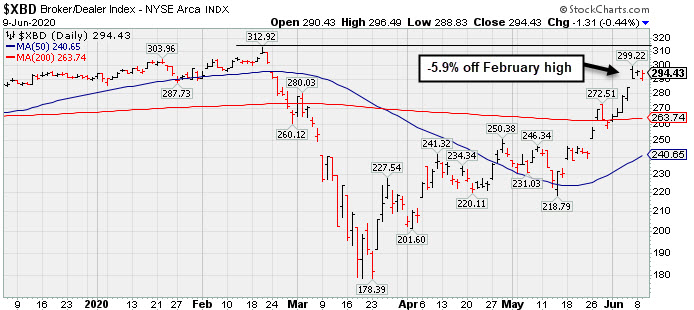
The Bank Index ($BKX -2.28%) outpaced the Broker/Dealer Index ($XBD -0.44%) to the downside while the Retail Index ($RLX +1.14%) posted a gain. The tech sector had a negative bias as the Biotech Index ($BTK -0.69%) and Networking Index ($NWX -1.53%) fell and the Semiconductor Index ($SOX -0.03%) finished flat. Energy-linked groups were standout decliners as the Oil Services Index ($OSX -7.38%) and the Integrated Oil Index ($XOI -4.08%) fell, meanwhile, the Gold & Silver Index ($XAU +1.15%) ended higher.
PICTURED: The Broker/Dealer Index ($XBD -0.44%) is now -5.9% off its February high.
| Oil Services |
$OSX |
42.86 |
-3.41 |
-7.37% |
-45.25% |
| Integrated Oil |
$XOI |
916.61 |
-38.97 |
-4.08% |
-27.86% |
| Semiconductor |
$SOX |
1,998.09 |
-0.53 |
-0.03% |
+8.03% |
| Networking |
$NWX |
585.44 |
-9.11 |
-1.53% |
+0.35% |
| Broker/Dealer |
$XBD |
294.43 |
-1.31 |
-0.44% |
+1.40% |
| Retail |
$RLX |
2,941.09 |
+33.21 |
+1.14% |
+20.08% |
| Gold & Silver |
$XAU |
117.04 |
+1.33 |
+1.15% |
+9.47% |
| Bank |
$BKX |
87.66 |
-2.05 |
-2.29% |
-22.67% |
| Biotech |
$BTK |
5,623.97 |
-38.85 |
-0.69% |
+10.98% |
|
|
|
 |
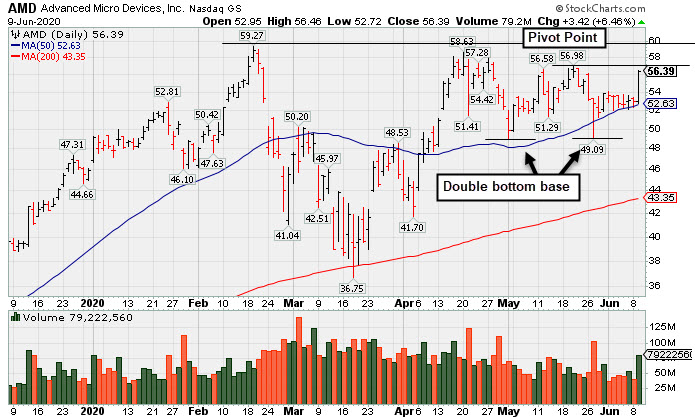
Big Chip Firm Showing Strong Sales Revenues and Earnings Increases
Kenneth J. Gruneisen - Passed the CAN SLIM® Master's Exam
Advanced Micro Devices (AMD +$3.42 or +6.46% to $56.39) was highlighted in yellow in the earlier mid-day report (read here) with pivot point cited based on its 5/20/20 high while building on an orderly double-bottom base above its 50-day moving average which has acted as support. Subsequent gains above the pivot point backed by at least +40% above average volume may trigger a convincing technical buy signal. Today's gain also has it approaching previously stubborn resistance in the $57-59 area. Subsequent gains into new high territory may mark the beginning of a new substantial leg higher.
The 3 latest quarterly comparisons through Mar '20 showed very strong earnings increases well above the +25% minimum guideline (C criteria) with greatly improved sales revenues growth +50% and +40% in the Dec '19 and Mar '20 comparisons, respectively, versus the year ago periods. Annual earnings growth (A criteria) has been very strong after losses in FY '15 and '16. it has a highest possible 99 Earnings Per Share Rating.
AMD hails from the Electronics - Semiconductor Fabless industry which has a Group Relative Strength Rating of 95 (L criteria). It has a large supply of 1.17 billion shares outstanding (S criteria), which makes it less likely to be a quick sprinter. However, the number of top-rated funds owning its shares rose from 1,669 in Jun '19 to 1,985 in Mar '20, a reassuring sign concerning the I criteria. It has a Timeliness Rating of A and Sponsorship Rating of B. Its Accumulation/Distribution rating is B-.
|
|
|
Color Codes Explained :
Y - Better candidates highlighted by our
staff of experts.
G - Previously featured
in past reports as yellow but may no longer be buyable under the
guidelines.
***Last / Change / Volume data in this table is the closing quote data***
Symbol/Exchange
Company Name
Industry Group |
PRICE |
CHANGE
(%Change) |
Day High |
Volume
(% DAV)
(% 50 day avg vol) |
52 Wk Hi
% From Hi |
Featured
Date |
Price
Featured |
Pivot Featured |
|
Max Buy |
 FTNT
-
NASDAQ
FTNT
-
NASDAQ
Fortinet Inc
Computer Sftwr-Security
|
$135.92
|
-1.59
-1.16% |
$137.70
|
1,265,388
64.14% of 50 DAV
50 DAV is 1,973,000
|
$149.69
-9.20%
|
5/7/2020
|
$134.40
|
PP = $121.92
|
|
MB = $128.02
|
 Most Recent Note - 6/9/2020 5:35:57 PM
G - Consolidating -9.2% off its all-time high with volume totals cooling in recent weeks. Prior highs in the $121 area coincide with its 50 DMA line ($121.50) defining important near-term support to watch.
>>> FEATURED STOCK ARTICLE : Extended From Prior Base and Holding Ground Stubbornly - 5/22/2020 |
View all notes |
Set NEW NOTE alert |
Company Profile |
SEC
News |
Chart |
Request a new note
C
A
S
I |
EBS
-
NYSE
Emergent Biosolutions
DRUGS - Biotechnology
|
$69.43
|
+0.74
1.08% |
$72.06
|
1,063,138
186.52% of 50 DAV
50 DAV is 570,000
|
$93.58
-25.81%
|
6/1/2020
|
$72.10
|
PP = $90.10
|
|
MB = $94.61
|
Most Recent Note - 6/9/2020 5:33:05 PM
G - Halted its slide today following a gap down and damaging loss on the prior session violating its 50 DMA line ($74.39) triggering a technical sell signal. Only a prompt rebound above the 50 DMA line would help its outlook improve. Fundamentals remain strong.
>>> FEATURED STOCK ARTICLE : Volume Light Behind Recent Pullback From All-Time High - 5/26/2020 |
View all notes |
Set NEW NOTE alert |
Company Profile |
SEC
News |
Chart |
Request a new note
C
A
S
I |
NBIX
-
NASDAQ
Neurocrine Biosciences
DRUGS - Biotechnology
|
$118.82
|
+0.31
0.26% |
$121.79
|
743,743
87.85% of 50 DAV
50 DAV is 846,600
|
$128.29
-7.38%
|
5/19/2020
|
$123.71
|
PP = $119.75
|
|
MB = $125.74
|
Most Recent Note - 6/5/2020 1:12:24 PM
G - Color code is changed to green today after slumping below the pivot point and falling back into the previously noted base raising concerns. Recent quarterly comparisons through Mar '20 showed greatly improved sales revenues and earnings increases versus year ago periods (C criteria). After years of losses it reported solid annual earnings (A criteria) in FY '18 and '19.
>>> FEATURED STOCK ARTICLE : Pullback Into Prior Base Negated Recent Breakout - 6/8/2020 |
View all notes |
Set NEW NOTE alert |
Company Profile |
SEC
News |
Chart |
Request a new note
C
A
S
I |
AMD
-
NASDAQ
Advanced Micro Devices
ELECTRONICS - Semiconductor - Broad Line
|
$56.39
|
+3.42
6.46% |
$56.46
|
79,189,783
116.47% of 50 DAV
50 DAV is 67,989,000
|
$59.27
-4.86%
|
6/9/2020
|
$55.41
|
PP = $56.98
|
|
MB = $59.83
|
Most Recent Note - 6/9/2020 5:21:59 PM
Y - Finished near the session high with a solid gain today backed by +17% above average volume. It was highlighted in yellow with pivot point cited based on its 5/20/20 high after an orderly double-bottom base. Subsequent gains above the pivot point backed by at least +40% above average volume may trigger a convincing technical buy signal. Today's gain had it approaching previously stubborn resistance in the $57-59 area. Gains into new high territory may mark the beginning of a substantial leg higher. The 3 latest quarterly comparisons through Mar '20 showed very strong earnings increases with greatly improved sales revenues growth in the Dec '19 and Mar '20 comparisons versus the year ago period. See the latest FSU analysis for more details and a new annotated graph.
>>> FEATURED STOCK ARTICLE : Big Chip Firm Showing Strong Sales Revenues and Earnings Increases - 6/9/2020 |
View all notes |
Set NEW NOTE alert |
Company Profile |
SEC
News |
Chart |
Request a new note
C
A
S
I |
TREX
-
NYSE
Trex Company Inc
MATERIALS and CONSTRUCTION - General Building Materials
|
$119.10
|
-1.36
-1.13% |
$122.38
|
649,348
63.60% of 50 DAV
50 DAV is 1,021,000
|
$132.84
-10.34%
|
5/5/2020
|
$109.05
|
PP = $111.95
|
|
MB = $117.55
|
Most Recent Note - 6/5/2020 2:39:05 PM
G - Posting a big gain today following a pullback from oits all-time high. Recent gains above the pivot point lacked the great volume conviction. Prior highs in the $111 area define initial support to watch. Fundamentals remain strong.
>>> FEATURED STOCK ARTICLE : Bullish Action Continues for Top Wood Alternative Firm - 5/20/2020 |
View all notes |
Set NEW NOTE alert |
Company Profile |
SEC
News |
Chart |
Request a new note
C
A
S
I |
Symbol/Exchange
Company Name
Industry Group |
PRICE |
CHANGE
(%Change) |
Day High |
Volume
(% DAV)
(% 50 day avg vol) |
52 Wk Hi
% From Hi |
Featured
Date |
Price
Featured |
Pivot Featured |
|
Max Buy |
NFLX
-
NASDAQ
Netflix Inc
SPECIALTY RETAIL - Music and Video Stores
|
$434.05
|
+14.56
3.47% |
$434.73
|
6,541,261
78.99% of 50 DAV
50 DAV is 8,281,000
|
$458.97
-5.43%
|
5/14/2020
|
$441.95
|
PP = $449.62
|
|
MB = $472.10
|
Most Recent Note - 6/9/2020 5:24:44 PM
Y - Posted a solid gain today with below average volume. Found prompt support near its 50 DMA line ($417) in recent weeks while volume totals cooled. More damaging losses leading to a violation would trigger a technical sell signal. Subsequent gains above the pivot point must be backed by at least +40% above average volume to trigger a proper new (or add-on) technical buy signal. Fundamentals remain strong.
>>> FEATURED STOCK ARTICLE : Pulling Back After Brief New Base Formation - 5/21/2020 |
View all notes |
Set NEW NOTE alert |
Company Profile |
SEC
News |
Chart |
Request a new note
C
A
S
I |
NOW
-
NYSE
Servicenow Inc
Computer Sftwr-Enterprse
|
$388.83
|
+2.19
0.57% |
$398.00
|
1,668,286
71.79% of 50 DAV
50 DAV is 2,324,000
|
$396.15
-1.85%
|
4/30/2020
|
$343.05
|
PP = $363.05
|
|
MB = $381.20
|
Most Recent Note - 6/9/2020 5:28:03 PM
G - Quietly touched a new all-time high today but ended in the lower third of its intra-day range. Color code is changed to green while perched above the "max buy" level. Recent gains above the pivot point were not backed by the +40% above average volume necessary to clinch a proper technical buy signal. Prior highs in the $362 area define initial support to watch on pullbacks.
>>> FEATURED STOCK ARTICLE : Quiet Pullback Below "Max Buy" Level for NOW - 6/4/2020 |
View all notes |
Set NEW NOTE alert |
Company Profile |
SEC
News |
Chart |
Request a new note
C
A
S
I |
QLYS
-
NASDAQ
Qualys Inc
Computer Sftwr-Security
|
$107.38
|
-0.63
-0.58% |
$109.61
|
396,338
72.72% of 50 DAV
50 DAV is 545,000
|
$119.20
-9.92%
|
4/9/2020
|
$100.44
|
PP = $97.22
|
|
MB = $102.08
|
Most Recent Note - 6/5/2020 6:14:03 PM
G - Suffered a damaging loss today with volume slightly above average as it undercut prior highs raising concerns. It has been noted as extended from the prior base. Its 50 DMA line ($103.83) defines the next important near-term support. Fundamentals remain strong.
>>> FEATURED STOCK ARTICLE : Qualys is Extended From Prior Base and Perched Near All-Time High - 5/29/2020 |
View all notes |
Set NEW NOTE alert |
Company Profile |
SEC
News |
Chart |
Request a new note
C
A
S
I |
TEAM
-
NASDAQ
Atlassian Corp Plc Cl A
Comp Sftwr-Spec Enterprs
|
$173.54
|
-1.66
-0.95% |
$178.56
|
904,174
46.11% of 50 DAV
50 DAV is 1,961,000
|
$191.72
-9.48%
|
5/4/2020
|
$159.70
|
PP = $156.22
|
|
MB = $164.03
|
Most Recent Note - 6/5/2020 6:15:31 PM
G - Managed a positive reversal today after losses backed by above average volume. Its 50 DMA line ($160.55) defines important support above prior highs in the $156 area. See the latest FSU analysis for more details and a new annotated graph.
>>> FEATURED STOCK ARTICLE : Positive Reversal Near Prior High and 50 DMA Line - 6/5/2020 |
View all notes |
Set NEW NOTE alert |
Company Profile |
SEC
News |
Chart |
Request a new note
C
A
S
I |
TTD
-
NASDAQ
The Trade Desk Inc Cl A
Comml Svcs-Advertising
|
$362.98
|
+4.67
1.30% |
$370.27
|
1,292,483
57.96% of 50 DAV
50 DAV is 2,230,000
|
$360.42
0.71%
|
6/3/2020
|
$240.61
|
PP = $327.35
|
|
MB = $343.72
|
Most Recent Note - 6/5/2020 2:41:24 PM
G - Color code is changed to green after powering above its "max buy" level and hitting a new all-time high with today's big gain. Highlighted in yellow with new pivot point cited based on its 5/07/20 high in the 6/03/20 mid-day report. See the latest FSU analysis for more details and an annotated graph.
>>> FEATURED STOCK ARTICLE : Trade Desk Posts Powerful Gain for New High - 6/3/2020 |
View all notes |
Set NEW NOTE alert |
Company Profile |
SEC
News |
Chart |
Request a new note
C
A
S
I |
Symbol/Exchange
Company Name
Industry Group |
PRICE |
CHANGE
(%Change) |
Day High |
Volume
(% DAV)
(% 50 day avg vol) |
52 Wk Hi
% From Hi |
Featured
Date |
Price
Featured |
Pivot Featured |
|
Max Buy |
PING
-
NYSE
Ping Identity Hldg Corp
Computer Sftwr-Security
|
$30.74
|
+0.87
2.91% |
$31.91
|
1,251,216
107.59% of 50 DAV
50 DAV is 1,163,000
|
$31.50
-2.41%
|
6/1/2020
|
$29.24
|
PP = $29.90
|
|
MB = $31.40
|
Most Recent Note - 6/9/2020 5:31:44 PM
Y - Hit a new all-time high and finished at a best-ever close with today's gain back above its pivot point backed by only +8% above average volume. Found prompt support after a shakeout following its recently noted technical breakout. More damaging losses would raise greater concerns.
>>> FEATURED STOCK ARTICLE : Strong Gain for New High Backed by 127% Above Average Volume - 6/1/2020 |
View all notes |
Set NEW NOTE alert |
Company Profile |
SEC
News |
Chart |
Request a new note
C
A
S
I |
AAXN
-
NASDAQ
Axon Enterprise Inc
Security/Sfty
|
$100.27
|
+3.00
3.08% |
$104.76
|
2,272,008
238.41% of 50 DAV
50 DAV is 953,000
|
$99.62
0.65%
|
5/8/2020
|
$84.86
|
PP = $90.20
|
|
MB = $94.71
|
Most Recent Note - 6/9/2020 12:17:34 PM
G - Hitting a new all-time high with another volume-driven gain today, rallying further above its "max buy" level. Prior highs in the $90-91 area acted as support following the powerful breakout last week..
>>> FEATURED STOCK ARTICLE : Quietly Slumping Near 50-Day Moving Average Line - 5/28/2020 |
View all notes |
Set NEW NOTE alert |
Company Profile |
SEC
News |
Chart |
Request a new note
C
A
S
I |
GDDY
-
NYSE
Godaddy Inc Cl A
Computer Sftwr-Enterprse
|
$79.63
|
-1.23
-1.52% |
$81.41
|
633,937
35.32% of 50 DAV
50 DAV is 1,795,000
|
$82.47
-3.44%
|
6/2/2020
|
$79.62
|
PP = $82.40
|
|
MB = $86.52
|
Most Recent Note - 6/9/2020 5:38:09 PM
Y - Volume totals have been cooling while hovering near its 52-week high, stubbornly holding its ground. Subsequent gains above the pivot point backed by at least +40% above average volume are needed to trigger a proper technical buy signal. It previously met stubborn resistance in the $82-84 area.
>>> FEATURED STOCK ARTICLE : Godaddy Could Be Ready to Go for New Highs - 6/2/2020 |
View all notes |
Set NEW NOTE alert |
Company Profile |
SEC
News |
Chart |
Request a new note
C
A
S
I |
|
|
|
THESE ARE NOT BUY RECOMMENDATIONS!
Comments contained in the body of this report are technical
opinions only. The material herein has been obtained
from sources believed to be reliable and accurate, however,
its accuracy and completeness cannot be guaranteed.
This site is not an investment advisor, hence it does
not endorse or recommend any securities or other investments.
Any recommendation contained in this report may not
be suitable for all investors and it is not to be deemed
an offer or solicitation on our part with respect to
the purchase or sale of any securities. All trademarks,
service marks and trade names appearing in this report
are the property of their respective owners, and are
likewise used for identification purposes only.
This report is a service available
only to active Paid Premium Members.
You may opt-out of receiving report notifications
at any time. Questions or comments may be submitted
by writing to Premium Membership Services 665 S.E. 10 Street, Suite 201 Deerfield Beach, FL 33441-5634 or by calling 1-800-965-8307
or 954-785-1121.
|
|
|