You are not logged in.
This means you
CAN ONLY VIEW reports that were published prior to Sunday, February 25, 2024.
You
MUST UPGRADE YOUR MEMBERSHIP if you want to see any current reports.
AFTER MARKET UPDATE - WEDNESDAY, JUNE 8TH, 2022
Previous After Market Report Next After Market Report >>>
|
|
|
|
DOW |
-269.24 |
32,910.90 |
-0.81% |
|
Volume |
848,845,179 |
-10% |
|
Volume |
4,667,402,800 |
+7% |
|
NASDAQ |
-88.96 |
12,086.27 |
-0.73% |
|
Advancers |
787 |
25% |
|
Advancers |
1,987 |
45% |
|
S&P 500 |
-44.91 |
4,115.77 |
-1.08% |
|
Decliners |
2,314 |
75% |
|
Decliners |
2,392 |
55% |
|
Russell 2000 |
-28.56 |
1,891.01 |
-1.49% |
|
52 Wk Highs |
81 |
|
|
52 Wk Highs |
50 |
|
|
S&P 600 |
-21.40 |
1,243.86 |
-1.69% |
|
52 Wk Lows |
51 |
|
|
52 Wk Lows |
124 |
|
|
The market remains in a correction (M criteria), as arguably the rally still needs a solid confirmation. An opportunity for a valid follow-through day remains open unless the recent lows or May 20th lows are violated.
|
 |
Major Indices Fell as Most Groups Ended Lower
Kenneth J. Gruneisen - Passed the CAN SLIM® Master's Exam
The Dow lost 269 points, while the S&P 500 fell 1.1%. The Nasdaq Composite declined 0.7%. Volume totals for Wednesday were reported mixed, lighter than the prior session on the NYSE and higher on the Nasdaq exchange. Breadth was negative as decliners led advancers by almost a 3-1 margin on the NYSE and 6-5 on the Nasdaq exchange. There were 30 high-ranked companies from the Leaders List that hit new 52-week highs and were listed on the BreakOuts Page, versus the total of 37 on the prior session. New 52-week highs outnumbered new 52-week lows on the NYSE, but new lows still outnumbered new 52-week highs on the Nasdaq exchange. The major indices have been in a noted market correction (M criteria). Sources at the newspaper, following the Thursday 5/26/22 session, relabeled it a "confirmed uptrend" despite flaws noted in our ongoing market commentaries. Followers of the fact-based investment system know to watch for a follow-through day backed by higher volume which could signal a new confirmed uptrend.Chart courtesy of www.stockcharts.com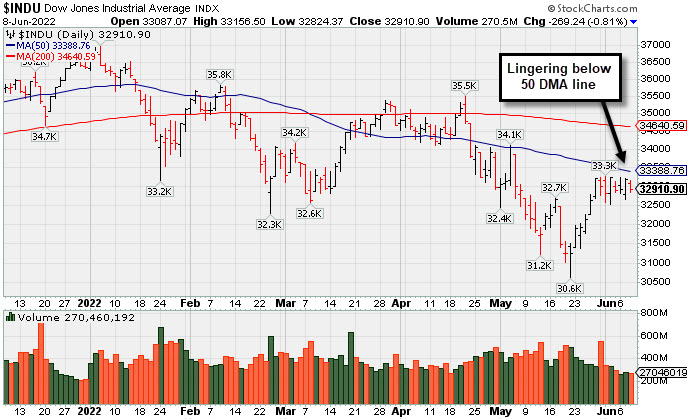 PICTURED: The Dow Jones Industrial Average slumped for a loss with lighter volume. The 3 major indexes cannot be said to be in "healthy" technical shape while all of them are sputtering well below both their 50-day and 200-day moving average (DMA) lines.
Regular readers of this commentary know to be watching closely for signs of truly increasing institutional buying demand. Arguably, the rally still needs confirmation, and an opportunity for a valid follow-through day remains open unless the recent lows or May 20th lows are violated.
U.S. stocks finished lower on Wednesday, snapping a two-session winning streak. Investors weighed a confluence of market headwinds and awaited Friday’s Consumer Price Index (CPI) reading. Risk sentiment remained cautious amid increasing concerns about slowing global economic growth.
Anxiety about central bank policy tightening continued to be in focus, while a jump in oil prices exacerbated lingering inflation worries. West Texas Intermediate crude climbed 2.6% to $122.56/barrel, near a three-month high. Oil prices were supported by a weekly drawdown in gasoline stockpiles and crude inventories in the largest storage hub in the U.S., highlighting tight supply conditions.
Ten of 11 S&P 500 sectors closed in negative territory with Energy ending narrowly higher. Real Estate, Materials, and Utilities led the downturn. Chipmakers also underperformed, with Intel Corp. (INTC -5.28%) down following a warning about weakening demand. Elsewhere, Altria Group Inc. (MO -8.37%) fell after the tobacco company was the subject of an analyst downgrade. In earnings, Campbell Soup Co. (CPB +1.52%) rose on positive results that included a boost to its full-year sales guidance.
Treasuries weakened, with the yield on the 10-year note up six basis points (0.06%) to 3.04% following a soft auction of the maturity. On the data front, mortgage applications fell 6.5% in the latest week, with demand for mortgages hitting a 22-year low amid rising rates and depressed inventory. Separately, a final April reading of wholesale inventories was upwardly revised to reflect a 2.2% gain.
|
 Kenneth J. Gruneisen started out as a licensed stockbroker in August 1987, a couple of months prior to the historic stock market crash that took the Dow Jones Industrial Average down -22.6% in a single day. He has published daily fact-based fundamental and technical analysis on high-ranked stocks online for two decades. Through FACTBASEDINVESTING.COM, Kenneth provides educational articles, news, market commentary, and other information regarding proven investment systems that work in good times and bad.
Comments contained in the body of this report are technical opinions only and are not necessarily those of Gruneisen Growth Corp. The material herein has been obtained from sources believed to be reliable and accurate, however, its accuracy and completeness cannot be guaranteed. Our firm, employees, and customers may effect transactions, including transactions contrary to any recommendation herein, or have positions in the securities mentioned herein or options with respect thereto. Any recommendation contained in this report may not be suitable for all investors and it is not to be deemed an offer or solicitation on our part with respect to the purchase or sale of any securities. |
|
 |
Financial, Retail, Tech, and Commodity-Linked Groups Fell
Kenneth J. Gruneisen - Passed the CAN SLIM® Master's Exam
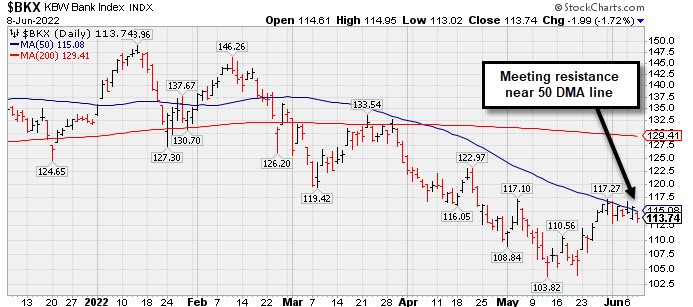
The Broker/Dealer Index ($XBD -2.04%) and Bank Index ($BKX -1.72%) created a drag on the major averages and the Retail Index ($RLX -1.11%) also slumped. Commodity-linked groups had a negative bias as the Gold & Silver Index ($XAU -0.70%) and Oil Services Index ($OSX -0.56%) edged lower and the Integrated Oil Index ($XOI -0.09%) finished flat. The Semiconductor Index ($SOX -2.39%) led the tech sector lower and the Networking Index ($NWX -0.52%) suffered a smaller loss while the Biotech Index ($BTK +0.22%) eked out a small gain.
PICTURED: The Bank Index ($BKX -1.72%) pulled back today and has recently been meeting resistance near its 50-day moving average (DMA) line.
| Oil Services |
$OSX |
87.88 |
-0.49 |
-0.56% |
+66.69% |
| Integrated Oil |
$XOI |
1,898.18 |
-1.66 |
-0.09% |
+61.11% |
| Semiconductor |
$SOX |
3,019.10 |
-73.86 |
-2.39% |
-23.49% |
| Networking |
$NWX |
760.36 |
-3.95 |
-0.52% |
-21.70% |
| Broker/Dealer |
$XBD |
408.46 |
-8.51 |
-2.04% |
-16.10% |
| Retail |
$RLX |
3,153.83 |
-35.50 |
-1.11% |
-25.38% |
| Gold & Silver |
$XAU |
132.06 |
-0.93 |
-0.70% |
-0.30% |
| Bank |
$BKX |
113.74 |
-1.99 |
-1.72% |
-13.97% |
| Biotech |
$BTK |
4,662.09 |
+10.35 |
+0.22% |
-15.52% |
|
|
|
 |
Featured Stocks
Kenneth J. Gruneisen - Passed the CAN SLIM® Master's Exam
|
|
|
Color Codes Explained :
Y - Better candidates highlighted by our
staff of experts.
G - Previously featured
in past reports as yellow but may no longer be buyable under the
guidelines.
***Last / Change / Volume data in this table is the closing quote data***
Symbol/Exchange
Company Name
Industry Group |
PRICE |
CHANGE
(%Change) |
Day High |
Volume
(% DAV)
(% 50 day avg vol) |
52 Wk Hi
% From Hi |
Featured
Date |
Price
Featured |
Pivot Featured |
|
Max Buy |
 CI
-
NYSE
CI
-
NYSE
Cigna Corp
Medical-Managed Care
|
$260.78
|
-1.50
-0.57% |
$262.60
|
1,235,576
80.60% of 50 DAV
50 DAV is 1,533,000
|
$273.58
-4.68%
|
5/6/2022
|
$263.52
|
PP = $269.97
|
|
MB = $283.47
|
Most Recent Note - 6/7/2022 5:19:07 PM
Y - Posted a gain today with slightly higher volume. Color code was changed to yellow after rebounding back above its 50 DMA line ($257) helping its outlook to improve. More damaging losses would raise greater concerns. Fundamentals remain strong.
>>> FEATURED STOCK ARTICLE : Consolidating Above 50-Day Moving Average Near All-Time High - 5/25/2022 |
View all notes |
Set NEW NOTE alert |
Company Profile |
SEC
News |
Chart |
Request a new note
C
A
S
I |
PAG
-
NYSE
Penske Automotive Grp
Retail/Whlsle-Automobile
|
$120.22
|
-0.65
-0.54% |
$122.12
|
405,858
114.01% of 50 DAV
50 DAV is 356,000
|
$121.19
-0.80%
|
5/13/2022
|
$114.88
|
PP = $114.57
|
|
MB = $120.30
|
Most Recent Note - 6/7/2022 5:24:32 PM
Y - Posted a 5th consecutive gain today and inched to another new all-time high with below average volume behind its gain. No overhead supply remains to act as resistance. Rebounded back above the previously cited pivot point following a recent pullback. Its 50 DMA line ($105.52) defines important near term support to watch.
>>> FEATURED STOCK ARTICLE : Penske Perched at High With No Resistance Remaining - 6/2/2022 |
View all notes |
Set NEW NOTE alert |
Company Profile |
SEC
News |
Chart |
Request a new note
C
A
S
I |
LLY
-
NYSE
Eli Lilly & Co
Medical-Diversified
|
$313.49
|
+1.39
0.45% |
$315.50
|
2,572,946
85.37% of 50 DAV
50 DAV is 3,014,000
|
$324.08
-3.27%
|
5/16/2022
|
$302.46
|
PP = $314.10
|
|
MB = $329.81
|
Most Recent Note - 6/7/2022 5:23:14 PM
Y - Posted a 2nd consecutive volume-driven gain today. Pulled back last week from a new high yet found support above its 50 DMA line ($297). Pivot point cited was based on its 4/07/22 high plus 10 cents. Subsequent gains above the pivot point backed by at least +40% above average volume may help clinch a convincing technical buy signal. Fundamentals remain strong. See the latest FSU analysis for more details and an annotated graph.
>>> FEATURED STOCK ARTICLE : Encountering Distributional Pressure After Reaching New Highs - 6/6/2022 |
View all notes |
Set NEW NOTE alert |
Company Profile |
SEC
News |
Chart |
Request a new note
C
A
S
I |
WCC
-
NYSE
Wesco International Inc
WHOLESALE - Electronics Wholesale
|
$136.55
|
-7.33
-5.09% |
$142.82
|
639,520
130.25% of 50 DAV
50 DAV is 491,000
|
$144.43
-5.46%
|
6/1/2022
|
$128.79
|
PP = $139.10
|
|
MB = $146.06
|
 Most Recent Note - 6/8/2022 4:45:35 PM
Y - Pulled back today for a big loss with +30% above average volume. The gain on the prior session had +58% above average volume as it clinched a technical buy signal. Fundamentals remain strong after it reported Mar '22 quarterly earnings +154% on +22% sales revenues versus the year ago period.
>>> FEATURED STOCK ARTICLE : Big Volume-Driven Gain Helped Technical Stance Improve - 6/1/2022 |
View all notes |
Set NEW NOTE alert |
Company Profile |
SEC
News |
Chart |
Request a new note
C
A
S
I |
COKE
-
NASDAQ
Coca-Cola Consolidated
FOOD and BEVERAGE - Beverages - Soft Drinks
|
$632.12
|
-2.86
-0.45% |
$647.56
|
46,703
116.76% of 50 DAV
50 DAV is 40,000
|
$644.46
-1.91%
|
6/6/2022
|
$629.97
|
PP = $637.49
|
|
MB = $669.36
|
Most Recent Note - 6/7/2022 5:21:12 PM
Y - Paused today after hitting a new all-time high. Posted 4 consecutive volume-driven gains and it was highlighted in yellow with pivot point cited based on its 1/13/22 high plus 10 cents when the 2 latest mid-day reports noted - "A strong gain and close above the pivot point backed by at least +40% above average volume may trigger a technical buy signal. Reported earnings increases above the +25% minimum in the of the past 4 quarterly comparisons through Mar '22 quarters versus the year ago periods. Annual earnings (A criteria) growth has been strong after a downturn in FY '18." See the latest FSU analysis for more details and a new annotated graph.
>>> FEATURED STOCK ARTICLE : Paused After Hitting New High With Volume-Driven Gains - 6/7/2022 |
View all notes |
Set NEW NOTE alert |
Company Profile |
SEC
News |
Chart |
Request a new note
C
A
S
I |
Symbol/Exchange
Company Name
Industry Group |
PRICE |
CHANGE
(%Change) |
Day High |
Volume
(% DAV)
(% 50 day avg vol) |
52 Wk Hi
% From Hi |
Featured
Date |
Price
Featured |
Pivot Featured |
|
Max Buy |
|
|
|
THESE ARE NOT BUY RECOMMENDATIONS!
Comments contained in the body of this report are technical
opinions only. The material herein has been obtained
from sources believed to be reliable and accurate, however,
its accuracy and completeness cannot be guaranteed.
This site is not an investment advisor, hence it does
not endorse or recommend any securities or other investments.
Any recommendation contained in this report may not
be suitable for all investors and it is not to be deemed
an offer or solicitation on our part with respect to
the purchase or sale of any securities. All trademarks,
service marks and trade names appearing in this report
are the property of their respective owners, and are
likewise used for identification purposes only.
This report is a service available
only to active Paid Premium Members.
You may opt-out of receiving report notifications
at any time. Questions or comments may be submitted
by writing to Premium Membership Services 665 S.E. 10 Street, Suite 201 Deerfield Beach, FL 33441-5634 or by calling 1-800-965-8307
or 954-785-1121.
|
|
|