You are not logged in.
This means you
CAN ONLY VIEW reports that were published prior to Sunday, February 25, 2024.
You
MUST UPGRADE YOUR MEMBERSHIP if you want to see any current reports.
AFTER MARKET UPDATE - FRIDAY, JUNE 7TH, 2019
Previous After Market Report Next After Market Report >>>
|
|
|
|
DOW |
+263.28 |
25,983.94 |
+1.02% |
|
Volume |
728,115,450 |
-8% |
|
Volume |
2,063,372,260 |
+0% |
|
NASDAQ |
+126.55 |
7,742.10 |
+1.66% |
|
Advancers |
2,109 |
74% |
|
Advancers |
1,997 |
66% |
|
S&P 500 |
+29.85 |
2,873.34 |
+1.05% |
|
Decliners |
724 |
26% |
|
Decliners |
1,028 |
34% |
|
Russell 2000 |
+10.85 |
1,514.39 |
+0.72% |
|
52 Wk Highs |
292 |
|
|
52 Wk Highs |
152 |
|
|
S&P 600 |
+6.47 |
919.89 |
+0.71% |
|
52 Wk Lows |
46 |
|
|
52 Wk Lows |
111 |
|
|
 |
Big Gains and Leadership Expansion Confirm New Market Uptrend
Kenneth J. Gruneisen - Passed the CAN SLIM® Master's Exam
The major averages finished firmly higher Friday, with the Dow climbing 263 points, snapping its six-week losing streak. The S&P 500 surged 1.1%, while the Nasdaq Composite jumped 1.7%. The volume totals reported were mixed, lighter on the NYSE and higher on the Nasdaq exchange. Advancers led decliners by almost a 3-1 margin on the NYSE and by a 2-1 margin on the Nasdaq exchange. Leadership improved as 121 high-ranked companies from the Leaders List hit new 52-week highs and were listed on the BreakOuts Page, versus the total of 87 on the prior session, and up from only 9 stocks last Friday. New 52-week highs totals swelled and easily outnumbered new 52-week lows on the NYSE on the Nasdaq exchange. Big gains marked Day 4 of the new rally attempt, and the major indices (M criteria) established a new "confirmed uptrend" under the fact-based system as the bullish session met the requirements to be a proper follow-through day. The Featured Stocks Page provides the most timely analysis on high-ranked leaders. Charts used courtesy of www.stockcharts.com
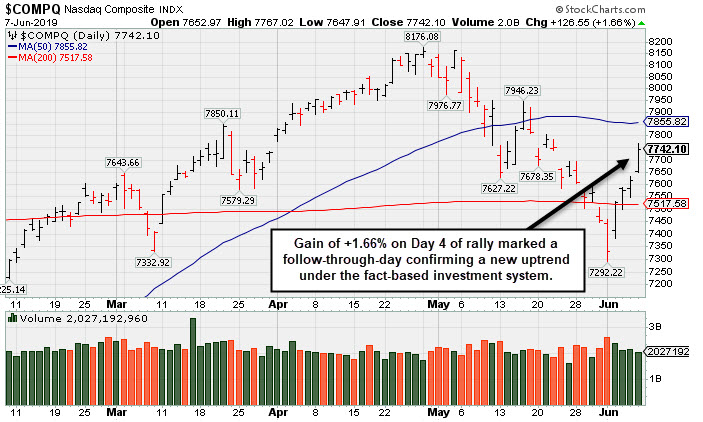
PICTURED: The Nasdaq Composite Index posted a +1.66% gain on Day 4 of the rally and the volume total was reportedly higher (final volume not shown on this graph) coupled with an expansion in the number of stocks reaching new 52-week highs.
Stocks notched their best week of the year as disappointing jobs data increased the likelihood of Fed rate cuts. For the week, the Dow rallied 4.7%, the S&P 500 gained 4.4%, and the Nasdaq Composite added 3.9%.
The Labor Department’s non-farm payrolls report showed the U.S. economy added 75,000 jobs in May, well below expectations of 175,000. The unemployment rate remained unchanged at 3.6%, while average hourly earnings increased at a 3.1% annualized clip, slightly below forecasts. According to Fed-fund futures data from CME Group, traders are now pricing in a nearly 85% chance of at least one rate cut by July, up from 50% at the start of the week. Treasuries extended gains following the jobs report, with the yield on the benchmark 10-year note down four basis points to 2.08%. In commodities, WTI crude gained 2.7% after Saudi Arabia suggested OPEC may extend production cuts.
All 11 S&P 500 sectors posted solid gains this week, with Materials surging more than 9% and Tech shares jumping 6%. Every group besides Communications Services, Real Estate, and Utilities rallied at least 4% on the week. In earnings Friday, Beyond Meat (BYND +39.4%) after the plant-based meat provider topped analyst revenue estimates and raised guidance.
|
 Kenneth J. Gruneisen started out as a licensed stockbroker in August 1987, a couple of months prior to the historic stock market crash that took the Dow Jones Industrial Average down -22.6% in a single day. He has published daily fact-based fundamental and technical analysis on high-ranked stocks online for two decades. Through FACTBASEDINVESTING.COM, Kenneth provides educational articles, news, market commentary, and other information regarding proven investment systems that work in good times and bad.
Comments contained in the body of this report are technical opinions only and are not necessarily those of Gruneisen Growth Corp. The material herein has been obtained from sources believed to be reliable and accurate, however, its accuracy and completeness cannot be guaranteed. Our firm, employees, and customers may effect transactions, including transactions contrary to any recommendation herein, or have positions in the securities mentioned herein or options with respect thereto. Any recommendation contained in this report may not be suitable for all investors and it is not to be deemed an offer or solicitation on our part with respect to the purchase or sale of any securities. |
|
 |
Retail, Tech, and Energy-Linked Groups Rose
Kenneth J. Gruneisen - Passed the CAN SLIM® Master's Exam
The Retail Index ($RLX +1.80%) posted a solid gain while the Broker/Dealer Index ($XBD -0.02%) finished flat and the Bank Index ($BKX -0.70%) fell. The tech sector had a positive bias as the Semiconductor Index ($SOX +1.15%) and the Biotech Index ($BTK +1.66%) both outpaced the Networking Index ($NWX +0.55%). The Integrated Oil Index ($XOI +0.48%) and the Oil Services Index ($OSX +0.57%) both posed modest gains but the Gold & Silver Index ($XAU -0.11%) ended the session slightly in the red. Charts courtesy of www.stockcharts.com
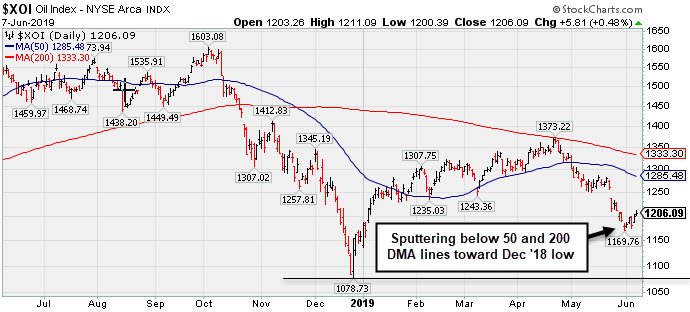 PICTURED: The Integrated Oil Index ($XOI +0.48%) has been sputtering below its 50-day and 200-day moving average (DMA) lines toward its December 2018 low.
| Oil Services |
$OSX |
75.14 |
+0.42 |
+0.56% |
-6.77% |
| Integrated Oil |
$XOI |
1,206.09 |
+5.81 |
+0.48% |
+4.05% |
| Semiconductor |
$SOX |
1,378.81 |
+15.68 |
+1.15% |
+19.36% |
| Networking |
$NWX |
572.78 |
+3.14 |
+0.55% |
+17.21% |
| Broker/Dealer |
$XBD |
263.75 |
-0.06 |
-0.02% |
+11.13% |
| Retail |
$RLX |
2,266.91 |
+40.14 |
+1.80% |
+16.17% |
| Gold & Silver |
$XAU |
74.33 |
-0.08 |
-0.11% |
+5.19% |
| Bank |
$BKX |
95.21 |
-0.67 |
-0.70% |
+10.98% |
| Biotech |
$BTK |
4,534.56 |
+74.13 |
+1.66% |
+7.43% |
|
|
|
 |
Base Building Now Above 50-Day Moving Average Line
Kenneth J. Gruneisen - Passed the CAN SLIM® Master's Exam
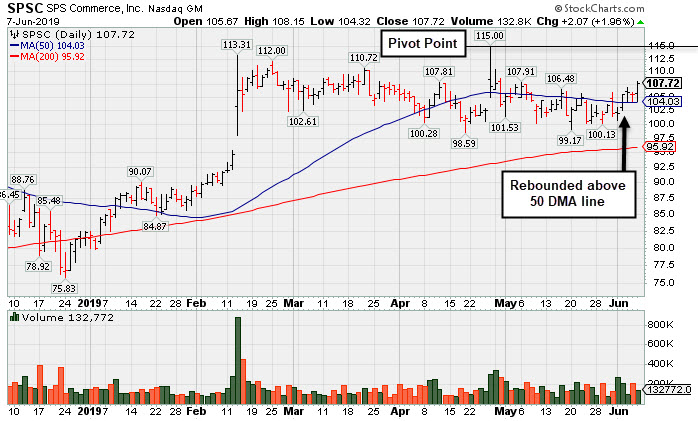
S P S Commerce Inc (SPSC +$2.07 or +1.96% to $107.72) rebounded further above its 50-day moving average (DMA) line ($104.03) with today's gain on light volume. Recent volume-driven gains above the 50 DMA line helped its technical stance improve. A new pivot point is cited based on its 4/26/19 high plus 10 cents.
It faces some resistance due to overhead supply up to the $115 level. Subsequent gains above the pivot point backed by at least +40% above average volume may trigger a new (or add-on) technical buy signal. Recent lows in the $98-99 area define important near-term support to watch.
Fundamentals remain strong. It reported earnings +54% on +13% sales revenues for the quarter ended March 31, 2019 versus the year ago period, its 6th quarterly earnings comparison above the +25% minimum guideline (C criteria). A small downturn in FY '16 earnings was previously noted as a flaw in its annual earnings (A criteria) history.
It has formed a big base-on-base pattern. It was last shown in this FSU section on 5/01/19 with an annotated graph under the headline, "Sputtering Near 50-Day Average Line Building Base-On-Base" The high-ranked Computer Software firm's current Up/Down Volume Ratio of 1.1 is an unbiased indication its shares have been under slight accumulation over the past 50 days.
It completed new Public Offerings on 11/20/13 and 9/06/12. The number of top-rated funds owning its shares rose from 238 in Mar '18 to 440 in Mar '19, a reassuring sign concerning the I criteria. It has a Timeliness Rating of A and Sponsorship Rating of B. The small supply of 17.9 million shares outstanding (S criteria) can contribute to greater price volatility in the even of institutional buying or selling.
Charts courtesy of www.stockcharts.com
|
|
|
Color Codes Explained :
Y - Better candidates highlighted by our
staff of experts.
G - Previously featured
in past reports as yellow but may no longer be buyable under the
guidelines.
***Last / Change / Volume data in this table is the closing quote data***
Symbol/Exchange
Company Name
Industry Group |
PRICE |
CHANGE
(%Change) |
Day High |
Volume
(% DAV)
(% 50 day avg vol) |
52 Wk Hi
% From Hi |
Featured
Date |
Price
Featured |
Pivot Featured |
|
Max Buy |
 SPSC
-
NASDAQ
SPSC
-
NASDAQ
S P S Commerce Inc
COMPUTER SOFTWARE and SERVICES - Application Software
|
$107.72
|
+2.07
1.96% |
$108.15
|
103,598
65.16% of 50 DAV
50 DAV is 159,000
|
$115.00
-6.33%
|
6/7/2019
|
$107.72
|
PP = $115.10
|
|
MB = $120.86
|
 Most Recent Note - 6/7/2019 6:33:00 PM
Y - Rebounded further above its 50 DMA line ($104) with today's gain on light volume. Color code is changed to yellow with new pivot point cited based on its 4/26/19 high plus 10 cents. Subsequent volume-driven gains above the pivot point are needed to trigger a new (or add-on) technical buy signal. Faces some resistance due to overhead supply up to the $115 level. Recent lows in the $98-99 area define important near-term support to watch. Fundamentals remain strong. See the latest FSU analysis for more details and a new annotated graph.
>>> FEATURED STOCK ARTICLE : Base Building Now Above 50-Day Moving Average Line - 6/7/2019 |
View all notes |
Set NEW NOTE alert |
Company Profile |
SEC
News |
Chart |
Request a new note
C
A
S
I |
EPAM
-
NYSE
Epam Systems Inc
COMPUTER SOFTWARE and SERVICES - Information Technology Service
|
$176.75
|
+3.93
2.27% |
$177.84
|
361,024
73.38% of 50 DAV
50 DAV is 492,000
|
$180.55
-2.10%
|
5/9/2019
|
$169.25
|
PP = $180.55
|
|
MB = $189.58
|
Most Recent Note - 6/7/2019 6:39:59 PM
Y - Color code is changed to yellow after rebounding above its 50 DMA line ($171) helping its outlook to improve. Perched within close striking distance of its 52-week high. Subsequent gains above the pivot point backed by at least +40% above average volume may trigger a new (or add-on) technical buy signal. Fundamentals remain strong.
>>> FEATURED STOCK ARTICLE : Found Support and Closed in Upper Third of Day's Range - 5/9/2019 |
View all notes |
Set NEW NOTE alert |
Company Profile |
SEC
News |
Chart |
Request a new note
C
A
S
I |
ENV
-
NYSE
Envestnet Inc
FINANCIAL SERVICES - Diversified Investments
|
$69.08
|
-0.09
-0.13% |
$70.00
|
348,289
124.39% of 50 DAV
50 DAV is 280,000
|
$72.67
-4.94%
|
3/15/2019
|
$66.05
|
PP = $64.90
|
|
MB = $68.15
|
Most Recent Note - 6/4/2019 6:07:36 PM
G - Rebounded above its 50 DMA line ($68.27) today helping its technical stance. Weak action came after recently reporting earnings +5% on +1% sales revenues for the Mar '19 quarter, below the +25% minimum earnings guideline (C criteria). The prior high ($64.80 on 9/14/18) defines important near-term support to watch. See the latest FSU analysis for more details and a new annotated graph.
>>> FEATURED STOCK ARTICLE : Rebound Above 50-Day Moving Average Improved Technical Stance - 6/4/2019 |
View all notes |
Set NEW NOTE alert |
Company Profile |
SEC
News |
Chart |
Request a new note
C
A
S
I |
LHCG
-
NASDAQ
L H C Group Inc
HEALTH SERVICES - Home Health Care
|
$115.17
|
+0.20
0.17% |
$115.83
|
148,988
59.36% of 50 DAV
50 DAV is 251,000
|
$122.20
-5.75%
|
4/29/2019
|
$110.94
|
PP = $115.64
|
|
MB = $121.42
|
Most Recent Note - 6/4/2019 6:22:49 PM
Y - Rebounded above its pivot point with today's 4th consecutive gain backed by lighter than average volume. Its 50 DMA line ($111) defines near-term support. Fundamentals remain strong.
>>> FEATURED STOCK ARTICLE : Long-Term Care Firm Hovering Near All-Time High - 5/14/2019 |
View all notes |
Set NEW NOTE alert |
Company Profile |
SEC
News |
Chart |
Request a new note
C
A
S
I |
ENSG
-
NASDAQ
Ensign Group Inc
HEALTH SERVICES - Long-Term Care Facilities
|
$55.11
|
+1.18
2.19% |
$55.19
|
213,464
70.92% of 50 DAV
50 DAV is 301,000
|
$58.14
-5.21%
|
4/30/2019
|
$51.46
|
PP = $53.30
|
|
MB = $55.97
|
Most Recent Note - 6/7/2019 6:46:41 PM
Y - Showing resilience while consolidating above its 50 DMA line ($52.42) and recent lows which define near-term support to watch. Recently reported earnings +22% on +12% sales revenues for the Mar '19 quarter, below the +25% minimum earnings guideline (C criteria), raising fundamental concerns.
>>> FEATURED STOCK ARTICLE : Resilient After Latest Quarterly Report Missed Minimum Guideline - 6/3/2019 |
View all notes |
Set NEW NOTE alert |
Company Profile |
SEC
News |
Chart |
Request a new note
C
A
S
I |
Symbol/Exchange
Company Name
Industry Group |
PRICE |
CHANGE
(%Change) |
Day High |
Volume
(% DAV)
(% 50 day avg vol) |
52 Wk Hi
% From Hi |
Featured
Date |
Price
Featured |
Pivot Featured |
|
Max Buy |
CHDN
-
NASDAQ
Churchill Downs Inc
LEISURE - Gaming Activities
|
$112.27
|
+2.01
1.82% |
$113.97
|
320,675
99.90% of 50 DAV
50 DAV is 321,000
|
$110.47
1.63%
|
6/5/2019
|
$108.87
|
PP = $104.96
|
|
MB = $110.21
|
Most Recent Note - 6/5/2019 12:12:49 PM
Y - Color code is changed to yellow with new pivot point cited based on its 5/16/18 high plus 10 cents. Triggering a technical buy signal with today's 5th consecutive gain backed by above average volume. Share price was impacted by a 3:1 split when last noted on 1/28/19. Its Relative Strength Rating is 87, above the 80+ minimum guideline for buy candidates. Fundamentals have remained strong since dropped from the Featured Stocks list on 8/20/18.
>>> FEATURED STOCK ARTICLE : Consolidating Near 50-Day Moving Average - 6/29/2018 |
View all notes |
Set NEW NOTE alert |
Company Profile |
SEC
News |
Chart |
Request a new note
C
A
S
I |
LULU
-
NASDAQ
Lululemon Athletica
MANUFACTURING - Textile Manufacturing
|
$172.49
|
+2.11
1.24% |
$172.80
|
1,823,162
81.90% of 50 DAV
50 DAV is 2,226,000
|
$179.50
-3.91%
|
3/28/2019
|
$169.20
|
PP = $164.89
|
|
MB = $173.13
|
Most Recent Note - 6/6/2019 4:58:41 PM
G - Sputtering near its 50 DMA line ($171) after it found support last week near prior highs. Due to report Apr '19 quarterly earnings news after the close on Wednesday, June 12th. Volume and volatility often increase near earnings news.
>>> FEATURED STOCK ARTICLE : Volume Light While Hovering Near High - 5/10/2019 |
View all notes |
Set NEW NOTE alert |
Company Profile |
SEC
News |
Chart |
Request a new note
C
A
S
I |
ULTA
-
NASDAQ
Ulta Beauty Inc
SPECIALTY RETAIL - Specialty Retail, Other
|
$338.16
|
-2.17
-0.64% |
$343.96
|
503,722
69.96% of 50 DAV
50 DAV is 720,000
|
$359.69
-5.99%
|
3/15/2019
|
$341.27
|
PP = $322.59
|
|
MB = $338.72
|
Most Recent Note - 6/6/2019 4:56:13 PM
G - Posted a 3rd consecutive gain today with light volume. Still needs gains above its 50 DMA line ($345) for its outlook to improve. Rebounded from a deep early loss on 5/31/19 after gapping down. Reported earnings +17% on +13% sales revenues for the Apr '19 quarter, below the +25% minimum earnings guideline (C criteria), raising fundamental concerns. Faces resistance due to overhead supply up to the $359 level. See the latest FSU analysis for more details and a new annotated graph.
>>> FEATURED STOCK ARTICLE : Sputtering Below 50-Day Moving Average Following Sub Par Earnings - 6/6/2019 |
View all notes |
Set NEW NOTE alert |
Company Profile |
SEC
News |
Chart |
Request a new note
C
A
S
I |
ESNT
-
NYSE
Essent Group Ltd
Finance-MrtgandRel Svc
|
$48.80
|
-0.16
-0.33% |
$49.47
|
599,860
103.78% of 50 DAV
50 DAV is 578,000
|
$49.21
-0.83%
|
3/18/2019
|
$45.84
|
PP = $45.06
|
|
MB = $47.31
|
Most Recent Note - 6/5/2019 5:43:17 PM
Y - Found support above its 50 DMA line ($46.44) during its consolidation in recent months. Faces very little resistance due to overhead supply up to the $50 level while perched very near its 52-week high. Recently reported earnings +15% on +20% sales revenues for the Mar '19 quarter, below the +25% minimum earnings guideline (C criteria), raising fundamental concerns. See the latest FSU analysis for more details and a new annotated graph.
>>> FEATURED STOCK ARTICLE : Still Hovering Not Far From 52-Week High - 6/5/2019 |
View all notes |
Set NEW NOTE alert |
Company Profile |
SEC
News |
Chart |
Request a new note
C
A
S
I |
NOW
-
NYSE
Servicenow Inc
Computer Sftwr-Enterprse
|
$274.55
|
+6.06
2.26% |
$276.69
|
1,686,796
95.62% of 50 DAV
50 DAV is 1,764,000
|
$281.74
-2.55%
|
4/22/2019
|
$242.64
|
PP = $251.75
|
|
MB = $264.34
|
Most Recent Note - 6/6/2019 4:57:26 PM
G - Rebounded further above its 50 DMA line ($257) with lighter volume behind today's 3rd consecutive gain. Found support near the prior high ($251.65 on 3/21/19). Recently reported earnings +20% on +34% sales revenues for the Mar '19 quarter, below the +25% minimum earnings guideline (C criteria), raising concerns, fundamentally.
>>> FEATURED STOCK ARTICLE : Leader Consolidating Above 50-Day Moving Average Line - 5/29/2019 |
View all notes |
Set NEW NOTE alert |
Company Profile |
SEC
News |
Chart |
Request a new note
C
A
S
I |
Symbol/Exchange
Company Name
Industry Group |
PRICE |
CHANGE
(%Change) |
Day High |
Volume
(% DAV)
(% 50 day avg vol) |
52 Wk Hi
% From Hi |
Featured
Date |
Price
Featured |
Pivot Featured |
|
Max Buy |
QLYS
-
NASDAQ
Qualys Inc
Computer Sftwr-Security
|
$85.89
|
+0.95
1.12% |
$87.11
|
212,490
68.04% of 50 DAV
50 DAV is 312,300
|
$98.30
-12.62%
|
5/23/2019
|
$90.43
|
PP = $98.40
|
|
MB = $103.32
|
Most Recent Note - 6/4/2019 6:13:29 PM
G - Rebounded near its 50 today after finding prompt support near its 200 DMA line. Its Relative Strength Rating is 77, below the 80+ minimum guideline for buy candidates. Met stubborn resistance in the $97-98 area. Reported earnings +36% on +16% sales revenues for the Mar '19 quarter, continuing its strong earnings history.
>>> FEATURED STOCK ARTICLE : Rallying to Challenge Previously Stubborn Resistance - 5/2/2019 |
View all notes |
Set NEW NOTE alert |
Company Profile |
SEC
News |
Chart |
Request a new note
C
A
S
I |
VEEV
-
NYSE
Veeva Systems Inc Cl A
Computer Sftwr-Medical
|
$162.20
|
+3.20
2.01% |
$164.60
|
1,933,537
152.61% of 50 DAV
50 DAV is 1,267,000
|
$161.78
0.26%
|
5/30/2019
|
$154.32
|
PP = $145.80
|
|
MB = $153.09
|
Most Recent Note - 6/7/2019 12:48:02 PM
G - Today's 4th consecutive gain has it getting extended from any sound base. Reported earnings +52% on +25% sales revenues for the Apr '19 quarter, marking its 5th strong quarter with earnings above the +25% minimum guideline (C criteria). Disciplined investors will note that no new buying efforts are to be made during market corrections (M criteria) under the fact-based investment system's rules. Watch for a confirmed rally with a follow-through day first.
>>> FEATURED STOCK ARTICLE : Big Volume-Driven Gain for New High Following Earnings News - 5/30/2019 |
View all notes |
Set NEW NOTE alert |
Company Profile |
SEC
News |
Chart |
Request a new note
C
A
S
I |
PAYC
-
NYSE
Paycom Software Inc
COMPUTER SOFTWARE and SERVICES - Application Software
|
$222.45
|
+3.24
1.48% |
$223.89
|
669,265
91.68% of 50 DAV
50 DAV is 730,000
|
$220.92
0.69%
|
2/6/2019
|
$171.66
|
PP = $164.18
|
|
MB = $172.39
|
Most Recent Note - 6/4/2019 6:11:57 PM
G - Rebounded near its all-time high with today's big gain after testing its 50 DMA line ($197.77) which defines important near-term support to watch. Reported earnings +25% on +30% sales revenues for the Mar '19 quarter.
>>> FEATURED STOCK ARTICLE : Posted Volume-Driven Gain While Hovering Near All-Time High - 5/31/2019 |
View all notes |
Set NEW NOTE alert |
Company Profile |
SEC
News |
Chart |
Request a new note
C
A
S
I |
PYPL
-
NASDAQ
Paypal Holdings Inc
Finance-CrdtCard/PmtPr
|
$114.02
|
+2.24
2.00% |
$115.14
|
5,837,692
95.17% of 50 DAV
50 DAV is 6,134,000
|
$114.66
-0.56%
|
1/24/2019
|
$92.56
|
PP = $93.80
|
|
MB = $98.49
|
Most Recent Note - 6/7/2019 6:44:08 PM
G - Managed a best-ever close with near average volume behind today's 4th consecutive gain. It did not form a sound base yet promptly rebounded after violating its 50 DMA line and prior low ($106.52) on 6/03/19 triggering technical sell signals. Recently reported earnings +37% on +12% sales revenues for the Mar '19 quarter, continuing its strong earnings track record.
>>> FEATURED STOCK ARTICLE : Hovering Near All Time High Extended From Any Sound Base - 5/15/2019 |
View all notes |
Set NEW NOTE alert |
Company Profile |
SEC
News |
Chart |
Request a new note
C
A
S
I |
PLNT
-
NYSE
Planet Fitness Inc Cl A
Leisure-Services
|
$77.96
|
-0.95
-1.20% |
$79.42
|
1,057,972
75.19% of 50 DAV
50 DAV is 1,407,000
|
$81.76
-4.65%
|
11/7/2018
|
$57.10
|
PP = $55.45
|
|
MB = $58.22
|
Most Recent Note - 6/4/2019 6:23:50 PM
G - Extended from any sound base, consolidating above its 50 DMA line ($73.96) and prior low which define near-term support levels to watch. Violations would raise concerns and trigger technical sell signals. Fundamentals remain strong.
>>> FEATURED STOCK ARTICLE : Pulling Back From High After Impressive Rally - 5/23/2019 |
View all notes |
Set NEW NOTE alert |
Company Profile |
SEC
News |
Chart |
Request a new note
C
A
S
I |
Symbol/Exchange
Company Name
Industry Group |
PRICE |
CHANGE
(%Change) |
Day High |
Volume
(% DAV)
(% 50 day avg vol) |
52 Wk Hi
% From Hi |
Featured
Date |
Price
Featured |
Pivot Featured |
|
Max Buy |
BLD
-
NYSE
Topbuild Corp
Bldg-Constr Prds/Misc
|
$82.72
|
+2.67
3.34% |
$82.95
|
235,935
75.86% of 50 DAV
50 DAV is 311,000
|
$87.21
-5.15%
|
5/17/2019
|
$82.19
|
PP = $87.31
|
|
MB = $91.68
|
Most Recent Note - 6/7/2019 6:36:20 PM
Y - Posted another gain today with light volume. Subsequent gains above the pivot point backed by at least +40% above average volume may trigger a technical buy signal. Fundamentals remain strong.
>>> FEATURED STOCK ARTICLE : Encountered Distributional Pressure Near Prior High - 5/20/2019 |
View all notes |
Set NEW NOTE alert |
Company Profile |
SEC
News |
Chart |
Request a new note
C
A
S
I |
TEAM
-
NASDAQ
Atlassian Corp Plc Cl A
Comp Sftwr-Spec Enterprs
|
$131.43
|
+3.72
2.91% |
$132.28
|
1,252,134
68.35% of 50 DAV
50 DAV is 1,832,000
|
$132.87
-1.08%
|
5/24/2019
|
$129.52
|
PP = $132.09
|
|
MB = $138.69
|
Most Recent Note - 6/7/2019 6:35:11 PM
Y - Posted a 4th consecutive gain today with lighter than average volume and ended at a best-ever close. The 50 DMA line and prior high ($117)define important neat-term support to watch. Reported earnings +133% on +38% sales revenues for the Mar '19 quarter, continuing its strong earnings track record.
>>> FEATURED STOCK ARTICLE : Perched Near All-Time High After "3-Weeks Tight" - 5/24/2019 |
View all notes |
Set NEW NOTE alert |
Company Profile |
SEC
News |
Chart |
Request a new note
C
A
S
I |
GLOB
-
NYSE
Globant SA
Computer-Tech Services
|
$93.17
|
+1.68
1.84% |
$93.54
|
146,809
39.15% of 50 DAV
50 DAV is 375,000
|
$93.50
-0.35%
|
2/15/2019
|
$69.35
|
PP = $70.00
|
|
MB = $73.50
|
Most Recent Note - 6/7/2019 6:49:11 PM
G - Quietly touched a new all-time high with today's 4th consecutive gain on lighter than average volume. Very extended from any sound base. Its 50 DMA line ($82.51) defines important support where a violation would raise concerns and trigger a technical sell signal. Fundamentals remain strong.
>>> FEATURED STOCK ARTICLE : Earnings News Due While Perched Near All-Time High - 5/7/2019 |
View all notes |
Set NEW NOTE alert |
Company Profile |
SEC
News |
Chart |
Request a new note
C
A
S
I |
|
|
|
THESE ARE NOT BUY RECOMMENDATIONS!
Comments contained in the body of this report are technical
opinions only. The material herein has been obtained
from sources believed to be reliable and accurate, however,
its accuracy and completeness cannot be guaranteed.
This site is not an investment advisor, hence it does
not endorse or recommend any securities or other investments.
Any recommendation contained in this report may not
be suitable for all investors and it is not to be deemed
an offer or solicitation on our part with respect to
the purchase or sale of any securities. All trademarks,
service marks and trade names appearing in this report
are the property of their respective owners, and are
likewise used for identification purposes only.
This report is a service available
only to active Paid Premium Members.
You may opt-out of receiving report notifications
at any time. Questions or comments may be submitted
by writing to Premium Membership Services 665 S.E. 10 Street, Suite 201 Deerfield Beach, FL 33441-5634 or by calling 1-800-965-8307
or 954-785-1121.
|
|
|

