You are not logged in.
This means you
CAN ONLY VIEW reports that were published prior to Monday, February 19, 2024.
You
MUST UPGRADE YOUR MEMBERSHIP if you want to see any current reports.
AFTER MARKET UPDATE - WEDNESDAY, JUNE 5TH, 2019
Previous After Market Report Next After Market Report >>>
|
|
|
|
DOW |
+207.39 |
25,539.57 |
+0.82% |
|
Volume |
819,066,140 |
-8% |
|
Volume |
2,120,459,980 |
-10% |
|
NASDAQ |
+48.36 |
7,575.48 |
+0.64% |
|
Advancers |
1,424 |
50% |
|
Advancers |
1,340 |
44% |
|
S&P 500 |
+22.88 |
2,826.15 |
+0.82% |
|
Decliners |
1,411 |
50% |
|
Decliners |
1,725 |
56% |
|
Russell 2000 |
-1.77 |
1,506.79 |
-0.12% |
|
52 Wk Highs |
175 |
|
|
52 Wk Highs |
93 |
|
|
S&P 600 |
-2.67 |
916.22 |
-0.29% |
|
52 Wk Lows |
61 |
|
|
52 Wk Lows |
119 |
|
|
 |
Volume Totals Were Lighter as Major Indices Rose
Kenneth J. Gruneisen - Passed the CAN SLIM® Master's Exam
The Dow climbed 207 points, while the S&P 500 gained 0.8%, with both indexes notching their best two-day performance since January. The Nasdaq Composite was up 0.6%. The volume totals reported were lighter on the NYSE and on the Nasdaq exchange. Advancers narrowly led decliners on the NYSE but decliners led advancers by a 3-2 margin on the Nasdaq exchange. There were 67 high-ranked companies from the Leaders List hit new 52-week highs and were listed on the BreakOuts Page, versus the total of 22 on the prior session. New 52-week highs outnumbered new 52-week lows on the NYSE but new 52-week lows still outnumbered new 52-week highs on the Nasdaq exchange. The solid gains marked Day 2 of a new rally attempt. The major indices (M criteria) have been showing action indicative of a more worrisome "market correction". The fact-based investment system discourages any new buying efforts and suggests selling stocks on a case-by-case basis, raising cash levels to reduce market exposure. The Featured Stocks Page provides the most timely analysis on high-ranked leaders. Charts used courtesy of www.stockcharts.com
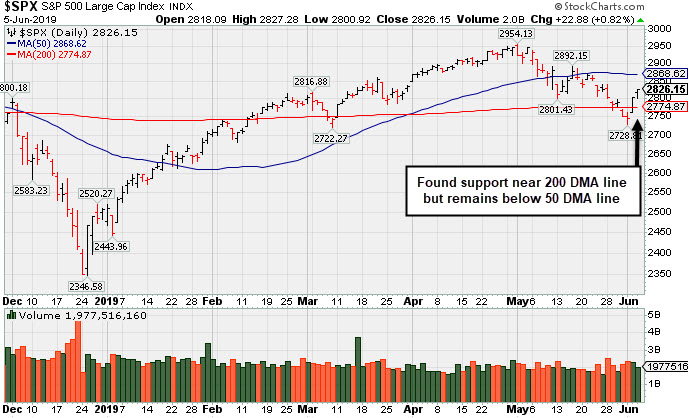
PICTURED: The S&P 500 Index found support near its 200-day moving average (DMA) line but remains below its 50 DMA line.
The Dow Jones Industrial Average and Nasdaq Composite Index have also rebounded above their respective long-term 200-day moving average (DMA) lines. Disciplined investors will be watching between Day 4 and Day 7 for a follow-through day of big gains (more than +1%) from at least one of the major indices backed with higher volume and an expansion in stocks reaching new 52-week highs - all of which are critical components for a new confirmed uptrend under the fact-based system.
Stocks finished higher Wednesday amid trade optimism and increased expectations for Fed interest rate cuts. Hopes of a negotiated trade solution between the U.S. and Mexico further bolstered investor sentiment.
Ten of 11 S&P 500 sectors closed in positive territory, with Tech, Industrials, and Consumer Staples rising more than 1%. Energy shares lagged as oil entered bear market territory, defined as sinking more than 20% below its recent peak (in April). WTI crude settled 3.4% lower at $51.68/barrel amid a surprise surge in U.S. crude stockpiles. In earnings, Salesforce.com (CRM +5.06%) rose after the software company easily topped analyst projections on the top and bottom line.
On the data front, the Institute for Supply Management revealed services sector activity expanded at a faster-than-expected clip in May. A separate report showed the U.S. private sector added 27,000 jobs last month, the weakest reading since May 2010. The soft figure bolstered the case for lower rates ahead of Friday’s more comprehensive jobs report. The U.S. Treasury yield curve steepened, with the yield spread between the two- and 10-year notes widening the most since November. The yield on the 10-year note was unchanged at 2.12%, while the yield on the two-year note dropped four basis points to 1.84%.
|
 Kenneth J. Gruneisen started out as a licensed stockbroker in August 1987, a couple of months prior to the historic stock market crash that took the Dow Jones Industrial Average down -22.6% in a single day. He has published daily fact-based fundamental and technical analysis on high-ranked stocks online for two decades. Through FACTBASEDINVESTING.COM, Kenneth provides educational articles, news, market commentary, and other information regarding proven investment systems that work in good times and bad.
Comments contained in the body of this report are technical opinions only and are not necessarily those of Gruneisen Growth Corp. The material herein has been obtained from sources believed to be reliable and accurate, however, its accuracy and completeness cannot be guaranteed. Our firm, employees, and customers may effect transactions, including transactions contrary to any recommendation herein, or have positions in the securities mentioned herein or options with respect thereto. Any recommendation contained in this report may not be suitable for all investors and it is not to be deemed an offer or solicitation on our part with respect to the purchase or sale of any securities. |
|
 |
Retail, Broker/Dealer and Networking Indexes Rose
Kenneth J. Gruneisen - Passed the CAN SLIM® Master's Exam
The Retail Index ($RLX +0.44%) and Broker/Dealer Index ($XBD +0.46%) both posted modest gains while the Bank Index ($BKX -0.16%) ended the session slightly lower. The tech sector was mixed as the Semiconductor Index ($SOX -0.75%) fell while the Biotech Index ($BTK +0.11%) finished flat and the Networking Index ($NWX +1.30%) posted a solid gain. The Gold & Silver Index ($XAU +0.14%) eked out a small gain, but energy-linked groups were weaker as the Oil Services Index ($OSX -2.31%) and the Integrated Oil Index ($XOI -1.36%) both fell. Charts courtesy of www.stockcharts.com
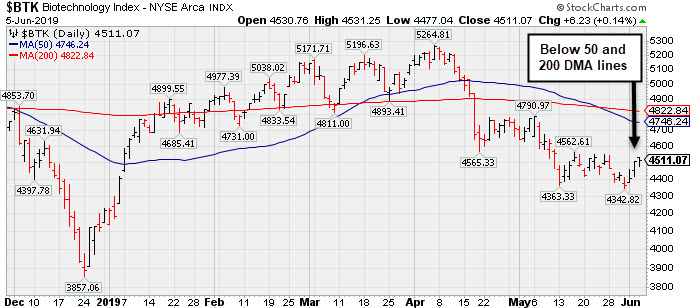 PICTURED: The Biotech Index ($BTK +0.11%) posted a 3rd consecutive gain but remains below its 50-day and 200-day moving average (DMA) lines.
| Oil Services |
$OSX |
74.80 |
-1.77 |
-2.31% |
-7.20% |
| Integrated Oil |
$XOI |
1,180.66 |
-16.26 |
-1.36% |
+1.86% |
| Semiconductor |
$SOX |
1,345.10 |
-10.16 |
-0.75% |
+16.44% |
| Networking |
$NWX |
558.62 |
+7.17 |
+1.30% |
+14.31% |
| Broker/Dealer |
$XBD |
261.31 |
+1.21 |
+0.46% |
+10.10% |
| Retail |
$RLX |
2,215.85 |
+9.74 |
+0.44% |
+13.55% |
| Gold & Silver |
$XAU |
73.70 |
+0.10 |
+0.14% |
+4.30% |
| Bank |
$BKX |
95.70 |
-0.15 |
-0.16% |
+11.55% |
| Biotech |
$BTK |
4,511.07 |
+6.23 |
+0.14% |
+6.88% |
|
|
|
 |
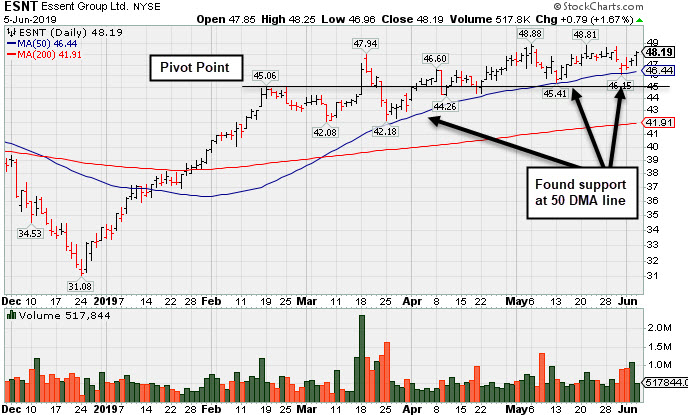
Still Hovering Not Far From 52-Week High
Kenneth J. Gruneisen - Passed the CAN SLIM® Master's Exam
Essent Group Ltd (ESNT +$0.79 or +1.67% to $48.19) has found support above its 50-day moving average (DMA) line ($46.44) reassuringly during the recent consolidation. It faces very little resistance due to overhead supply up to the $50 level.
It was last shown in this FSU section on 4/25/19 with an annotated graph under the headline, "Perched Above Pivot Point With Earnings News Due May 3rd". It reported earnings +15% on +20% sales revenues for the Mar '19 quarter, breaking the prior streak of 4 consecutive comparisons above the +25% minimum earnings guideline (C criteria).
Its annual earnings (A criteria) history has been good since its $17 IPO on 10/31/13. ESNT was highlighted in yellow with new pivot point cited based on its 2/19/19 high in the 3/18/19 mid-day report (read here). The number of top-rated funds owning its shares rose from 317 in Mar '16 to 627 in Mar '19, a reassuring sign concerning the I criteria. Its current Up/Down Volume Ratio of 1.7 is an unbiased indication its shares have been under accumulation over the past 50 days.
|
|
|
Color Codes Explained :
Y - Better candidates highlighted by our
staff of experts.
G - Previously featured
in past reports as yellow but may no longer be buyable under the
guidelines.
***Last / Change / Volume data in this table is the closing quote data***
Symbol/Exchange
Company Name
Industry Group |
PRICE |
CHANGE
(%Change) |
Day High |
Volume
(% DAV)
(% 50 day avg vol) |
52 Wk Hi
% From Hi |
Featured
Date |
Price
Featured |
Pivot Featured |
|
Max Buy |
 SPSC
-
NASDAQ
SPSC
-
NASDAQ
S P S Commerce Inc
COMPUTER SOFTWARE and SERVICES - Application Software
|
$105.86
|
+0.30
0.28% |
$106.99
|
75,931
47.76% of 50 DAV
50 DAV is 159,000
|
$115.00
-7.95%
|
3/26/2019
|
$107.12
|
PP = $113.41
|
|
MB = $119.08
|
Most Recent Note - 6/4/2019 6:19:36 PM
G - Rebounded above its 50 DMA line ($104.02) with today's 2nd consecutive volume-driven gain helping its technical stance. Still faces some resistance due to overhead supply up to the $115 level. Recent lows in the $98-99 area define important near-term support to watch. Fundamentals remain strong.
>>> FEATURED STOCK ARTICLE : Sputtering Near 50-Day Average Line Building Base-On-Base - 5/1/2019 |
View all notes |
Set NEW NOTE alert |
Company Profile |
SEC
News |
Chart |
Request a new note
C
A
S
I |
EPAM
-
NYSE
Epam Systems Inc
COMPUTER SOFTWARE and SERVICES - Information Technology Service
|
$170.16
|
+1.98
1.18% |
$170.51
|
389,469
79.48% of 50 DAV
50 DAV is 490,000
|
$180.55
-5.75%
|
5/9/2019
|
$169.25
|
PP = $180.55
|
|
MB = $189.58
|
Most Recent Note - 6/3/2019 9:04:22 PM
G - Met resistance near its 50 DMA line ($171) and slumped with losses on heavier than average volume for the past week. A rebound above that important short-term average is needed for its outlook to improve. Reported earnings +34% on +23% sales revenues for the Mar '19 quarter, continuing its strong earnings track record.
>>> FEATURED STOCK ARTICLE : Found Support and Closed in Upper Third of Day's Range - 5/9/2019 |
View all notes |
Set NEW NOTE alert |
Company Profile |
SEC
News |
Chart |
Request a new note
C
A
S
I |
ENV
-
NYSE
Envestnet Inc
FINANCIAL SERVICES - Diversified Investments
|
$68.93
|
+0.03
0.04% |
$69.33
|
174,500
61.66% of 50 DAV
50 DAV is 283,000
|
$72.67
-5.15%
|
3/15/2019
|
$66.05
|
PP = $64.90
|
|
MB = $68.15
|
Most Recent Note - 6/4/2019 6:07:36 PM
G - Rebounded above its 50 DMA line ($68.27) today helping its technical stance. Weak action came after recently reporting earnings +5% on +1% sales revenues for the Mar '19 quarter, below the +25% minimum earnings guideline (C criteria). The prior high ($64.80 on 9/14/18) defines important near-term support to watch. See the latest FSU analysis for more details and a new annotated graph.
>>> FEATURED STOCK ARTICLE : Rebound Above 50-Day Moving Average Improved Technical Stance - 6/4/2019 |
View all notes |
Set NEW NOTE alert |
Company Profile |
SEC
News |
Chart |
Request a new note
C
A
S
I |
TPL
-
NYSE
Texas Pacific Land Trust
Real Estate Dvlpmt/Ops
|
$737.26
|
-15.74
-2.09% |
$752.64
|
20,984
139.89% of 50 DAV
50 DAV is 15,000
|
$915.66
-19.48%
|
5/15/2019
|
$850.01
|
PP = $915.76
|
|
MB = $961.55
|
 Most Recent Note - 6/5/2019 5:50:40 PM
Sputtering at its 200 DMA line ($733). It will be dropped from the Featured Stocks list tonight. A rebound above its 50 DMA line ($820) is needed for its outlook to improve. Its Relative Strength Rating has slumped to 78, below the 80+ minimum guideline for buy candidates.
>>> FEATURED STOCK ARTICLE : Recently Found Support and Rose Toward All-Time High - 5/17/2019 |
View all notes |
Set NEW NOTE alert |
Company Profile |
SEC
News |
Chart |
Request a new note
C
A
S
I |
LHCG
-
NASDAQ
L H C Group Inc
HEALTH SERVICES - Home Health Care
|
$115.31
|
-1.82
-1.55% |
$117.93
|
147,876
58.68% of 50 DAV
50 DAV is 252,000
|
$122.20
-5.64%
|
4/29/2019
|
$110.94
|
PP = $115.64
|
|
MB = $121.42
|
Most Recent Note - 6/4/2019 6:22:49 PM
Y - Rebounded above its pivot point with today's 4th consecutive gain backed by lighter than average volume. Its 50 DMA line ($111) defines near-term support. Fundamentals remain strong.
>>> FEATURED STOCK ARTICLE : Long-Term Care Firm Hovering Near All-Time High - 5/14/2019 |
View all notes |
Set NEW NOTE alert |
Company Profile |
SEC
News |
Chart |
Request a new note
C
A
S
I |
Symbol/Exchange
Company Name
Industry Group |
PRICE |
CHANGE
(%Change) |
Day High |
Volume
(% DAV)
(% 50 day avg vol) |
52 Wk Hi
% From Hi |
Featured
Date |
Price
Featured |
Pivot Featured |
|
Max Buy |
ENSG
-
NASDAQ
Ensign Group Inc
HEALTH SERVICES - Long-Term Care Facilities
|
$53.60
|
+0.09
0.17% |
$53.97
|
202,464
67.26% of 50 DAV
50 DAV is 301,000
|
$58.14
-7.81%
|
4/30/2019
|
$51.46
|
PP = $53.30
|
|
MB = $55.97
|
Most Recent Note - 6/3/2019 9:01:17 PM
Y - Showing resilience in recent weeks after it reported earnings +22% on +12% sales revenues for the Mar '19 quarter, below the +25% minimum earnings guideline (C criteria), raising fundamental concerns. Its 50 DMA line ($52.05) defines near-term support to watch. See the latest FSU analysis for more details and a new annotated graph.
>>> FEATURED STOCK ARTICLE : Resilient After Latest Quarterly Report Missed Minimum Guideline - 6/3/2019 |
View all notes |
Set NEW NOTE alert |
Company Profile |
SEC
News |
Chart |
Request a new note
C
A
S
I |
CHDN
-
NASDAQ
Churchill Downs Inc
LEISURE - Gaming Activities
|
$109.07
|
+6.29
6.12% |
$109.98
|
758,595
247.91% of 50 DAV
50 DAV is 306,000
|
$102.97
5.92%
|
6/5/2019
|
$108.87
|
PP = $104.96
|
|
MB = $110.21
|
Most Recent Note - 6/5/2019 12:12:49 PM
Y - Color code is changed to yellow with new pivot point cited based on its 5/16/18 high plus 10 cents. Triggering a technical buy signal with today's 5th consecutive gain backed by above average volume. Share price was impacted by a 3:1 split when last noted on 1/28/19. Its Relative Strength Rating is 87, above the 80+ minimum guideline for buy candidates. Fundamentals have remained strong since dropped from the Featured Stocks list on 8/20/18.
>>> FEATURED STOCK ARTICLE : Consolidating Near 50-Day Moving Average - 6/29/2018 |
View all notes |
Set NEW NOTE alert |
Company Profile |
SEC
News |
Chart |
Request a new note
C
A
S
I |
LULU
-
NASDAQ
Lululemon Athletica
MANUFACTURING - Textile Manufacturing
|
$173.52
|
+4.52
2.67% |
$173.82
|
1,808,643
79.78% of 50 DAV
50 DAV is 2,267,000
|
$179.50
-3.33%
|
3/28/2019
|
$169.20
|
PP = $164.89
|
|
MB = $173.13
|
Most Recent Note - 6/4/2019 6:10:26 PM
G - Rebounded but it is still below its 50 DMA line ($170.08) which may act as resistance. Found support last week near prior highs. Due to report Apr '19 quarterly earnings news after the close on Wednesday, June 12th. Volume and volatility often increase near earnings news.
>>> FEATURED STOCK ARTICLE : Volume Light While Hovering Near High - 5/10/2019 |
View all notes |
Set NEW NOTE alert |
Company Profile |
SEC
News |
Chart |
Request a new note
C
A
S
I |
ULTA
-
NASDAQ
Ulta Beauty Inc
SPECIALTY RETAIL - Specialty Retail, Other
|
$337.48
|
+1.95
0.58% |
$338.64
|
554,111
75.91% of 50 DAV
50 DAV is 730,000
|
$359.69
-6.17%
|
3/15/2019
|
$341.27
|
PP = $322.59
|
|
MB = $338.72
|
Most Recent Note - 6/4/2019 6:26:14 PM
G - Posted a gain today, but still needs gains above its 50 DMA line ($345) for its outlook to improve. Rebounded from a deep early loss on 5/31/19 after gapping down. Reported earnings +17% on +13% sales revenues for the Apr '19 quarter, below the +25% minimum earnings guideline (C criteria), raising fundamental concerns. Faces resistance due to overhead supply up to the $359 level.
>>> FEATURED STOCK ARTICLE : Volume Totals Cooling in Recent Weeks While Hovering Near High - 4/26/2019 |
View all notes |
Set NEW NOTE alert |
Company Profile |
SEC
News |
Chart |
Request a new note
C
A
S
I |
ESNT
-
NYSE
Essent Group Ltd
Finance-MrtgandRel Svc
|
$48.19
|
+0.79
1.67% |
$48.25
|
517,844
87.77% of 50 DAV
50 DAV is 590,000
|
$48.88
-1.41%
|
3/18/2019
|
$45.84
|
PP = $45.06
|
|
MB = $47.31
|
Most Recent Note - 6/5/2019 5:43:17 PM
Y - Found support above its 50 DMA line ($46.44) during its consolidation in recent months. Faces very little resistance due to overhead supply up to the $50 level while perched very near its 52-week high. Recently reported earnings +15% on +20% sales revenues for the Mar '19 quarter, below the +25% minimum earnings guideline (C criteria), raising fundamental concerns. See the latest FSU analysis for more details and a new annotated graph.
>>> FEATURED STOCK ARTICLE : Still Hovering Not Far From 52-Week High - 6/5/2019 |
View all notes |
Set NEW NOTE alert |
Company Profile |
SEC
News |
Chart |
Request a new note
C
A
S
I |
Symbol/Exchange
Company Name
Industry Group |
PRICE |
CHANGE
(%Change) |
Day High |
Volume
(% DAV)
(% 50 day avg vol) |
52 Wk Hi
% From Hi |
Featured
Date |
Price
Featured |
Pivot Featured |
|
Max Buy |
FIVE
-
NASDAQ
Five Below Inc
Retail-DiscountandVariety
|
$123.05
|
-3.53
-2.79% |
$127.84
|
2,346,096
195.18% of 50 DAV
50 DAV is 1,202,000
|
$148.22
-16.98%
|
4/11/2019
|
$132.05
|
PP = $133.75
|
|
MB = $140.44
|
Most Recent Note - 6/5/2019 5:47:37 PM
Reported earnings +0% on +23% sales revenues for the Apr '19 quarter, below the +25% minimum earnings guideline (C criteria), raising more fundamental concerns. Suffered another loss with above average volume today. Undercut the recent low ($123.64 on 5/20/19) and nearly tested its 200 DMA line ($120.74) defining the next important support. A rebound above the 50 DMA line is needed for its outlook to improve. It will be dropped from the Featured Stocks list tonight.
>>> FEATURED STOCK ARTICLE : Rallied But Slumped Back Near 50-Day Moving Average - 5/28/2019 |
View all notes |
Set NEW NOTE alert |
Company Profile |
SEC
News |
Chart |
Request a new note
C
A
S
I |
NOW
-
NYSE
Servicenow Inc
Computer Sftwr-Enterprse
|
$263.25
|
+5.70
2.21% |
$263.88
|
1,824,810
103.27% of 50 DAV
50 DAV is 1,767,000
|
$281.74
-6.56%
|
4/22/2019
|
$242.64
|
PP = $251.75
|
|
MB = $264.34
|
Most Recent Note - 6/4/2019 6:17:35 PM
G - Rebounded above its 50 DMA line ($256) with today's big gain after finding support near the prior high ($251.65 on 3/21/19). Recently reported earnings +20% on +34% sales revenues for the Mar '19 quarter, below the +25% minimum earnings guideline (C criteria), raising concerns, fundamentally.
>>> FEATURED STOCK ARTICLE : Leader Consolidating Above 50-Day Moving Average Line - 5/29/2019 |
View all notes |
Set NEW NOTE alert |
Company Profile |
SEC
News |
Chart |
Request a new note
C
A
S
I |
QLYS
-
NASDAQ
Qualys Inc
Computer Sftwr-Security
|
$85.80
|
+0.41
0.48% |
$86.83
|
221,865
70.30% of 50 DAV
50 DAV is 315,600
|
$98.30
-12.72%
|
5/23/2019
|
$90.43
|
PP = $98.40
|
|
MB = $103.32
|
Most Recent Note - 6/4/2019 6:13:29 PM
G - Rebounded near its 50 today after finding prompt support near its 200 DMA line. Its Relative Strength Rating is 77, below the 80+ minimum guideline for buy candidates. Met stubborn resistance in the $97-98 area. Reported earnings +36% on +16% sales revenues for the Mar '19 quarter, continuing its strong earnings history.
>>> FEATURED STOCK ARTICLE : Rallying to Challenge Previously Stubborn Resistance - 5/2/2019 |
View all notes |
Set NEW NOTE alert |
Company Profile |
SEC
News |
Chart |
Request a new note
C
A
S
I |
VEEV
-
NYSE
Veeva Systems Inc Cl A
Computer Sftwr-Medical
|
$158.09
|
+2.51
1.61% |
$159.80
|
1,944,655
158.62% of 50 DAV
50 DAV is 1,226,000
|
$156.98
0.71%
|
5/30/2019
|
$154.32
|
PP = $145.80
|
|
MB = $153.09
|
Most Recent Note - 6/4/2019 12:40:31 PM
Y - Pulled back for 2 consecutive volume-driven losses after rallying from an advanced "3 weeks tight" base. Reported earnings +52% on +25% sales revenues for the Apr '19 quarter, marking its 5th strong quarter with earnings above the +25% minimum guideline (C criteria). Disciplined investors will note that no new buying efforts are to be made during market corrections (M criteria) under the fact-based investment system's rules. Watch for a confirmed rally with a follow-through day first. See the latest FSU analysis for more details and an annotated graph.
>>> FEATURED STOCK ARTICLE : Big Volume-Driven Gain for New High Following Earnings News - 5/30/2019 |
View all notes |
Set NEW NOTE alert |
Company Profile |
SEC
News |
Chart |
Request a new note
C
A
S
I |
PAYC
-
NYSE
Paycom Software Inc
COMPUTER SOFTWARE and SERVICES - Application Software
|
$216.77
|
+7.75
3.71% |
$216.77
|
731,116
100.84% of 50 DAV
50 DAV is 725,000
|
$215.65
0.52%
|
2/6/2019
|
$171.66
|
PP = $164.18
|
|
MB = $172.39
|
Most Recent Note - 6/4/2019 6:11:57 PM
G - Rebounded near its all-time high with today's big gain after testing its 50 DMA line ($197.77) which defines important near-term support to watch. Reported earnings +25% on +30% sales revenues for the Mar '19 quarter.
>>> FEATURED STOCK ARTICLE : Posted Volume-Driven Gain While Hovering Near All-Time High - 5/31/2019 |
View all notes |
Set NEW NOTE alert |
Company Profile |
SEC
News |
Chart |
Request a new note
C
A
S
I |
Symbol/Exchange
Company Name
Industry Group |
PRICE |
CHANGE
(%Change) |
Day High |
Volume
(% DAV)
(% 50 day avg vol) |
52 Wk Hi
% From Hi |
Featured
Date |
Price
Featured |
Pivot Featured |
|
Max Buy |
PYPL
-
NASDAQ
Paypal Holdings Inc
Finance-CrdtCard/PmtPr
|
$110.77
|
+2.04
1.88% |
$110.88
|
6,178,710
101.17% of 50 DAV
50 DAV is 6,107,000
|
$114.66
-3.39%
|
1/24/2019
|
$92.56
|
PP = $93.80
|
|
MB = $98.49
|
Most Recent Note - 6/3/2019 9:20:38 PM
G - Violated its 50 DMA line ($108.38) and prior low ($106.52) with today's big volume-driven loss triggering technical sell signals. Recently reported earnings +37% on +12% sales revenues for the Mar '19 quarter, continuing its strong earnings track record.
>>> FEATURED STOCK ARTICLE : Hovering Near All Time High Extended From Any Sound Base - 5/15/2019 |
View all notes |
Set NEW NOTE alert |
Company Profile |
SEC
News |
Chart |
Request a new note
C
A
S
I |
PLNT
-
NYSE
Planet Fitness Inc Cl A
Leisure-Services
|
$77.84
|
+0.33
0.43% |
$78.52
|
776,427
54.79% of 50 DAV
50 DAV is 1,417,000
|
$81.76
-4.79%
|
11/7/2018
|
$57.10
|
PP = $55.45
|
|
MB = $58.22
|
Most Recent Note - 6/4/2019 6:23:50 PM
G - Extended from any sound base, consolidating above its 50 DMA line ($73.96) and prior low which define near-term support levels to watch. Violations would raise concerns and trigger technical sell signals. Fundamentals remain strong.
>>> FEATURED STOCK ARTICLE : Pulling Back From High After Impressive Rally - 5/23/2019 |
View all notes |
Set NEW NOTE alert |
Company Profile |
SEC
News |
Chart |
Request a new note
C
A
S
I |
BLD
-
NYSE
Topbuild Corp
Bldg-Constr Prds/Misc
|
$81.44
|
-0.18
-0.22% |
$82.68
|
253,129
80.36% of 50 DAV
50 DAV is 315,000
|
$87.21
-6.62%
|
5/17/2019
|
$82.19
|
PP = $87.31
|
|
MB = $91.68
|
Most Recent Note - 6/4/2019 6:21:18 PM
Y - Posted a 4th consecutive gain today with ever-increasing volume. Subsequent gains above the pivot point backed by at least +40% above average volume may trigger a technical buy signal. Fundamentals remain strong.
>>> FEATURED STOCK ARTICLE : Encountered Distributional Pressure Near Prior High - 5/20/2019 |
View all notes |
Set NEW NOTE alert |
Company Profile |
SEC
News |
Chart |
Request a new note
C
A
S
I |
TEAM
-
NASDAQ
Atlassian Corp Plc Cl A
Comp Sftwr-Spec Enterprs
|
$126.43
|
+3.78
3.08% |
$126.62
|
1,454,878
79.98% of 50 DAV
50 DAV is 1,819,000
|
$132.87
-4.85%
|
5/24/2019
|
$129.52
|
PP = $132.09
|
|
MB = $138.69
|
Most Recent Note - 6/4/2019 6:14:26 PM
Y - Posted a gain today with lighter volume after testing the prior high ($117) which defines important neat-term support to watch. More damaging losses would raise greater concerns and trigger a technical sell signal. Reported earnings +133% on +38% sales revenues for the Mar '19 quarter, continuing its strong earnings track record.
>>> FEATURED STOCK ARTICLE : Perched Near All-Time High After "3-Weeks Tight" - 5/24/2019 |
View all notes |
Set NEW NOTE alert |
Company Profile |
SEC
News |
Chart |
Request a new note
C
A
S
I |
GLOB
-
NYSE
Globant SA
Computer-Tech Services
|
$90.76
|
+0.88
0.98% |
$92.74
|
336,450
90.93% of 50 DAV
50 DAV is 370,000
|
$93.50
-2.93%
|
2/15/2019
|
$69.35
|
PP = $70.00
|
|
MB = $73.50
|
Most Recent Note - 6/3/2019 9:12:51 PM
G - Abruptly retreated from its all-time high with a big loss today on higher volume. Very extended from any sound base. Its 50 DMA line ($80.81) defines important support above the prior high ($74). Violations would raise concerns and trigger technical sell signals. Reported earnings +32% on +22% sales revenues for the quarter ended March 31st, 2019 versus the year ago period, continuing its strong earning track record.
>>> FEATURED STOCK ARTICLE : Earnings News Due While Perched Near All-Time High - 5/7/2019 |
View all notes |
Set NEW NOTE alert |
Company Profile |
SEC
News |
Chart |
Request a new note
C
A
S
I |
Symbol/Exchange
Company Name
Industry Group |
PRICE |
CHANGE
(%Change) |
Day High |
Volume
(% DAV)
(% 50 day avg vol) |
52 Wk Hi
% From Hi |
Featured
Date |
Price
Featured |
Pivot Featured |
|
Max Buy |
|
|
|
THESE ARE NOT BUY RECOMMENDATIONS!
Comments contained in the body of this report are technical
opinions only. The material herein has been obtained
from sources believed to be reliable and accurate, however,
its accuracy and completeness cannot be guaranteed.
This site is not an investment advisor, hence it does
not endorse or recommend any securities or other investments.
Any recommendation contained in this report may not
be suitable for all investors and it is not to be deemed
an offer or solicitation on our part with respect to
the purchase or sale of any securities. All trademarks,
service marks and trade names appearing in this report
are the property of their respective owners, and are
likewise used for identification purposes only.
This report is a service available
only to active Paid Premium Members.
You may opt-out of receiving report notifications
at any time. Questions or comments may be submitted
by writing to Premium Membership Services 665 S.E. 10 Street, Suite 201 Deerfield Beach, FL 33441-5634 or by calling 1-800-965-8307
or 954-785-1121.
|
|
|