You are not logged in.
This means you
CAN ONLY VIEW reports that were published prior to Sunday, February 25, 2024.
You
MUST UPGRADE YOUR MEMBERSHIP if you want to see any current reports.
AFTER MARKET UPDATE - WEDNESDAY, JUNE 3RD, 2020
Previous After Market Report Next After Market Report >>>
|
|
|
|
DOW |
+527.24 |
26,269.89 |
+2.05% |
|
Volume |
1,088,762,998 |
+8% |
|
Volume |
4,634,991,500 |
+17% |
|
NASDAQ |
+73.42 |
9,681.79 |
+0.76% |
|
Advancers |
2,344 |
81% |
|
Advancers |
2,239 |
68% |
|
S&P 500 |
+42.05 |
3,122.87 |
+1.36% |
|
Decliners |
555 |
19% |
|
Decliners |
1,041 |
32% |
|
Russell 2000 |
+33.88 |
1,452.09 |
+2.39% |
|
52 Wk Highs |
71 |
|
|
52 Wk Highs |
122 |
|
|
S&P 600 |
+29.01 |
849.27 |
+3.54% |
|
52 Wk Lows |
2 |
|
|
52 Wk Lows |
8 |
|
|
 |
Major Indices Rise With Greater Volume and More Leadership
Kenneth J. Gruneisen - Passed the CAN SLIM® Master's Exam
The S&P 500 advanced 1.4% to its best level in three months and now sits within 8% of its record high reached on February 19. The Dow climbed 527 points, while the Nasdaq Composite was up 0.8%. The Nasdaq 100 logged a fresh all-time high intraday, while the small-cap Russell 2000 Index surged 2.7%. Breadth was positive as advancers led decliners by more than a 4-1 margin on the NYSE and by a 2-1 margin on the Nasdaq exchange. The reported volume totals were higher than the prior session on the NYSE and on the Nasdaq exchange, indicative of greater institutional buying demand. There were 65 high-ranked companies from the Leaders List that hit new 52-week highs and were listed on the BreakOuts Page, versus 48 on the prior session. New 52-week highs totals expanded and easily outnumbered new 52-week lows totals on the NYSE and on the Nasdaq exchange. The major indices are in a confirmed uptrend (M criteria). Any sustainable rally requires a healthy crop of new leaders, so the recent improvement in new highs totals was noted as an encouraging sign. Charts used courtesy of www.stockcharts.com
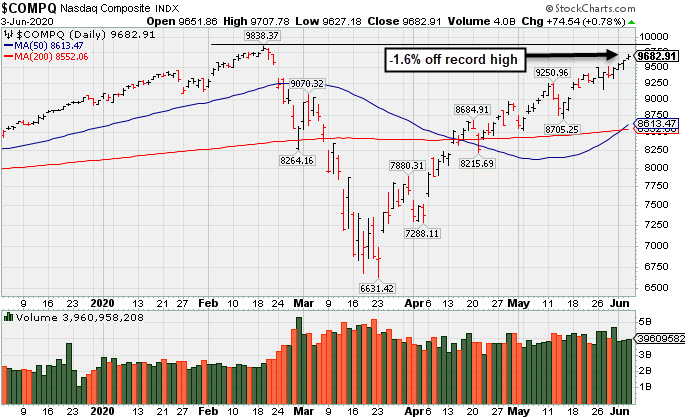
PICTURED: The Nasdaq Composite Index finished -1.6% off its record high hit on 2/19/20.
Stocks finished higher on Wednesday as encouraging data reports fueled hopes for a quick economic recovery. On the data front, separate gauges of U.S. services sector activity showed signs of stabilization in May. Additionally, the ADP revealed private payrolls declined by less than 2.8 million in May, significantly lower than forecasts of 9 million and April’s 19.6 million figure. Overseas, China’s Caixin services PMI returned to expansionary territory for the first time since January, while activity in the eurozone also improved.
Treasuries weakened, with the yield on the 10-year note up eight basis points to 0.76%. Other perceived safe haven assets declined, with a gauge of the U.S. dollar slipping to its lowest point since early March.
Ten of 11 S&P 500 sectors closed in positive territory, with Health Care the sole laggard. The more cyclical and value-oriented groups outperformed, with Financials and Industrials each rallying nearly 4%. In stock news, Boeing (BA +12.95%) rose on reports that private investment firm Third Point acquired a stake in the jet maker. Elsewhere, Microchip Technology (MCHP +12.34%) rose following a boost to its current-quarter forecasts. In earnings, Zoom Video Communications (ZM +7.59%) hit another new high after the company doubled its full-year revenue projections on the heels of a solid earnings beat. |
 Kenneth J. Gruneisen started out as a licensed stockbroker in August 1987, a couple of months prior to the historic stock market crash that took the Dow Jones Industrial Average down -22.6% in a single day. He has published daily fact-based fundamental and technical analysis on high-ranked stocks online for two decades. Through FACTBASEDINVESTING.COM, Kenneth provides educational articles, news, market commentary, and other information regarding proven investment systems that work in good times and bad.
Comments contained in the body of this report are technical opinions only and are not necessarily those of Gruneisen Growth Corp. The material herein has been obtained from sources believed to be reliable and accurate, however, its accuracy and completeness cannot be guaranteed. Our firm, employees, and customers may effect transactions, including transactions contrary to any recommendation herein, or have positions in the securities mentioned herein or options with respect thereto. Any recommendation contained in this report may not be suitable for all investors and it is not to be deemed an offer or solicitation on our part with respect to the purchase or sale of any securities. |
|
 |
Financial, Energy, Semiconductor and Networking Indexes Rose
Kenneth J. Gruneisen - Passed the CAN SLIM® Master's Exam
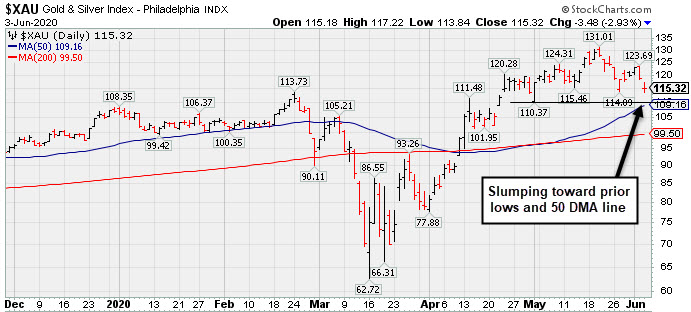
The Bank Index ($BKX +5.22%) and the Broker/Dealer Index ($XBD +3.74%) both posted considerable gains on Wednesday. The Retail Index ($RLX +0.60%) posted a smaller gain. The tech sector was mixed as the Semiconductor Index ($SOX +2.87%) and Networking Index ($NWX +1.76%) each posted gains, meanwhile the Biotech Index ($BTK -0.74%) lost ground. Commodity-linked groups were mixed as the Oil Services Index ($OSX +3.22%) and Integrated Oil Index ($XOI +2.95%) both rose.
PICTURED: The Gold & Silver Index ($XAU -2.93%) was a standout decliner, slumping toward its prior lows and its 50-day moving average (DMA) line.
| Oil Services |
$OSX |
35.21 |
+1.10 |
+3.22% |
-55.03% |
| Integrated Oil |
$XOI |
856.58 |
+24.52 |
+2.95% |
-32.58% |
| Semiconductor |
$SOX |
1,936.56 |
+53.15 |
+2.82% |
+4.70% |
| Networking |
$NWX |
571.15 |
+9.86 |
+1.76% |
-2.10% |
| Broker/Dealer |
$XBD |
277.80 |
+10.02 |
+3.74% |
-4.33% |
| Retail |
$RLX |
2,852.02 |
+16.89 |
+0.60% |
+16.44% |
| Gold & Silver |
$XAU |
115.32 |
-3.48 |
-2.93% |
+7.86% |
| Bank |
$BKX |
80.38 |
+3.99 |
+5.22% |
-29.09% |
| Biotech |
$BTK |
5,639.89 |
-42.15 |
-0.74% |
+11.30% |
|
|
|
 |
Trade Desk Posts Powerful Gain for New High
Kenneth J. Gruneisen - Passed the CAN SLIM® Master's Exam
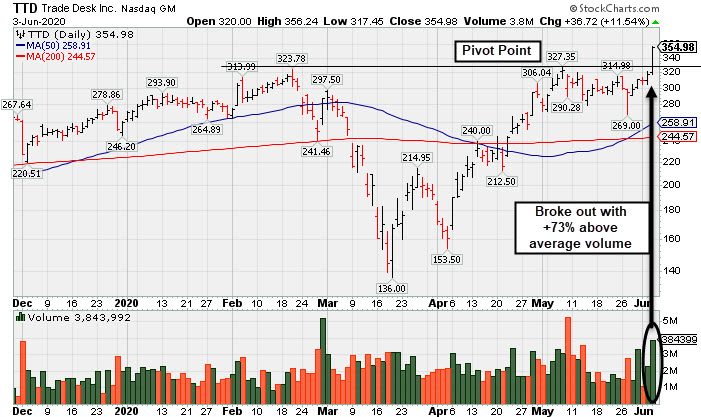
The Trade Desk Inc Cl A (TTD +$36.72 or +11.54% to $354.980 finished strong after highlighted in yellow with new pivot point cited based on its 5/07/20 high in the earlier mid-day report (read here). It hit a new all-time high with today's big gain following a deep pullback and a 3-week handle-like consolidation. The big gain and strong close above the pivot point was backed by +73% above average volume triggering a convincing technical buy signal.
Fundamentals remain strong after it reported Mar '20 quarterly earnings +84% on +33% sales revenues, and 6 of the past 7 quarterly comparisons were above the +25% minimum earnings guideline (C criteria). The Comml Svcs-Advertising firm made a choppy ascent since last shown in this FSU section on 9/09/19 with an annotated graph under the headline, "Distributional Action Weighs on Prior Leader". Its annual earnings (A criteria) history has been strong, and it has a highest possible 99 Earnings Per Share Rating.
The number of top-rated funds owning its shares rose from 280 in Mar '18 to 587 in Mar '20, a reassuring sign concerning the I criteria. Its current Up/Down Volume Ratio of 1.5 is an unbiased indication its shares have been under accumulation over the past 50 days. It has a Timeliness Rating of A and a Sponsorship Rating of B. There are only 46.1 million shares outstanding (S criteria) which can contribute to greater volatility in the event of institutional buying or selling.
Charts courtesy of www.stockcharts.com
|
|
|
Color Codes Explained :
Y - Better candidates highlighted by our
staff of experts.
G - Previously featured
in past reports as yellow but may no longer be buyable under the
guidelines.
***Last / Change / Volume data in this table is the closing quote data***
Symbol/Exchange
Company Name
Industry Group |
PRICE |
CHANGE
(%Change) |
Day High |
Volume
(% DAV)
(% 50 day avg vol) |
52 Wk Hi
% From Hi |
Featured
Date |
Price
Featured |
Pivot Featured |
|
Max Buy |
 FTNT
-
NASDAQ
FTNT
-
NASDAQ
Fortinet Inc
Computer Sftwr-Security
|
$142.89
|
-1.05
-0.73% |
$145.69
|
1,007,882
46.62% of 50 DAV
50 DAV is 2,162,000
|
$149.69
-4.54%
|
5/7/2020
|
$134.40
|
PP = $121.92
|
|
MB = $128.02
|
Most Recent Note - 6/1/2020 5:56:33 PM
G - Challenged its prior high with today's big third consecutive gain backed by near average or lighter volume totals. Prior highs in the $121 area define initial support to watch.
>>> FEATURED STOCK ARTICLE : Extended From Prior Base and Holding Ground Stubbornly - 5/22/2020 |
View all notes |
Set NEW NOTE alert |
Company Profile |
SEC
News |
Chart |
Request a new note
C
A
S
I |
EBS
-
NYSE
Emergent Biosolutions
DRUGS - Biotechnology
|
$86.35
|
-2.95
-3.30% |
$89.48
|
547,493
104.88% of 50 DAV
50 DAV is 522,000
|
$93.58
-7.73%
|
6/1/2020
|
$72.10
|
PP = $90.10
|
|
MB = $94.61
|
 Most Recent Note - 6/3/2020 6:12:07 PM
Y - Pulled back from its all-time high with a loss today on lighter (near average) volume. Color code was changed to yellow after forming an advanced "3 weeks tight" base pattern with a new pivot point cited based on its 5/12/20 high plus 10 cents. Subsequent gains and a strong close above the pivot point backed by at least +40% above average volume are still needed to clinch a convincing new (or add-on) technical buy signal. Prior low ($78.28 on 5/14/20) defines initial support above its 50 DMA line ($72.57). Fundamentals remain strong.
>>> FEATURED STOCK ARTICLE : Volume Light Behind Recent Pullback From All-Time High - 5/26/2020 |
View all notes |
Set NEW NOTE alert |
Company Profile |
SEC
News |
Chart |
Request a new note
C
A
S
I |
NBIX
-
NASDAQ
Neurocrine Biosciences
DRUGS - Biotechnology
|
$119.03
|
-4.34
-3.52% |
$123.11
|
709,276
82.85% of 50 DAV
50 DAV is 856,100
|
$128.29
-7.22%
|
5/19/2020
|
$123.71
|
PP = $119.75
|
|
MB = $125.74
|
Most Recent Note - 6/3/2020 6:09:35 PM
Y - Pulled back today with light volume for a 3rd consecutive loss testing the prior highs in the $117-119 area. Recent quarterly comparisons through Mar '20 showed greatly improved sales revenues and earnings increases versus year ago periods (C criteria). After years of losses it reported solid annual earnings (A criteria) in FY '18 and '19.
>>> FEATURED STOCK ARTICLE : Biotech Firm Has New Parkinson's Treatment Drug Approved by FDA - 5/19/2020 |
View all notes |
Set NEW NOTE alert |
Company Profile |
SEC
News |
Chart |
Request a new note
C
A
S
I |
TREX
-
NYSE
Trex Company Inc
MATERIALS and CONSTRUCTION - General Building Materials
|
$116.83
|
-3.19
-2.66% |
$122.00
|
836,058
82.70% of 50 DAV
50 DAV is 1,011,000
|
$132.84
-12.05%
|
5/5/2020
|
$109.05
|
PP = $111.95
|
|
MB = $117.55
|
Most Recent Note - 6/3/2020 6:13:22 PM
G - Pulling back quietly after recent gains above the pivot point lacked the great volume conviction. Prior highs in the $111 area define initial support to watch. Fundamentals remain strong.
>>> FEATURED STOCK ARTICLE : Bullish Action Continues for Top Wood Alternative Firm - 5/20/2020 |
View all notes |
Set NEW NOTE alert |
Company Profile |
SEC
News |
Chart |
Request a new note
C
A
S
I |
NFLX
-
NASDAQ
Netflix Inc
SPECIALTY RETAIL - Music and Video Stores
|
$421.97
|
-5.34
-1.25% |
$427.10
|
4,308,205
49.58% of 50 DAV
50 DAV is 8,689,000
|
$458.97
-8.06%
|
5/14/2020
|
$441.95
|
PP = $449.62
|
|
MB = $472.10
|
Most Recent Note - 6/2/2020 6:36:24 PM
Y - Managed a "positive reversal" on 5/27/20 but volume totals have been very light behind recent gains. Found prompt support near its 50 DMA line ($410.72), and more damaging losses would trigger a technical sell signal. A rebound and subsequent gains above the pivot point must be backed by at least +40% above average volume to trigger a proper new (or add-on) technical buy signal. Fundamentals remain strong.
>>> FEATURED STOCK ARTICLE : Pulling Back After Brief New Base Formation - 5/21/2020 |
View all notes |
Set NEW NOTE alert |
Company Profile |
SEC
News |
Chart |
Request a new note
C
A
S
I |
Symbol/Exchange
Company Name
Industry Group |
PRICE |
CHANGE
(%Change) |
Day High |
Volume
(% DAV)
(% 50 day avg vol) |
52 Wk Hi
% From Hi |
Featured
Date |
Price
Featured |
Pivot Featured |
|
Max Buy |
NOW
-
NYSE
Servicenow Inc
Computer Sftwr-Enterprse
|
$388.09
|
-4.81
-1.22% |
$393.11
|
1,400,795
57.53% of 50 DAV
50 DAV is 2,435,000
|
$396.15
-2.03%
|
4/30/2020
|
$343.05
|
PP = $363.05
|
|
MB = $381.20
|
Most Recent Note - 6/1/2020 5:59:43 PM
G - Color code is changed to green while now trading above the "max buy" level. Suffered a small loss with very light volume today, yet still perched near its all-time high. Recent gains above the pivot point were not backed by the +40% above average volume necessary to clinch a proper technical buy signal. Prior highs in the $362 area define initial support to watch on pullbacks.
>>> FEATURED STOCK ARTICLE : Consolidating Near Prior High After Wedging Into New High Ground - 5/14/2020 |
View all notes |
Set NEW NOTE alert |
Company Profile |
SEC
News |
Chart |
Request a new note
C
A
S
I |
QLYS
-
NASDAQ
Qualys Inc
Computer Sftwr-Security
|
$114.29
|
+0.45
0.40% |
$114.78
|
303,338
54.66% of 50 DAV
50 DAV is 555,000
|
$119.20
-4.12%
|
4/9/2020
|
$100.44
|
PP = $97.22
|
|
MB = $102.08
|
Most Recent Note - 6/2/2020 6:26:42 PM
G - Pulled back today with higher (near average) volume. It is extended from the previously noted base and its 50 DMA line ($102) defines near-term support above the prior low ($98.24 on 5/04/20). Fundamentals remain strong. See the latest FSU analysis for more details and an annotated graph.
>>> FEATURED STOCK ARTICLE : Qualys is Extended From Prior Base and Perched Near All-Time High - 5/29/2020 |
View all notes |
Set NEW NOTE alert |
Company Profile |
SEC
News |
Chart |
Request a new note
C
A
S
I |
TEAM
-
NASDAQ
Atlassian Corp Plc Cl A
Comp Sftwr-Spec Enterprs
|
$183.46
|
-0.21
-0.11% |
$184.19
|
3,519,902
181.06% of 50 DAV
50 DAV is 1,944,000
|
$191.72
-4.31%
|
5/4/2020
|
$159.70
|
PP = $156.22
|
|
MB = $164.03
|
Most Recent Note - 6/2/2020 6:29:39 PM
G - Extended from any sound base, it pulled back today with lighter volume following 4 consecutive gains that helped it reach a new all-time high. Prior highs in the $156 area define initial support to watch.
>>> FEATURED STOCK ARTICLE : Pullback on Lighter Volume After Gain For New High on Big Volume - 5/18/2020 |
View all notes |
Set NEW NOTE alert |
Company Profile |
SEC
News |
Chart |
Request a new note
C
A
S
I |
TTD
-
NASDAQ
The Trade Desk Inc Cl A
Comml Svcs-Advertising
|
$354.98
|
+36.72
11.54% |
$356.24
|
3,843,992
173.62% of 50 DAV
50 DAV is 2,214,000
|
$327.35
8.44%
|
6/3/2020
|
$240.61
|
PP = $327.35
|
|
MB = $343.72
|
Most Recent Note - 6/3/2020 6:16:45 PM
Y - Finished strong after highlighted in yellow with new pivot point cited based on its 5/07/20 high in the earlier mid-day report. Hit a new all-time high with today's big gain backed by +73% above average volume, clearing the pivot point and triggering a convincing technical buy signal. Fundamentals remain strong after it reported Mar '20 quarterly earnings +84% on +33% sales revenues, and 6 of the past 7 quarterly comparisons were above the +25% minimum earnings guideline (C criteria). See the latest FSU analysis for more details and a new annotated graph.
>>> FEATURED STOCK ARTICLE : Trade Desk Posts Powerful Gain for New High - 6/3/2020 |
View all notes |
Set NEW NOTE alert |
Company Profile |
SEC
News |
Chart |
Request a new note
C
A
S
I |
PING
-
NYSE
Ping Identity Hldg Corp
Computer Sftwr-Security
|
$30.28
|
-0.33
-1.08% |
$31.00
|
1,019,974
91.40% of 50 DAV
50 DAV is 1,116,000
|
$31.50
-3.87%
|
6/1/2020
|
$29.24
|
PP = $29.90
|
|
MB = $31.40
|
Most Recent Note - 6/2/2020 12:55:03 PM
Y - Hitting new all-time highs with today's 3rd consecutive volume-driven gain. Finished strong on the prior session after highlighted in yellow with new pivot point cited based on its 2/20/20 high plus 10 cents in the earlier mid-day report (read here). The gain above the pivot point was backed by +126% above average volume triggering a technical buy signal. It posted a recent spurt of gains since completing a new Secondary Offering on 5/15/20. PING reported strong earnings results well above the +25% minimum guideline (C criteria) in the 4 latest quarterly comparisons through Mar '20 versus the year ago periods. Limited earnings history is a concern, however, leadership in the Computer Software - Security industry group (L criteria) is a reassuring sign. Completed its $15 IPO on 9/19/19. See the latest FSU analysis for more details and an annotated graph.
>>> FEATURED STOCK ARTICLE : Strong Gain for New High Backed by 127% Above Average Volume - 6/1/2020 |
View all notes |
Set NEW NOTE alert |
Company Profile |
SEC
News |
Chart |
Request a new note
C
A
S
I |
Symbol/Exchange
Company Name
Industry Group |
PRICE |
CHANGE
(%Change) |
Day High |
Volume
(% DAV)
(% 50 day avg vol) |
52 Wk Hi
% From Hi |
Featured
Date |
Price
Featured |
Pivot Featured |
|
Max Buy |
AAXN
-
NASDAQ
Axon Enterprise Inc
Security/Sfty
|
$91.18
|
-6.67
-6.82% |
$97.96
|
2,100,258
230.54% of 50 DAV
50 DAV is 911,000
|
$99.62
-8.47%
|
5/8/2020
|
$84.86
|
PP = $90.20
|
|
MB = $94.71
|
Most Recent Note - 6/3/2020 12:38:52 PM
Y - Color code is changed to yellow while pulling back below its "max buy" level. Considerable volume-driven gains above the pivot point triggered a technical buy signal but it quickly got extended more than 5% above the prior highs in the $90-91 area which define initial support to watch on pullbacks.
>>> FEATURED STOCK ARTICLE : Quietly Slumping Near 50-Day Moving Average Line - 5/28/2020 |
View all notes |
Set NEW NOTE alert |
Company Profile |
SEC
News |
Chart |
Request a new note
C
A
S
I |
GDDY
-
NYSE
Godaddy Inc Cl A
Computer Sftwr-Enterprse
|
$81.47
|
+1.15
1.43% |
$82.47
|
1,322,338
68.06% of 50 DAV
50 DAV is 1,943,000
|
$80.70
0.95%
|
6/2/2020
|
$79.62
|
PP = $82.40
|
|
MB = $86.52
|
Most Recent Note - 6/2/2020 6:20:38 PM
Y - Posted a solid gain today backed by +133% above average volume for a new 52-week high. It was highlighted in yellow with pivot point cited based on its 5/01/19 high plus 10 cents in the earlier mid-day report. Subsequent gains above the pivot point backed by at least +40% above average volume are needed to trigger a proper technical buy signal. Rebounded impressively after a deep pullback. Approaching multi-year highs where it previously met stubborn resistance in the $82-84 area. The past 3 quarterly earnings comparisons through Mar '20 versus the year ago periods were above the +25% minimum guideline (C criteria). After years of losses, since FY 17 its annual earnings growth (A criteria) has been strong. See the latest FSU analysis for more details and a new annotated graph.
>>> FEATURED STOCK ARTICLE : Godaddy Could Be Ready to Go for New Highs - 6/2/2020 |
View all notes |
Set NEW NOTE alert |
Company Profile |
SEC
News |
Chart |
Request a new note
C
A
S
I |
|
|
|
THESE ARE NOT BUY RECOMMENDATIONS!
Comments contained in the body of this report are technical
opinions only. The material herein has been obtained
from sources believed to be reliable and accurate, however,
its accuracy and completeness cannot be guaranteed.
This site is not an investment advisor, hence it does
not endorse or recommend any securities or other investments.
Any recommendation contained in this report may not
be suitable for all investors and it is not to be deemed
an offer or solicitation on our part with respect to
the purchase or sale of any securities. All trademarks,
service marks and trade names appearing in this report
are the property of their respective owners, and are
likewise used for identification purposes only.
This report is a service available
only to active Paid Premium Members.
You may opt-out of receiving report notifications
at any time. Questions or comments may be submitted
by writing to Premium Membership Services 665 S.E. 10 Street, Suite 201 Deerfield Beach, FL 33441-5634 or by calling 1-800-965-8307
or 954-785-1121.
|
|
|