You are not logged in.
This means you
CAN ONLY VIEW reports that were published prior to Sunday, February 25, 2024.
You
MUST UPGRADE YOUR MEMBERSHIP if you want to see any current reports.
AFTER MARKET UPDATE - THURSDAY, JUNE 2ND, 2022
Previous After Market Report Next After Market Report >>>
|
|
|
|
DOW |
+435.05 |
33,248.28 |
+1.33% |
|
Volume |
908,156,411 |
-9% |
|
Volume |
4,398,043,600 |
-6% |
|
NASDAQ |
+322.44 |
12,316.90 |
+2.69% |
|
Advancers |
2,360 |
75% |
|
Advancers |
3,218 |
73% |
|
S&P 500 |
+75.58 |
4,176.81 |
+1.84% |
|
Decliners |
774 |
25% |
|
Decliners |
1,191 |
27% |
|
Russell 2000 |
+42.85 |
1,897.67 |
+2.31% |
|
52 Wk Highs |
64 |
|
|
52 Wk Highs |
33 |
|
|
S&P 600 |
+23.47 |
1,254.98 |
+1.91% |
|
52 Wk Lows |
38 |
|
|
52 Wk Lows |
143 |
|
|
Lower volume on the NYSE and Nasdaq exchange suggested that the latest solid gains for the major indices were not the result of increasing institutional buying demand. The market remains in a correction (M criteria) as arguably the rally still needs a solid confirmation. An opportunity for a valid follow-through day remains open unless the recent lows or May 20th lows are violated.
|
 |
Major Indices Rose With Lighter Volume Totals Yet Again
Kenneth J. Gruneisen - Passed the CAN SLIM® Master's Exam
The Dow jumped 435 points, while the S&P 500 climbed 1.8%. The Nasdaq Composite rallied 2.7%. Volume totals reported were lighter than the prior session on the NYSE and on the Nasdaq exchange, indicative of lackluster institutional buying demand. Breadth was positive as advancers led decliners by more than a 3-1 margin on the NYSE and almost 3-1 on the Nasdaq exchange. There were 32 high-ranked companies from the Leaders List that hit new 52-week highs and were listed on the BreakOuts Page, versus the total of 39 on the prior session. New 52-week highs outnumbered new 52-week lows on the NYSE while new lows still outnumbered new 52-week highs on the Nasdaq exchange. The major indices have been in a noted market correction (M criteria). Sources at the newspaper, following last Thursday's session, relabeled it a "confirmed uptrend" despite flaws noted in our ongoing market commentaries. Followers of the fact-based investment system know to watch for a follow-through day backed by higher volume which could signal a new confirmed uptrend.
Chart courtesy of www.stockcharts.com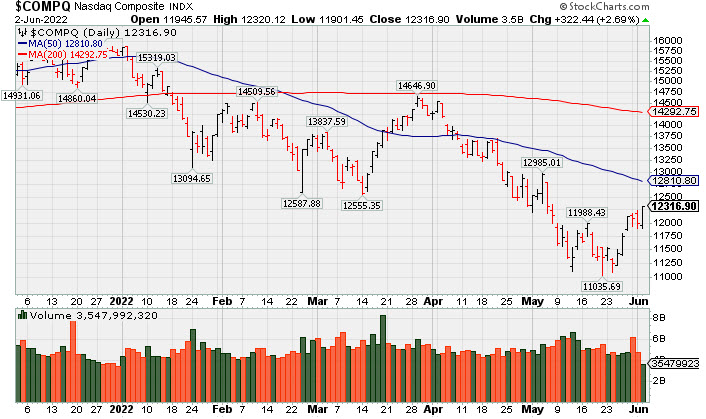 PICTURED: The Nasdaq Composite Index posted a gain with lighter volume after 2 losses marked by higher volume. The 3 major indexes cannot be said to be in "healthy" technical shape while all of them are sputtering well below both their 50-day and 200-day moving average (DMA) lines.
Lower volume on the NYSE on prior sessions suggested that both Thursday and Friday's solid gains for the Dow Jones Industrial Average and the S&P 500 Index were not the result of truly increasing institutional buying demand. Arguably, the rally still needs confirmation, and an opportunity for a valid follow-through day remains open unless the recent lows or May 20th lows are violated.
U.S. stocks advanced on Thursday for the first time in three days as investors overlooked a multitude of potential market headwinds. All three major averages are heading for a second straight weekly advance.
Comments from Federal Reserve (Fed) Vice Chair Brainard garnered attention, after she downplayed a possible pause of rate hikes in September. Meanwhile, a disappointing report from ADP (Automatic Data Processing) showed private payrolls increased by 128,000 in May, the smallest margin since April 2020 and well below estimates of a 300,000 gain. Notably the gains during the prior two months were also downwardly revised. Separately, initial jobless claims came in at 200,000 in the latest week. Treasuries were little changed ahead of tomorrow’s more comprehensive “first Friday” jobs report. The 10-year note yield eased one basis point (0.01%) to 2.91%, though remains up 0.17% this week.
In corporate news, Microsoft Corp. (MSFT +0.79%) recouped earlier losses despite downwardly revising its current quarter guidance, flagging a stronger dollar as a headwind. Elsewhere, Chewy Inc. (CHWY +24.22%) rose after topping earnings and revenue projections. Meanwhile, Hewlett Packard Enterprise Co. (HPE -5.20%) fell after the company lowered its full-year profit expectations amid supply chain disruptions.
In commodities, West Texas Intermediate crude rose 1.7% to $117.23/barrel as the U.S. dollar slid 0.7% against a basket of its peers. Meanwhile, the Organization of Petroleum Exporting Counties and its allies (OPEC+) agreed to increase output by 650,000 barrels per day (bpd) in July and August to offset a reduction in Russian production.
|
 Kenneth J. Gruneisen started out as a licensed stockbroker in August 1987, a couple of months prior to the historic stock market crash that took the Dow Jones Industrial Average down -22.6% in a single day. He has published daily fact-based fundamental and technical analysis on high-ranked stocks online for two decades. Through FACTBASEDINVESTING.COM, Kenneth provides educational articles, news, market commentary, and other information regarding proven investment systems that work in good times and bad.
Comments contained in the body of this report are technical opinions only and are not necessarily those of Gruneisen Growth Corp. The material herein has been obtained from sources believed to be reliable and accurate, however, its accuracy and completeness cannot be guaranteed. Our firm, employees, and customers may effect transactions, including transactions contrary to any recommendation herein, or have positions in the securities mentioned herein or options with respect thereto. Any recommendation contained in this report may not be suitable for all investors and it is not to be deemed an offer or solicitation on our part with respect to the purchase or sale of any securities. |
|
 |
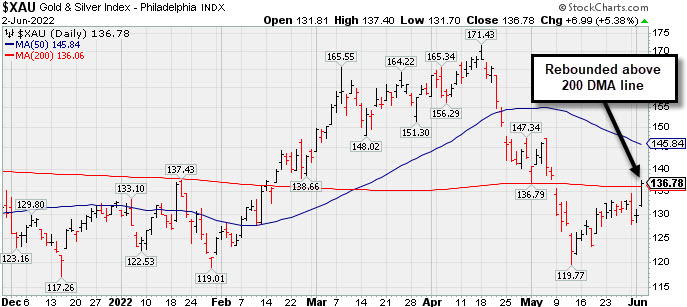
Gold & Silver, Financial, Retail, and Tech Indexes Rose
Kenneth J. Gruneisen - Passed the CAN SLIM® Master's Exam
The Retail Index ($RLX +2.72%), Broker/Dealer Index ($XBD +2.55%), and Bank Index ($BKX +1.52%) posted influential gains. The tech sector had a positive bias as the Semiconductor Index ($SOX +3.57%) and Networking Index ($NWX +2.71%) both outpaced the Biotech Index ($BTK +1.14%). Energy-linked groups edged lower as the Oil Services Index ($OSX -0.76%) outpaced the Integrated Oil Index ($XOI -0.14%) to the downside.
PICTURED: The Gold & Silver Index ($XAU +5.38%) posted a standout gain as it rebounded above its 200-day moving average line.
| Oil Services |
$OSX |
82.92 |
-0.64 |
-0.76% |
+57.28% |
| Integrated Oil |
$XOI |
1,817.29 |
-2.61 |
-0.14% |
+54.24% |
| Semiconductor |
$SOX |
3,157.98 |
+108.96 |
+3.57% |
-19.97% |
| Networking |
$NWX |
769.14 |
+20.33 |
+2.71% |
-20.80% |
| Broker/Dealer |
$XBD |
423.23 |
+10.52 |
+2.55% |
-13.07% |
| Retail |
$RLX |
3,235.08 |
+85.68 |
+2.72% |
-23.46% |
| Gold & Silver |
$XAU |
136.78 |
+6.99 |
+5.38% |
+3.27% |
| Bank |
$BKX |
115.97 |
+1.73 |
+1.52% |
-12.29% |
| Biotech |
$BTK |
4,605.12 |
+51.97 |
+1.14% |
-16.55% |
|
|
|
 |
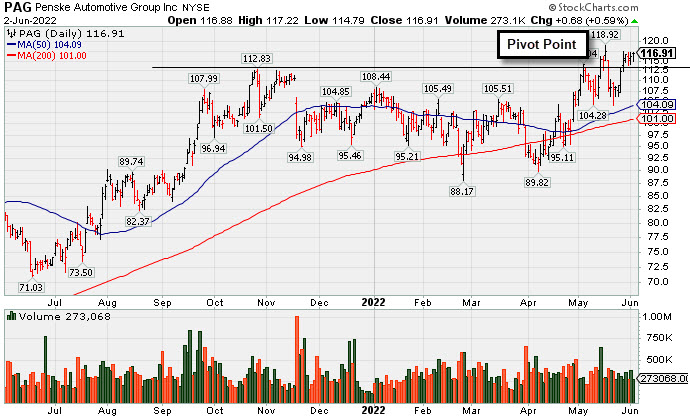
Penske Perched at High With No Resistance Remaining
Kenneth J. Gruneisen - Passed the CAN SLIM® Master's Exam
Penske Automotive Grp (PAG +$0.68 or +0.59% to $116.91) posted a 2nd consecutive small gain today with below average volume. There is no resistance remaining due to overhead supply. Its 50-day moving average (DMA) line ($104.47) defines important near term support to watch. Subsequent gains for new highs backed by at least +40% above average volume would be a reassuring sign of fresh institutional buying demand which could lead to a meaningful price advance.
PAG was highlighted in yellow in the 5/13/22 mid-day report (read here) with pivot point cited based on its 5/04/22 high after a 6-month saucer-with-handle base. It was shown in greater detail that evening with an annotated graph under the headline, "Breakout With Volume-Driven Gain to New High". It rebounded back above the previously cited pivot point following a recent pullback.
PAG reported earnings +113% on +21% sales revenues for the Mar '22 quarter versus the year ago period. Recent quarterly earnings were well above the +25% minimum guideline (C criteria). Annual earnings (A criteria) history has been strong. It has an Earnings Per Share Rating of 97, well above the 80+ minimum for buy candidates.
There are 27.6 million shares in the public float (S criteria) which can contribute to greater price volatility in the event of institutional buying or selling. The number of top-rated funds owning its shares rose from 420 in Jun '21 to 500 in Mar '22, a reassuring sign concerning the I criteria. Its current Up/Down Volume Ratio of 1.2 is an unbiased indication it has been under accumulation over the past 50 days. The Retail/Wholesale-Automobile group is currently ranked 94th of the 197 Industry Groups, however several other high-ranked stocks in the group have been showing confirming strength and leadership (L criteria). |
|
|
Color Codes Explained :
Y - Better candidates highlighted by our
staff of experts.
G - Previously featured
in past reports as yellow but may no longer be buyable under the
guidelines.
***Last / Change / Volume data in this table is the closing quote data***
Symbol/Exchange
Company Name
Industry Group |
PRICE |
CHANGE
(%Change) |
Day High |
Volume
(% DAV)
(% 50 day avg vol) |
52 Wk Hi
% From Hi |
Featured
Date |
Price
Featured |
Pivot Featured |
|
Max Buy |
 CI
-
NYSE
CI
-
NYSE
Cigna Corp
Medical-Managed Care
|
$263.43
|
-1.15
-0.43% |
$265.21
|
1,654,235
110.58% of 50 DAV
50 DAV is 1,496,000
|
$273.58
-3.71%
|
5/6/2022
|
$263.52
|
PP = $269.97
|
|
MB = $283.47
|
 Most Recent Note - 6/2/2022 5:59:46 PM
Y - Pulled back for a 3rd consecutive loss today following a "negative reversal" after touching a new all-time high. Its 50 DMA line ($256) defines near-term support to watch. Subsequent gains above the pivot point backed by at least +40% above average volume may trigger a technical buy signal. Fundamentals remain strong.
>>> FEATURED STOCK ARTICLE : Consolidating Above 50-Day Moving Average Near All-Time High - 5/25/2022 |
View all notes |
Set NEW NOTE alert |
Company Profile |
SEC
News |
Chart |
Request a new note
C
A
S
I |
PAG
-
NYSE
Penske Automotive Grp
Retail/Whlsle-Automobile
|
$116.91
|
+0.68
0.59% |
$117.23
|
273,064
79.15% of 50 DAV
50 DAV is 345,000
|
$119.47
-2.14%
|
5/13/2022
|
$114.88
|
PP = $114.57
|
|
MB = $120.30
|
Most Recent Note - 6/2/2022 5:57:17 PM
Y - Posted a 2nd consecutive small gain today with lighter volume. No overhead supply remains to act as resistance. Rebounded back above the previously cited pivot point following a recent pullback. Its 50 DMA line ($104.47) defines important near term support to watch. See the latest FSU analysis for more details and a new annotated graph.
>>> FEATURED STOCK ARTICLE : Penske Perched at High With No Resistance Remaining - 6/2/2022 |
View all notes |
Set NEW NOTE alert |
Company Profile |
SEC
News |
Chart |
Request a new note
C
A
S
I |
LLY
-
NYSE
Eli Lilly & Co
Medical-Diversified
|
$302.43
|
-8.65
-2.78% |
$310.67
|
3,691,371
123.95% of 50 DAV
50 DAV is 2,978,000
|
$324.08
-6.68%
|
5/16/2022
|
$302.46
|
PP = $314.10
|
|
MB = $329.81
|
Most Recent Note - 6/2/2022 6:00:25 PM
Y - Pulled back with above average volume today for a 3rd consecutive loss. Its 50 DMA line ($296) recently acted as support. Pivot point cited was based on its 4/07/22 high plus 10 cents. Subsequent gains above the pivot point backed by at least +40% above average volume may trigger a convincing technical buy signal. Fundamentals remain strong.
>>> FEATURED STOCK ARTICLE : Eli Lilly & Co Challenges All-Time High - 5/16/2022 |
View all notes |
Set NEW NOTE alert |
Company Profile |
SEC
News |
Chart |
Request a new note
C
A
S
I |
WCC
-
NYSE
Wesco International Inc
WHOLESALE - Electronics Wholesale
|
$136.46
|
+4.17
3.15% |
$136.63
|
467,741
99.10% of 50 DAV
50 DAV is 472,000
|
$144.43
-5.52%
|
6/1/2022
|
$128.79
|
PP = $139.10
|
|
MB = $146.06
|
Most Recent Note - 6/2/2022 5:58:45 PM
Y - Posted a 2nd consecutive gain today with near average volume. Highlighted again in yellow in the 6/01/22 mid-day report after rebounding above its 50 and 200 DMA lines. The gain backed by great volume helped its outlook improve. Subsequent gains for a new high close backed by at least +40% above average volume may indicate fresh institutional buying demand. Fundamentals remain strong after it reported Mar '22 quarterly earnings +154% on +22% sales revenues versus the year ago period. See the latest FSU analysis for more details and an annotated graph.
>>> FEATURED STOCK ARTICLE : Big Volume-Driven Gain Helped Technical Stance Improve - 6/1/2022 |
View all notes |
Set NEW NOTE alert |
Company Profile |
SEC
News |
Chart |
Request a new note
C
A
S
I |
|
|
|
THESE ARE NOT BUY RECOMMENDATIONS!
Comments contained in the body of this report are technical
opinions only. The material herein has been obtained
from sources believed to be reliable and accurate, however,
its accuracy and completeness cannot be guaranteed.
This site is not an investment advisor, hence it does
not endorse or recommend any securities or other investments.
Any recommendation contained in this report may not
be suitable for all investors and it is not to be deemed
an offer or solicitation on our part with respect to
the purchase or sale of any securities. All trademarks,
service marks and trade names appearing in this report
are the property of their respective owners, and are
likewise used for identification purposes only.
This report is a service available
only to active Paid Premium Members.
You may opt-out of receiving report notifications
at any time. Questions or comments may be submitted
by writing to Premium Membership Services 665 S.E. 10 Street, Suite 201 Deerfield Beach, FL 33441-5634 or by calling 1-800-965-8307
or 954-785-1121.
|
|
|