You are not logged in.
This means you
CAN ONLY VIEW reports that were published prior to Tuesday, February 20, 2024.
You
MUST UPGRADE YOUR MEMBERSHIP if you want to see any current reports.
AFTER MARKET UPDATE - WEDNESDAY, MAY 29TH, 2019
Previous After Market Report Next After Market Report >>>
|
|
|
|
DOW |
-221.36 |
25,126.41 |
-0.87% |
|
Volume |
823,643,710 |
-43% |
|
Volume |
2,259,485,500 |
-3% |
|
NASDAQ |
-60.04 |
7,547.31 |
-0.79% |
|
Advancers |
948 |
34% |
|
Advancers |
963 |
32% |
|
S&P 500 |
-19.37 |
2,783.02 |
-0.69% |
|
Decliners |
1,874 |
66% |
|
Decliners |
2,057 |
68% |
|
Russell 2000 |
-14.07 |
1,489.95 |
-0.94% |
|
52 Wk Highs |
71 |
|
|
52 Wk Highs |
60 |
|
|
S&P 600 |
-7.70 |
904.09 |
-0.84% |
|
52 Wk Lows |
211 |
|
|
52 Wk Lows |
219 |
|
|
 |
Major Indices Fall Again as Market Correction Deepens
Kenneth J. Gruneisen - Passed the CAN SLIM® Master's Exam
U.S. equities pared steep early session losses, but remained near 12-week lows Wednesday amid lingering trade tensions. The Dow slid more than 400 points before ultimately finishing the session down 221 points. The S&P 500 fell 0.7%, dipping below its 100-day moving average, while the Nasdaq Composite declined 0.8%. The volume totals reported were lighter on the NYSE and on the Nasdaq exchange, revealing less conviction behind institutional selling. Breadth was negative as decliners led advancers by a 2-1 margin on the NYSE and on the Nasdaq exchange. Leadership thinned as only 5 high-ranked companies from the Leaders List hit new 52-week highs and were listed on the BreakOuts Page, versus the total of 30 on the prior session. New 52-week lows totals swelled and outnumbered shrinking new 52-week highs totals on the NYSE and on the Nasdaq exchange. The major indices (M criteria) are showing action indicative of a more worrisome "market correction". The fact-based investment system discourages any new buying efforts and suggests selling stocks on a case-by-case basis, raising cash levels to reduce market exposure. The Featured Stocks Page provides the most timely analysis on high-ranked leaders. Charts used courtesy of www.stockcharts.com
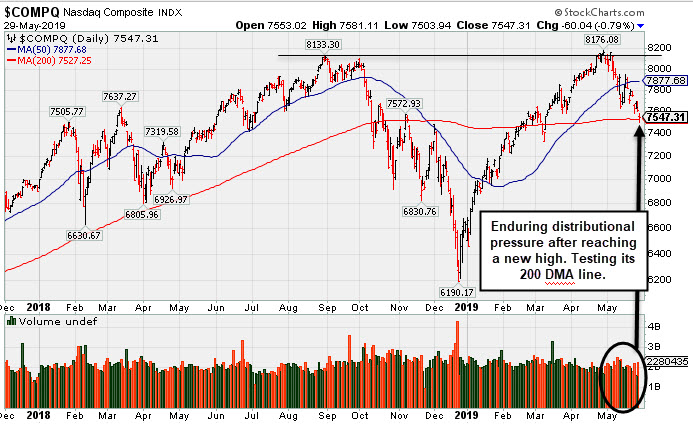
PICTURED: The Nasdaq Composite Index slumped below prior lows and tested its 200-day moving average (DMA) line. Losses on higher volume in recent weeks indicate distributional pressure after it had rebounded to reach a new high.
The S&P 500 Index also tested its 200 DMA line, meanwhile, the Dow Jones Industrial Average slumped well below its 200 DMA line. Disciplined investors have been watching for a follow-through day of big gains (more than +1%) from at least one of the major indices backed with higher volume and an expansion in stocks reaching new 52-week highs - all of which are critical components for a new confirmed uptrend under the fact-based system.
The major averages continued to experience weakness after President Trump commented Monday that the U.S. was “not ready” to finalize a trade pact with China. Meanwhile, Beijing warned they could restrict exports of rare-earth metals used in many technology products. The trade rhetoric has inspired a perceived “risk off” tone with Treasuries extending their recent rally. The yield on the 10-year note fell below 2.21% before rebounding to 2.26%. The benchmark yield, however, remains at the lowest level since September 2017. Meanwhile, the yield curve between the 10-year note and three-month T-bill remains inverted, with the gap deepening to the most negative since 2007 earlier in the session.
All 11 S&P 500 sectors finished lower with Utilities falling the most. In earnings, Workday (WDAY -4.53%) fell after topping subscription revenue and profit expectations, but offering mixed forward guidance. Dicks Sporting Goods (DKS -5.90%) fell despite beating analyst revenue and profit estimates.
In commodities, WTI crude lost 0.4% as global growth worries and a sharp uptick in U.S. crude stockpiles pressured prices. COMEX gold gained 0.2% despite a stronger dollar.
|
 Kenneth J. Gruneisen started out as a licensed stockbroker in August 1987, a couple of months prior to the historic stock market crash that took the Dow Jones Industrial Average down -22.6% in a single day. He has published daily fact-based fundamental and technical analysis on high-ranked stocks online for two decades. Through FACTBASEDINVESTING.COM, Kenneth provides educational articles, news, market commentary, and other information regarding proven investment systems that work in good times and bad.
Comments contained in the body of this report are technical opinions only and are not necessarily those of Gruneisen Growth Corp. The material herein has been obtained from sources believed to be reliable and accurate, however, its accuracy and completeness cannot be guaranteed. Our firm, employees, and customers may effect transactions, including transactions contrary to any recommendation herein, or have positions in the securities mentioned herein or options with respect thereto. Any recommendation contained in this report may not be suitable for all investors and it is not to be deemed an offer or solicitation on our part with respect to the purchase or sale of any securities. |
|
 |
Retail and Biotech Indexes Led Group Decliners
Kenneth J. Gruneisen - Passed the CAN SLIM® Master's Exam
The Retail Index ($RLX -0.81%) slumped while the Broker/Dealer Index ($XBD -0.10%) and Bank Index ($BKX +0.10%) ended mixed and little changed. The tech sector was mixed as the Semiconductor Index ($SOX +0.41%) rose, but the Networking Index ($NWX -0.52%) and the Biotech Index ($BTK -1.53%) suffered losses. The Gold & Silver Index ($XAU +0.23%) and the Oil Services Index ($OSX +0.39%) rose while the Integrated Oil Index ($XOI -0.39%) lost ground. Charts courtesy of www.stockcharts.com
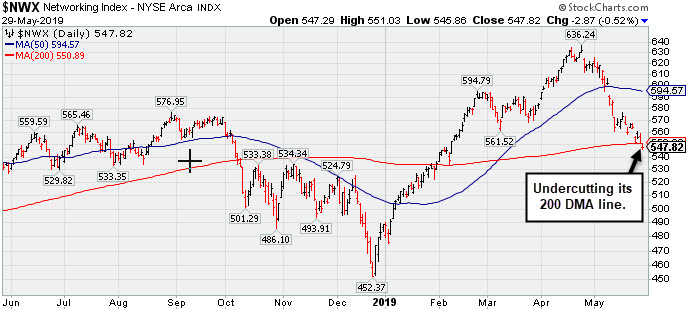 PICTURED: The Networking Index ($NWX -0.52%) undercut its 200-day moving average (DMA) line.
| Oil Services |
$OSX |
76.89 |
+0.30 |
+0.39% |
-4.60% |
| Integrated Oil |
$XOI |
1,207.07 |
-4.68 |
-0.39% |
+4.14% |
| Semiconductor |
$SOX |
1,305.57 |
+5.27 |
+0.41% |
+13.02% |
| Networking |
$NWX |
547.82 |
-2.87 |
-0.52% |
+12.10% |
| Broker/Dealer |
$XBD |
258.23 |
-0.25 |
-0.10% |
+8.80% |
| Retail |
$RLX |
2,221.81 |
-18.09 |
-0.81% |
+13.86% |
| Gold & Silver |
$XAU |
66.40 |
+0.16 |
+0.24% |
-6.03% |
| Bank |
$BKX |
94.58 |
+0.11 |
+0.12% |
+10.25% |
| Biotech |
$BTK |
4,398.05 |
-68.15 |
-1.53% |
+4.20% |
|
|
|
 |
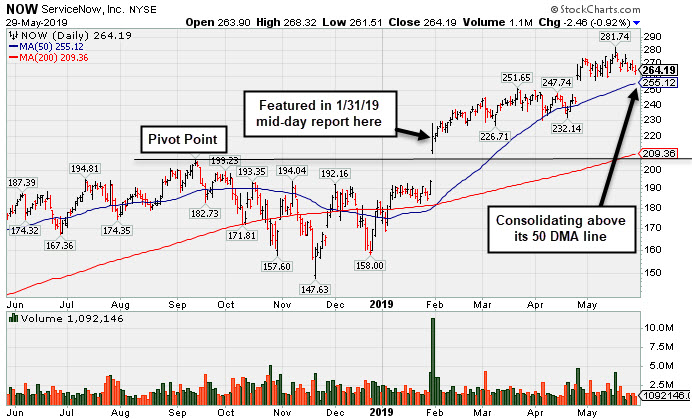
Leader Consolidating Above 50-Day Moving Average Line
Kenneth J. Gruneisen - Passed the CAN SLIM® Master's Exam
ServiceNow Inc (NOW -$2.46 or -0.92% to $264.19) is consolidating near its all-time high. It remains perched well above its 50-day moving average (DMA) line ($255.12) and prior high ($251.65 on 3/21/19) which define important near-term support to watch on pullbacks. More damaging losses would raise concerns and trigger technical sell signals. Recently it reported earnings +20% on +34% sales revenues for the Mar '19 quarter, below the +25% minimum earnings guideline (C criteria), raising fundamental concerns.
NOW was last shown in this FSU section on 4/15/19 with an annotated graph under the headline, "Found Recent Support at 50-Day Moving Average". It was highlighted in yellow with pivot point cited based on its 9/13/18 high plus 10 cents when highlighted in the 1/31/19 mid-day report (read here) as it triggered a technical buy signal with a big "breakaway gap". Bullish action came after it reported earnings +79% on +30% sales revenues for the Dec '18 quarter. Prior quarterly comparisons were above the +25% minimum earnings guideline (C criteria).
Annual earnings (A criteria) growth has been strong since FY '15. It has an Earnings Per Share Rating of 97. The Computer Software - Enterprise group has a Group Relative Strength Rating of 99, a reassuring sign concerning the L criteria.
The number of top-rated funds owning its shares rose from 1,030 in Jun '17 to 1,563 in Mar '19, a reassuring sign concerning the I criteria. It has a Timeliness Rating of A and a Sponsorship Rating of B.
|
|
|
Color Codes Explained :
Y - Better candidates highlighted by our
staff of experts.
G - Previously featured
in past reports as yellow but may no longer be buyable under the
guidelines.
***Last / Change / Volume data in this table is the closing quote data***
Symbol/Exchange
Company Name
Industry Group |
PRICE |
CHANGE
(%Change) |
Day High |
Volume
(% DAV)
(% 50 day avg vol) |
52 Wk Hi
% From Hi |
Featured
Date |
Price
Featured |
Pivot Featured |
|
Max Buy |
SPSC
-
NASDAQ
S P S Commerce Inc
COMPUTER SOFTWARE and SERVICES - Application Software
|
$101.89
|
-0.04
-0.04% |
$102.35
|
161,719
106.39% of 50 DAV
50 DAV is 152,000
|
$115.00
-11.40%
|
3/26/2019
|
$107.12
|
PP = $113.41
|
|
MB = $119.08
|
 Most Recent Note - 5/29/2019 1:18:53 PM
G - Met resistance while sputtering below its 50 DMA line ($104.40) and it faces resistance due to overhead supply up to the $115 level. Recent low ($98.59 on 4/18/19) defines important near-term support to watch. Fundamentals remain strong.
>>> FEATURED STOCK ARTICLE : Sputtering Near 50-Day Average Line Building Base-On-Base - 5/1/2019 |
View all notes |
Set NEW NOTE alert |
Company Profile |
SEC
News |
Chart |
Request a new note
C
A
S
I |
EPAM
-
NYSE
Epam Systems Inc
COMPUTER SOFTWARE and SERVICES - Information Technology Service
|
$166.77
|
-0.18
-0.11% |
$167.72
|
801,266
183.36% of 50 DAV
50 DAV is 437,000
|
$180.55
-7.63%
|
5/9/2019
|
$169.25
|
PP = $180.55
|
|
MB = $189.58
|
Most Recent Note - 5/29/2019 1:01:03 PM
G - Met resistance near its 50 DMA line ($171) while sputtering in recent weeks, and a rebound above that important short-term average is needed for its outlook to improve. Reported earnings +34% on +23% sales revenues for the Mar '19 quarter, continuing its strong earnings track record.
>>> FEATURED STOCK ARTICLE : Found Support and Closed in Upper Third of Day's Range - 5/9/2019 |
View all notes |
Set NEW NOTE alert |
Company Profile |
SEC
News |
Chart |
Request a new note
C
A
S
I |
ENV
-
NYSE
Envestnet Inc
FINANCIAL SERVICES - Diversified Investments
|
$68.28
|
-0.58
-0.84% |
$68.69
|
170,045
58.43% of 50 DAV
50 DAV is 291,000
|
$72.67
-6.04%
|
3/15/2019
|
$66.05
|
PP = $64.90
|
|
MB = $68.15
|
Most Recent Note - 5/28/2019 8:21:33 PM
G - Consolidating above its 50 DMA line ($68.07). Weak action came after recently reporting earnings +5% on +1% sales revenues for the Mar '19 quarter, below the +25% minimum earnings guideline (C criteria). The prior high ($64.80 on 9/14/18) defines important near-term support to watch.
>>> FEATURED STOCK ARTICLE : Negative Reversal After Another New High - 4/24/2019 |
View all notes |
Set NEW NOTE alert |
Company Profile |
SEC
News |
Chart |
Request a new note
C
A
S
I |
TPL
-
NYSE
Texas Pacific Land Trust
Real Estate Dvlpmt/Ops
|
$809.93
|
+8.14
1.01% |
$822.00
|
9,217
60.64% of 50 DAV
50 DAV is 15,200
|
$915.66
-11.55%
|
5/15/2019
|
$850.01
|
PP = $915.76
|
|
MB = $961.55
|
Most Recent Note - 5/23/2019 12:57:01 PM
G - Color code is changed to green while slumping below its 50 DMA line ($817) with today's loss raising concerns. A prompt rebound is needed for its outlook to improve. Subsequent gains above the pivot point backed by at least +40% above average volume may trigger a technical buy signal. Keep in mind that the major averages (M criteria) need a follow-through day to confirm a new uptrend before any new buying efforts are justified under the fact-based investment system. Reported earnings +222% on +219% sales revenues for the Mar '19 quarter continuing its strong earnings track record.
>>> FEATURED STOCK ARTICLE : Recently Found Support and Rose Toward All-Time High - 5/17/2019 |
View all notes |
Set NEW NOTE alert |
Company Profile |
SEC
News |
Chart |
Request a new note
C
A
S
I |
LHCG
-
NASDAQ
L H C Group Inc
HEALTH SERVICES - Home Health Care
|
$112.55
|
-1.85
-1.62% |
$114.16
|
115,367
44.54% of 50 DAV
50 DAV is 259,000
|
$122.20
-7.90%
|
4/29/2019
|
$110.94
|
PP = $115.64
|
|
MB = $121.42
|
Most Recent Note - 5/23/2019 4:39:43 PM
Y - Slumped back below its "max buy" level and undercut its pivot point with a loss today on higher volume and its color code is changed to yellow. Its 50 DMA line ($111) defines near-term support Fundamentals remain strong.
>>> FEATURED STOCK ARTICLE : Long-Term Care Firm Hovering Near All-Time High - 5/14/2019 |
View all notes |
Set NEW NOTE alert |
Company Profile |
SEC
News |
Chart |
Request a new note
C
A
S
I |
Symbol/Exchange
Company Name
Industry Group |
PRICE |
CHANGE
(%Change) |
Day High |
Volume
(% DAV)
(% 50 day avg vol) |
52 Wk Hi
% From Hi |
Featured
Date |
Price
Featured |
Pivot Featured |
|
Max Buy |
ENSG
-
NASDAQ
Ensign Group Inc
HEALTH SERVICES - Long-Term Care Facilities
|
$53.35
|
-1.76
-3.19% |
$54.66
|
281,113
94.65% of 50 DAV
50 DAV is 297,000
|
$58.14
-8.24%
|
4/30/2019
|
$51.46
|
PP = $53.30
|
|
MB = $55.97
|
Most Recent Note - 5/24/2019 5:44:01 PM
Y - Posted a big gain today with below average volume. Showing resilience in recent weeks after it reported earnings +22% on +12% sales revenues for the Mar '19 quarter, below the +25% minimum earnings guideline (C criteria), raising fundamental concerns.
>>> FEATURED STOCK ARTICLE : Two Damaging Losses Hurt Outlook - 4/17/2019 |
View all notes |
Set NEW NOTE alert |
Company Profile |
SEC
News |
Chart |
Request a new note
C
A
S
I |
LULU
-
NASDAQ
Lululemon Athletica
MANUFACTURING - Textile Manufacturing
|
$161.59
|
-11.96
-6.89% |
$172.80
|
4,834,917
219.07% of 50 DAV
50 DAV is 2,207,000
|
$179.50
-9.98%
|
3/28/2019
|
$169.20
|
PP = $164.89
|
|
MB = $173.13
|
Most Recent Note - 5/29/2019 1:18:13 PM
G - Color code is changed to green after violating its 50 DMA line ($168.48) and prior highs in the $164 area with today's big volume-driven loss triggering technical sell signals. Due to report Apr '19 quarterly earnings news after the close on Wednesday, June 12th
>>> FEATURED STOCK ARTICLE : Volume Light While Hovering Near High - 5/10/2019 |
View all notes |
Set NEW NOTE alert |
Company Profile |
SEC
News |
Chart |
Request a new note
C
A
S
I |
ULTA
-
NASDAQ
Ulta Beauty Inc
SPECIALTY RETAIL - Specialty Retail, Other
|
$322.07
|
-12.78
-3.82% |
$334.59
|
1,028,654
151.50% of 50 DAV
50 DAV is 679,000
|
$359.69
-10.46%
|
3/15/2019
|
$341.27
|
PP = $322.59
|
|
MB = $338.72
|
Most Recent Note - 5/29/2019 5:29:52 PM
G - Due to report earnings news after the close on Thursday, 5/30/19. Volume and volatility often increase near earnings news. Slumped further below its 50 DMA line ($345) and violated the prior low ($325.62 on 5/14/19) with another volume-driven loss today hurting its outlook. A rebound above the 50 DMA line is needed for its outlook to improve. Faces resistance due to overhead supply up to the $359 level.
>>> FEATURED STOCK ARTICLE : Volume Totals Cooling in Recent Weeks While Hovering Near High - 4/26/2019 |
View all notes |
Set NEW NOTE alert |
Company Profile |
SEC
News |
Chart |
Request a new note
C
A
S
I |
ESNT
-
NYSE
Essent Group Ltd
Finance-MrtgandRel Svc
|
$48.18
|
+0.08
0.17% |
$48.18
|
491,992
76.16% of 50 DAV
50 DAV is 646,000
|
$48.88
-1.43%
|
3/18/2019
|
$45.84
|
PP = $45.06
|
|
MB = $47.31
|
Most Recent Note - 5/28/2019 8:22:43 PM
Y - Still perched near its 52-week high. Recently reported earnings +15% on +20% sales revenues for the Mar '19 quarter, below the +25% minimum earnings guideline (C criteria), raising fundamental concerns. Its 50 DMA line ($46.16) defines near term support to watch. Faces very little resistance due to overhead supply up to the $50 level.
>>> FEATURED STOCK ARTICLE : Perched Above Pivot Point With Earnings News Due May 3rd - 4/25/2019 |
View all notes |
Set NEW NOTE alert |
Company Profile |
SEC
News |
Chart |
Request a new note
C
A
S
I |
FIVE
-
NASDAQ
Five Below Inc
Retail-DiscountandVariety
|
$125.80
|
-5.66
-4.31% |
$130.93
|
946,838
82.05% of 50 DAV
50 DAV is 1,154,000
|
$148.22
-15.13%
|
4/11/2019
|
$132.05
|
PP = $133.75
|
|
MB = $140.44
|
Most Recent Note - 5/29/2019 5:22:23 PM
G - Color code is changed to green after slumping below its 50 DMA line ($131.62) again with today's big loss. Recent low ($123.64 on 5/20/19) defines the next important near-term support above its 200 DMA line.
>>> FEATURED STOCK ARTICLE : Rallied But Slumped Back Near 50-Day Moving Average - 5/28/2019 |
View all notes |
Set NEW NOTE alert |
Company Profile |
SEC
News |
Chart |
Request a new note
C
A
S
I |
Symbol/Exchange
Company Name
Industry Group |
PRICE |
CHANGE
(%Change) |
Day High |
Volume
(% DAV)
(% 50 day avg vol) |
52 Wk Hi
% From Hi |
Featured
Date |
Price
Featured |
Pivot Featured |
|
Max Buy |
NOW
-
NYSE
Servicenow Inc
Computer Sftwr-Enterprse
|
$264.19
|
-2.46
-0.92% |
$268.32
|
1,092,146
60.88% of 50 DAV
50 DAV is 1,794,000
|
$281.74
-6.23%
|
4/22/2019
|
$242.64
|
PP = $251.75
|
|
MB = $264.34
|
Most Recent Note - 5/29/2019 5:30:52 PM
G - The 50 DMA line ($255) and prior high ($251.65 on 3/21/19) define important near-term support to watch while consolidating near its all-time high. Recently reported earnings +20% on +34% sales revenues for the Mar '19 quarter, below the +25% minimum earnings guideline (C criteria), raising concerns, fundamentally. See the latest FSU analysis for more details and a new annotated graph.
>>> FEATURED STOCK ARTICLE : Leader Consolidating Above 50-Day Moving Average Line - 5/29/2019 |
View all notes |
Set NEW NOTE alert |
Company Profile |
SEC
News |
Chart |
Request a new note
C
A
S
I |
QLYS
-
NASDAQ
Qualys Inc
Computer Sftwr-Security
|
$89.21
|
-2.51
-2.74% |
$91.31
|
234,911
72.73% of 50 DAV
50 DAV is 323,000
|
$98.30
-9.25%
|
5/23/2019
|
$90.43
|
PP = $98.40
|
|
MB = $103.32
|
Most Recent Note - 5/24/2019 4:15:23 PM
Y - Color code was changed to yellow while subsequent volume-driven gains above the pivot point are needed to trigger a technical buy signal. Its Relative Strength Rating has improved to 88, above the 80+ minimum guideline for buy candidates. Found support near its 50 DMA line ($85.28) after encountering distributional pressure in recent weeks and dropped from the Featured Stocks list on 5/13/19. Met stubborn resistance in the $97-98 area. Reported earnings +36% on +16% sales revenues for the Mar '19 quarter, continuing its strong earnings history.
>>> FEATURED STOCK ARTICLE : Rallying to Challenge Previously Stubborn Resistance - 5/2/2019 |
View all notes |
Set NEW NOTE alert |
Company Profile |
SEC
News |
Chart |
Request a new note
C
A
S
I |
SPLK
-
NASDAQ
Splunk Inc
Computer Sftwr-Database
|
$118.77
|
-3.42
-2.80% |
$121.99
|
2,477,052
153.64% of 50 DAV
50 DAV is 1,612,200
|
$143.70
-17.35%
|
5/22/2019
|
$136.52
|
PP = $143.80
|
|
MB = $150.99
|
Most Recent Note - 5/28/2019 1:09:45 PM
G - A prompt rebound above its 50 DMA ($131) is needed for its outlook to improve. Found support at its 200 DMA line ($117) after a big volume-driven loss. Its Relative Strength Rating has slumped to 69, below the 80+ minimum for buy candidates. Weakness came after it reported earnings of 2 cents per share versus a loss of 7 cents per share on +36% sales revenues from the year ago period ended April 30th. Members were repeatedly reminded - "Volume and volatility often increase near earnings news."
>>> FEATURED STOCK ARTICLE : Perched Near Prior High With Earnings News Due - 5/22/2019 |
View all notes |
Set NEW NOTE alert |
Company Profile |
SEC
News |
Chart |
Request a new note
C
A
S
I |
PAYC
-
NYSE
Paycom Software Inc
COMPUTER SOFTWARE and SERVICES - Application Software
|
$206.05
|
-2.14
-1.03% |
$208.36
|
655,579
94.74% of 50 DAV
50 DAV is 692,000
|
$215.65
-4.45%
|
2/6/2019
|
$171.66
|
PP = $164.18
|
|
MB = $172.39
|
Most Recent Note - 5/23/2019 12:58:05 PM
G - Pulling back after getting extended from any sound base. Its 50 DMA line ($194) defines important near-term support to watch. Reported earnings +25% on +30% sales revenues for the Mar '19 quarter.
>>> FEATURED STOCK ARTICLE : Paycom Software Quietly Hovering Near All-Time High - 4/16/2019 |
View all notes |
Set NEW NOTE alert |
Company Profile |
SEC
News |
Chart |
Request a new note
C
A
S
I |
PYPL
-
NASDAQ
Paypal Holdings Inc
Finance-CrdtCard/PmtPr
|
$110.08
|
-1.66
-1.49% |
$110.97
|
8,131,291
133.67% of 50 DAV
50 DAV is 6,083,000
|
$114.66
-3.99%
|
1/24/2019
|
$92.56
|
PP = $93.80
|
|
MB = $98.49
|
Most Recent Note - 5/23/2019 4:57:30 PM
G - Pulling back from its all-time high after getting very extended from any sound base. Well above its 50 DMA line ($107.37) and prior low which define near-term support to watch. Recently reported earnings +37% on +12% sales revenues for the Mar '19 quarter, continuing its strong earnings track record.
>>> FEATURED STOCK ARTICLE : Hovering Near All Time High Extended From Any Sound Base - 5/15/2019 |
View all notes |
Set NEW NOTE alert |
Company Profile |
SEC
News |
Chart |
Request a new note
C
A
S
I |
Symbol/Exchange
Company Name
Industry Group |
PRICE |
CHANGE
(%Change) |
Day High |
Volume
(% DAV)
(% 50 day avg vol) |
52 Wk Hi
% From Hi |
Featured
Date |
Price
Featured |
Pivot Featured |
|
Max Buy |
PLNT
-
NYSE
Planet Fitness Inc Cl A
Leisure-Services
|
$74.56
|
-0.93
-1.23% |
$75.27
|
1,199,415
84.88% of 50 DAV
50 DAV is 1,413,000
|
$81.76
-8.81%
|
11/7/2018
|
$57.10
|
PP = $55.45
|
|
MB = $58.22
|
Most Recent Note - 5/23/2019 5:59:05 PM
G - Pulled back today for a 5th consecutive loss after getting very extended from any sound base. Its 50 DMA line ($72.80) and prior low define near-term support. Reported earnings +30% on +23% sales revenues for its first quarter ended March 31, 2019. See the latest FSU analysis for more details and a new annotated graph.
>>> FEATURED STOCK ARTICLE : Pulling Back From High After Impressive Rally - 5/23/2019 |
View all notes |
Set NEW NOTE alert |
Company Profile |
SEC
News |
Chart |
Request a new note
C
A
S
I |
BLD
-
NYSE
Topbuild Corp
Bldg-Constr Prds/Misc
|
$77.11
|
-1.29
-1.65% |
$78.45
|
457,234
146.55% of 50 DAV
50 DAV is 312,000
|
$87.21
-11.58%
|
5/17/2019
|
$82.19
|
PP = $87.31
|
|
MB = $91.68
|
Most Recent Note - 5/23/2019 4:40:59 PM
Y - Encountered distributional pressure after highlighted in the 5/17/19 mid-day report. Subsequent gains above the pivot point backed by at least +40% above average volume may trigger a technical buy signal. Reported earnings +45% on +26% sales revenues for the Mar '19 quarter. Quarterly earnings increases have been above the +25% minimum guideline (C criteria). Annual earnings (A criteria) history has been strong and steady since turning profitable in FY '14.
>>> FEATURED STOCK ARTICLE : Encountered Distributional Pressure Near Prior High - 5/20/2019 |
View all notes |
Set NEW NOTE alert |
Company Profile |
SEC
News |
Chart |
Request a new note
C
A
S
I |
TEAM
-
NASDAQ
Atlassian Corp Plc Cl A
Comp Sftwr-Spec Enterprs
|
$123.80
|
-4.65
-3.62% |
$125.29
|
1,539,266
86.48% of 50 DAV
50 DAV is 1,780,000
|
$132.87
-6.83%
|
5/24/2019
|
$129.52
|
PP = $132.09
|
|
MB = $138.69
|
Most Recent Note - 5/29/2019 5:24:15 PM
Y - Gapped down today. Formed an advanced "3-weeks tight" base. Prior high ($117) defines important neat-term support to watch. Subsequent volume-driven gains for new highs may trigger a new (or add-on) technical buy signal. Reported earnings +133% on +38% sales revenues for the Mar '19 quarter, continuing its strong earnings track record.
>>> FEATURED STOCK ARTICLE : Perched Near All-Time High After "3-Weeks Tight" - 5/24/2019 |
View all notes |
Set NEW NOTE alert |
Company Profile |
SEC
News |
Chart |
Request a new note
C
A
S
I |
GLOB
-
NYSE
Globant SA
Computer-Tech Services
|
$88.35
|
-4.50
-4.85% |
$91.83
|
479,771
142.37% of 50 DAV
50 DAV is 337,000
|
$93.50
-5.51%
|
2/15/2019
|
$69.35
|
PP = $70.00
|
|
MB = $73.50
|
Most Recent Note - 5/29/2019 1:06:01 PM
G - Gapped down today, retreating from its all-time high after getting very extended from any sound base. Its 50 DMA line ($79.74) defines important support above the prior high ($74). Violations would raise concerns and trigger technical sell signals. Reported earnings +32% on +22% sales revenues for the quarter ended March 31st, 2019 versus the year ago period, continuing its strong earning track record.
>>> FEATURED STOCK ARTICLE : Earnings News Due While Perched Near All-Time High - 5/7/2019 |
View all notes |
Set NEW NOTE alert |
Company Profile |
SEC
News |
Chart |
Request a new note
C
A
S
I |
|
|
|
THESE ARE NOT BUY RECOMMENDATIONS!
Comments contained in the body of this report are technical
opinions only. The material herein has been obtained
from sources believed to be reliable and accurate, however,
its accuracy and completeness cannot be guaranteed.
This site is not an investment advisor, hence it does
not endorse or recommend any securities or other investments.
Any recommendation contained in this report may not
be suitable for all investors and it is not to be deemed
an offer or solicitation on our part with respect to
the purchase or sale of any securities. All trademarks,
service marks and trade names appearing in this report
are the property of their respective owners, and are
likewise used for identification purposes only.
This report is a service available
only to active Paid Premium Members.
You may opt-out of receiving report notifications
at any time. Questions or comments may be submitted
by writing to Premium Membership Services 665 S.E. 10 Street, Suite 201 Deerfield Beach, FL 33441-5634 or by calling 1-800-965-8307
or 954-785-1121.
|
|
|