You are not logged in.
This means you
CAN ONLY VIEW reports that were published prior to Friday, February 16, 2024.
You
MUST UPGRADE YOUR MEMBERSHIP if you want to see any current reports.
AFTER MARKET UPDATE - THURSDAY, MAY 28TH, 2020
Previous After Market Report Next After Market Report >>>
|
|
|
|
DOW |
-147.63 |
25,400.64 |
-0.58% |
|
Volume |
1,035,716,421 |
-9% |
|
Volume |
4,033,922,100 |
-9% |
|
NASDAQ |
-43.37 |
9,368.99 |
-0.46% |
|
Advancers |
1,220 |
42% |
|
Advancers |
1,113 |
34% |
|
S&P 500 |
-6.40 |
3,029.73 |
-0.21% |
|
Decliners |
1,665 |
58% |
|
Decliners |
2,125 |
66% |
|
Russell 2000 |
-35.69 |
1,400.67 |
-2.48% |
|
52 Wk Highs |
37 |
|
|
52 Wk Highs |
84 |
|
|
S&P 600 |
-26.49 |
811.49 |
-3.16% |
|
52 Wk Lows |
1 |
|
|
52 Wk Lows |
11 |
|
|
 |
The Major Indices Fell With Lighter Volume Totals
Kenneth J. Gruneisen - Passed the CAN SLIM® Master's Exam
The S&P 500 and Nasdaq Composite both snapped a three-day winning streak, falling 0.2% and 0.5%, respectively. The Dow reversed a more than 200 point gain to end 147 points lower. Breadth was negative as decliners led advancers by a 4-3 margin on the NYSE and by almost a 2-1 margin on the Nasdaq exchange. The reported volume totals were lower than the prior session on the NYSE and on the Nasdaq exchange. There were 43 high-ranked companies from the Leaders List that hit new 52-week highs and were listed on the BreakOuts Page, versus 20 on the prior session. New 52-week highs totals expanded and outnumbered new 52-week lows totals on the NYSE and on the Nasdaq exchange. The major indices are in a confirmed uptrend (M criteria). Any sustainable rally requires a healthy crop of new leaders, so the recent improvement in new highs totals was noted as an encouraging sign. Charts used courtesy of www.stockcharts.com
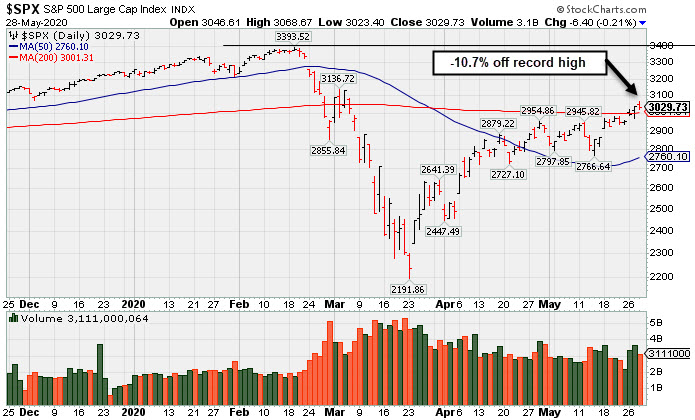
PICTURED: The S&P 500 Index finished -10.7% off its record high hit on 2/19/20. It has rebounded above the 200-day moving average (DMA) line. That marks an important technical hurdle, while continuing the impressive recovery from the March lows after an abrupt -35% correction.
Stocks finished lower on Thursday as rising tensions between the U.S and China weighed on investor sentiment. President Trump said that he would make an announcement regarding China tomorrow after Beijing approved a national security legislation for Hong Kong that has drawn sharp criticism from Washington.
Economic updates were also in focus. The weekly initial jobless claims report showed more than 2 million Americans filed for unemployment benefits for the 10th consecutive week. Continuing claims remained elevated at 21 million, but posted its first declined since March. Separately, a second reading on U.S. GDP revealed the economy contracted at a 5% pace during the first quarter, worsening from the initial 4.8% decline. Treasuries fluctuated within a narrow range. The yield on the 10-year note rose one basis point to 0.69%. In commodities, WTI crude added 1.9% to $33.44/barrel despite an official government report revealing a 7.9 million barrel build in U.S. inventories.
Six of 11 S&P 500 sectors finished in negative territory, with the Energy and Financial groups leading laggards. In earnings, Dollar Tree (DLTR +11.55%) rose after posting a better-than-expected jump in same-store sales. In other corporate news, Boeing (BA +0.20%) inched higher following an announcement that production of its 737-MAX aircrafts had resumed in Washington state. Elsewhere, Twitter (TWTR -4.45%) fell on reports that President Trump is expected to sign an executive order impacting how social media companies moderate users. |
 Kenneth J. Gruneisen started out as a licensed stockbroker in August 1987, a couple of months prior to the historic stock market crash that took the Dow Jones Industrial Average down -22.6% in a single day. He has published daily fact-based fundamental and technical analysis on high-ranked stocks online for two decades. Through FACTBASEDINVESTING.COM, Kenneth provides educational articles, news, market commentary, and other information regarding proven investment systems that work in good times and bad.
Comments contained in the body of this report are technical opinions only and are not necessarily those of Gruneisen Growth Corp. The material herein has been obtained from sources believed to be reliable and accurate, however, its accuracy and completeness cannot be guaranteed. Our firm, employees, and customers may effect transactions, including transactions contrary to any recommendation herein, or have positions in the securities mentioned herein or options with respect thereto. Any recommendation contained in this report may not be suitable for all investors and it is not to be deemed an offer or solicitation on our part with respect to the purchase or sale of any securities. |
|
 |
Financial, Tech, Retail, and Energy-Linked Groups Fell
Kenneth J. Gruneisen - Passed the CAN SLIM® Master's Exam
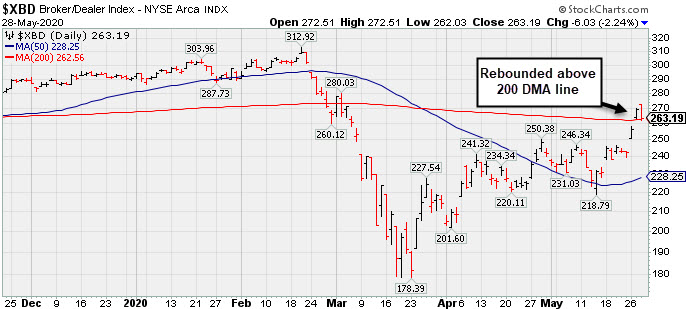
The Bank Index ($BKX -3.40%) and the Broker/Dealer Index ($XBD -2.24%) both pulled back on Thursday. The Retail Index ($RLX -0.58%) suffered a smaller loss. The tech sector had a negative bias as the Semiconductor Index ($SOX -2.31%) outpaced the Networking Index ($NWX -0.72%) to the downside and the Biotech Index ($BTK +0.01%) finished flat. Energy-linked groups also had a negative bias as the Oil Services Index ($OSX -0.92%) and Integrated Oil Index ($XOI -2.80%) both fell. The Gold & Silver Index ($XAU -0.16%) also edged lower.
PICTURED: The Broker/Dealer Index ($XBD -2.24%) recently rebounded above its 200 DMA line.
| Oil Services |
$OSX |
32.98 |
-0.25 |
-0.75% |
-57.87% |
| Integrated Oil |
$XOI |
794.49 |
-22.91 |
-2.80% |
-37.47% |
| Semiconductor |
$SOX |
1,804.66 |
-42.65 |
-2.31% |
-2.43% |
| Networking |
$NWX |
543.66 |
-3.92 |
-0.72% |
-6.81% |
| Broker/Dealer |
$XBD |
263.19 |
-6.03 |
-2.24% |
-9.37% |
| Retail |
$RLX |
2,765.72 |
-16.01 |
-0.58% |
+12.92% |
| Gold & Silver |
$XAU |
118.44 |
-0.19 |
-0.16% |
+10.77% |
| Bank |
$BKX |
76.12 |
-2.68 |
-3.40% |
-32.85% |
| Biotech |
$BTK |
5,573.17 |
+0.30 |
+0.01% |
+9.98% |
|
|
|
 |
Quietly Slumping Near 50-Day Moving Average Line
Kenneth J. Gruneisen - Passed the CAN SLIM® Master's Exam
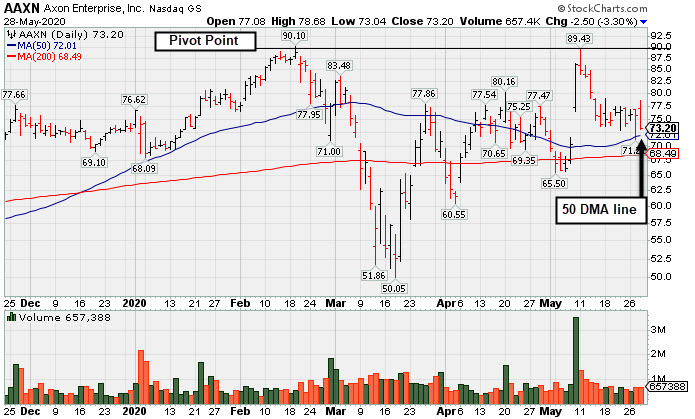
Axon Enterprise Inc (AAXN -$2.50 or -3.30% to $73.20) has been quietly pulling back and testing its 50-day moving average (DMA) line ($72) which defines important near-term support. More damaging losses would raise greater concerns and trigger a technical sell signal. A rebound and subsequent volume-driven gains above the pivot point are still needed to trigger a technical buy signal.
The company has a small supply of only 59.8 million shares outstanding (S criteria) which can contribute to greater price volatility in the event of institutional buying or selling. The number of top-rated funds owning its shares rose from 400 in Sep '19 to 444 in Mar '20, a reassuring sign concerning the I criteria. AAXN has a Timeliness Rating of B and an Accumulation/Distribution Rating of C-. The Security/Safety industry group currently has a Group Relative Strength Rating of B (63).
The Sep, Dec '19 and Mar '20 quarterly comparisons versus the year ago periods showed earnings increases above the +25% minimum guideline (C criteria) with strong underlying sales revenues increases. Its annual earnings (A criteria) history has also been strong, helping it get a 98 Earnings Per Share Rating. |
|
|
Color Codes Explained :
Y - Better candidates highlighted by our
staff of experts.
G - Previously featured
in past reports as yellow but may no longer be buyable under the
guidelines.
***Last / Change / Volume data in this table is the closing quote data***
Symbol/Exchange
Company Name
Industry Group |
PRICE |
CHANGE
(%Change) |
Day High |
Volume
(% DAV)
(% 50 day avg vol) |
52 Wk Hi
% From Hi |
Featured
Date |
Price
Featured |
Pivot Featured |
|
Max Buy |
 FTNT
-
NASDAQ
FTNT
-
NASDAQ
Fortinet Inc
Computer Sftwr-Security
|
$134.67
|
+3.52
2.68% |
$137.48
|
1,776,881
76.00% of 50 DAV
50 DAV is 2,338,000
|
$149.69
-10.03%
|
5/7/2020
|
$134.40
|
PP = $121.92
|
|
MB = $128.02
|
 Most Recent Note - 5/28/2020 8:04:38 PM
G - Posted a gain today with lighter volume following a pullback of 4 consecutive losses slumping near its "max buy" level. Prior highs in the $121 area define initial support to watch.
>>> FEATURED STOCK ARTICLE : Extended From Prior Base and Holding Ground Stubbornly - 5/22/2020 |
View all notes |
Set NEW NOTE alert |
Company Profile |
SEC
News |
Chart |
Request a new note
C
A
S
I |
SPNS
-
NASDAQ
Sapiens Intl Corp
COMPUTER SOFTWARE and SERVICES - Technical and System Software
|
$23.10
|
-0.82
-3.43% |
$24.13
|
135,851
89.97% of 50 DAV
50 DAV is 151,000
|
$29.24
-21.00%
|
5/11/2020
|
$27.80
|
PP = $26.96
|
|
MB = $28.31
|
Most Recent Note - 5/28/2020 4:20:28 PM
Pulled back today for a 3rd consecutive loss. It will be dropped from the Featured Stocks list tonight based on technical and fundamental deterioration. Encountered distributional pressure recently, yet found prompt support at its 200 DMA line. Recently reported Mar '20 quarterly earnings +18% on +18% sales revenues versus the year ago period, below the +25% minimum guideline (C criteria), raising fundamental concerns.
>>> FEATURED STOCK ARTICLE : Stalled After Quarter Missed Investment System's Minimum Guideline - 5/27/2020 |
View all notes |
Set NEW NOTE alert |
Company Profile |
SEC
News |
Chart |
Request a new note
C
A
S
I |
EBS
-
NYSE
Emergent Biosolutions
DRUGS - Biotechnology
|
$81.98
|
-2.15
-2.56% |
$84.37
|
405,473
75.93% of 50 DAV
50 DAV is 534,000
|
$90.00
-8.91%
|
4/24/2020
|
$72.10
|
PP = $73.99
|
|
MB = $77.69
|
Most Recent Note - 5/27/2020 5:40:23 PM
G - Managed an impressive "positive reversal" for a small gain today with above average volume after undercutting the 20-day moving average ($81.81). It is extended from the previously noted base. Prior highs in the $71-73 area define initial support to watch on pullbacks. Fundamentals remain strong. See the latest FSU analysis for more details and an annotated graph.
>>> FEATURED STOCK ARTICLE : Volume Light Behind Recent Pullback From All-Time High - 5/26/2020 |
View all notes |
Set NEW NOTE alert |
Company Profile |
SEC
News |
Chart |
Request a new note
C
A
S
I |
NBIX
-
NASDAQ
Neurocrine Biosciences
DRUGS - Biotechnology
|
$120.22
|
+1.11
0.93% |
$122.97
|
341,432
45.95% of 50 DAV
50 DAV is 743,000
|
$128.29
-6.29%
|
5/19/2020
|
$123.71
|
PP = $119.75
|
|
MB = $125.74
|
Most Recent Note - 5/27/2020 5:46:57 PM
Y - Managed a "positive reversal" for a small gain today with above average volume. Its pullback negated the recent breakout by closing back below the pivot point, raising some concerns. Recent quarterly comparisons through Mar '20 showed greatly improved sales revenues and earnings increases versus year ago periods (C criteria). After years of losses it reported solid annual earnings (A criteria) in FY '18 and '19.
>>> FEATURED STOCK ARTICLE : Biotech Firm Has New Parkinson's Treatment Drug Approved by FDA - 5/19/2020 |
View all notes |
Set NEW NOTE alert |
Company Profile |
SEC
News |
Chart |
Request a new note
C
A
S
I |
TREX
-
NYSE
Trex Company Inc
MATERIALS and CONSTRUCTION - General Building Materials
|
$119.76
|
-5.95
-4.73% |
$127.76
|
1,124,861
108.47% of 50 DAV
50 DAV is 1,037,000
|
$132.84
-9.85%
|
5/5/2020
|
$109.05
|
PP = $111.95
|
|
MB = $117.55
|
Most Recent Note - 5/28/2020 4:24:14 PM
G - Pulled back with higher volume today for a 2nd consecutive loss after hitting new all-time highs this week. Recent gains above the pivot point lacked the great volume conviction indicative of institutional demand. Prior highs in the $111 area define initial support to watch on pullbacks. Fundamentals remain strong.
>>> FEATURED STOCK ARTICLE : Bullish Action Continues for Top Wood Alternative Firm - 5/20/2020 |
View all notes |
Set NEW NOTE alert |
Company Profile |
SEC
News |
Chart |
Request a new note
C
A
S
I |
Symbol/Exchange
Company Name
Industry Group |
PRICE |
CHANGE
(%Change) |
Day High |
Volume
(% DAV)
(% 50 day avg vol) |
52 Wk Hi
% From Hi |
Featured
Date |
Price
Featured |
Pivot Featured |
|
Max Buy |
NFLX
-
NASDAQ
Netflix Inc
SPECIALTY RETAIL - Music and Video Stores
|
$413.44
|
-6.45
-1.54% |
$422.37
|
5,637,143
61.23% of 50 DAV
50 DAV is 9,207,000
|
$458.97
-9.92%
|
5/14/2020
|
$441.95
|
PP = $449.62
|
|
MB = $472.10
|
Most Recent Note - 5/27/2020 5:49:47 PM
Y - Managed a "positive reversal" for a gain today backed by above average volume, breaking a streak of 6 consecutive losses with below average volume. Found prompt support near its 50 DMA line ($403) which defines support above prior highs in the $393 area. A rebound and subsequent gains above the pivot point must be backed by at least +40% above average volume to trigger a proper new (or add-on) technical buy signal. Fundamentals remain strong.
>>> FEATURED STOCK ARTICLE : Pulling Back After Brief New Base Formation - 5/21/2020 |
View all notes |
Set NEW NOTE alert |
Company Profile |
SEC
News |
Chart |
Request a new note
C
A
S
I |
NOW
-
NYSE
Servicenow Inc
Computer Sftwr-Enterprse
|
$377.98
|
+6.82
1.84% |
$386.67
|
1,543,281
59.56% of 50 DAV
50 DAV is 2,591,000
|
$396.15
-4.59%
|
4/30/2020
|
$343.05
|
PP = $363.05
|
|
MB = $381.20
|
Most Recent Note - 5/27/2020 5:53:29 PM
Y - Suffered a loss with above average volume yet finished in the upper third of its intra-day range today. There was a "negative reversal" on the prior session at its all-time high. Color code was changed to yellow after retreating below the "max buy" level. Recent gains above the pivot point were not backed by the +40% above average volume necessary to clinch a proper technical buy signal. Prior highs in the $362 area define initial support to watch on pullbacks.
>>> FEATURED STOCK ARTICLE : Consolidating Near Prior High After Wedging Into New High Ground - 5/14/2020 |
View all notes |
Set NEW NOTE alert |
Company Profile |
SEC
News |
Chart |
Request a new note
C
A
S
I |
QLYS
-
NASDAQ
Qualys Inc
Computer Sftwr-Security
|
$111.66
|
-1.13
-1.00% |
$115.38
|
322,121
55.44% of 50 DAV
50 DAV is 581,000
|
$117.54
-5.00%
|
4/9/2020
|
$100.44
|
PP = $97.22
|
|
MB = $102.08
|
Most Recent Note - 5/27/2020 5:55:22 PM
G - Pulled back with +21% above average volume today, retreating from a new all-time high quietly hit on the prior session. Prior highs in the $97 area recently acted as support. Fundamentals remain strong.
>>> FEATURED STOCK ARTICLE : Quiet Pullback Just Below "Max Buy" Level - 5/13/2020 |
View all notes |
Set NEW NOTE alert |
Company Profile |
SEC
News |
Chart |
Request a new note
C
A
S
I |
TEAM
-
NASDAQ
Atlassian Corp Plc Cl A
Comp Sftwr-Spec Enterprs
|
$178.32
|
+3.01
1.72% |
$180.46
|
2,045,092
102.46% of 50 DAV
50 DAV is 1,996,000
|
$190.21
-6.25%
|
5/4/2020
|
$159.70
|
PP = $156.22
|
|
MB = $164.03
|
Most Recent Note - 5/27/2020 2:44:34 PM
G - Briefly dipped below the "max buy" level at the session's early low. Prior highs in the $156 area define initial support to watch.
>>> FEATURED STOCK ARTICLE : Pullback on Lighter Volume After Gain For New High on Big Volume - 5/18/2020 |
View all notes |
Set NEW NOTE alert |
Company Profile |
SEC
News |
Chart |
Request a new note
C
A
S
I |
AAXN
-
NASDAQ
Axon Enterprise Inc
Security/Sfty
|
$73.20
|
-2.50
-3.30% |
$78.68
|
651,392
81.63% of 50 DAV
50 DAV is 798,000
|
$90.10
-18.76%
|
5/8/2020
|
$84.86
|
PP = $90.20
|
|
MB = $94.71
|
Most Recent Note - 5/28/2020 8:00:05 PM
G - Color code was changed to green while quietly testing its 50 DMA line ($72) which defines important near-term support. A rebound and subsequent volume-driven gains above the pivot point are still needed to trigger a technical buy signal. See the latest FSU analysis for more details and a new annotated graph.
>>> FEATURED STOCK ARTICLE : Quietly Slumping Near 50-Day Moving Average Line - 5/28/2020 |
View all notes |
Set NEW NOTE alert |
Company Profile |
SEC
News |
Chart |
Request a new note
C
A
S
I |
Symbol/Exchange
Company Name
Industry Group |
PRICE |
CHANGE
(%Change) |
Day High |
Volume
(% DAV)
(% 50 day avg vol) |
52 Wk Hi
% From Hi |
Featured
Date |
Price
Featured |
Pivot Featured |
|
Max Buy |
|
|
|
THESE ARE NOT BUY RECOMMENDATIONS!
Comments contained in the body of this report are technical
opinions only. The material herein has been obtained
from sources believed to be reliable and accurate, however,
its accuracy and completeness cannot be guaranteed.
This site is not an investment advisor, hence it does
not endorse or recommend any securities or other investments.
Any recommendation contained in this report may not
be suitable for all investors and it is not to be deemed
an offer or solicitation on our part with respect to
the purchase or sale of any securities. All trademarks,
service marks and trade names appearing in this report
are the property of their respective owners, and are
likewise used for identification purposes only.
This report is a service available
only to active Paid Premium Members.
You may opt-out of receiving report notifications
at any time. Questions or comments may be submitted
by writing to Premium Membership Services 665 S.E. 10 Street, Suite 201 Deerfield Beach, FL 33441-5634 or by calling 1-800-965-8307
or 954-785-1121.
|
|
|