You are not logged in.
This means you
CAN ONLY VIEW reports that were published prior to Sunday, February 18, 2024.
You
MUST UPGRADE YOUR MEMBERSHIP if you want to see any current reports.
AFTER MARKET UPDATE - TUESDAY, MAY 28TH, 2019
Previous After Market Report Next After Market Report >>>
|
|
|
|
DOW |
-237.92 |
25,347.77 |
-0.93% |
|
Volume |
1,444,865,220 |
+126% |
|
Volume |
2,336,845,640 |
+39% |
|
NASDAQ |
-29.66 |
7,607.35 |
-0.39% |
|
Advancers |
970 |
33% |
|
Advancers |
1,141 |
37% |
|
S&P 500 |
-23.67 |
2,802.39 |
-0.84% |
|
Decliners |
1,989 |
67% |
|
Decliners |
1,953 |
63% |
|
Russell 2000 |
-10.09 |
1,504.02 |
-0.67% |
|
52 Wk Highs |
127 |
|
|
52 Wk Highs |
79 |
|
|
S&P 600 |
-5.75 |
911.79 |
-0.63% |
|
52 Wk Lows |
108 |
|
|
52 Wk Lows |
131 |
|
|
 |
Major Indices Fall as Distributional Pressure Continues
Kenneth J. Gruneisen - Passed the CAN SLIM® Master's Exam
Stocks erased early gains to finish lower Tuesday. Investors continued to assess trade updates and a decline in Treasury yields. The Dow dropped 237 points on the heels of its five-week losing streak. The S&P 500 lost 0.8%, while the Nasdaq Composite was down 0.4%. The volume totals reported were higher on the NYSE and on the Nasdaq exchange, revealing greater conviction behind institutional selling. Breadth was negative as decliners led advancers by a 2-1 margin on the NYSE and 5-3 on the Nasdaq exchange. There were 30 high-ranked companies from the Leaders List that hit new 52-week highs and were listed on the BreakOuts Page, versus the total of 32 on the prior session. New 52-week highs outnumbered new 52-week lows on the NYSE but new lows outnumbered new highs on the Nasdaq exchange. While the major indices (M criteria) are showing action indicative of a market "correction" the fact-based investment system discourages any new buying efforts and also suggests selling stocks on a case-by-case basis, raising cash levels to reduce market exposure. The Featured Stocks Page provides the most timely analysis on high-ranked leaders. Charts used courtesy of www.stockcharts.com
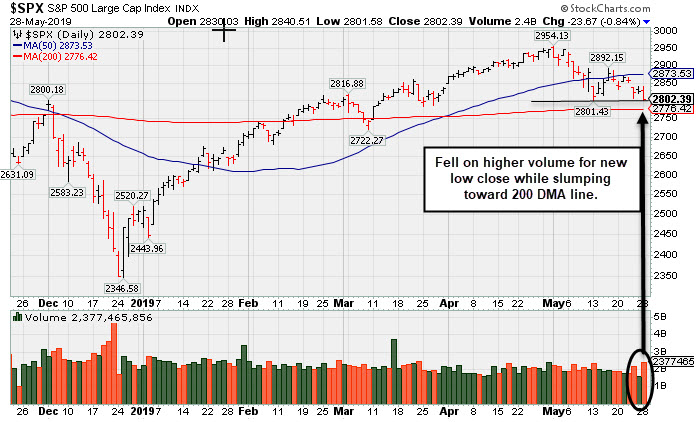
PICTURED: The S&P 500 Index suffered another loss on higher volume while sputtering near the prior low and just above its 200-day moving average (DMA) line. Disciplined investors have been watching for a follow-through day of big gains (more than +1%) from at least one of the major indices backed with higher volume and an expansion in stocks reaching new 52-week highs - all of which are critical components for a new confirmed uptrend under the fact-based system.
Yesterday, President Trump said he was “not yet ready” to make a deal with China. Beijing also hinted that it could restrict the use of precious metals required by chipmakers. Treasuries rallied as investors sought perceived safe haven assets, with the yield on the 10-year note falling four basis points to 2.27%, the lowest since late 2017. Meanwhile, the yield curve between the 10-year note and the three-month T-bill inverted for the third time this year.
10 of 11 S&P 500 sectors closed in negative territory, with the Communication Services group the sole advancer. In M&A news, Global Payments (GPN -2.98%) fell after announcing the acquisition of rival Total System Services (TSS +4.79%) in a $21.5 billion stock deal. Fiat Chrysler (FCAU +7.24%) rose on news the company is seeking a “merger of equals” with Renault that would create the world’s third largest automaker.
On the data front, a reading on consumer confidence came in above expectations in May, hovering near an 18-year high. The S&P CoreLogic Case-Schiller survey revealed housing price gains in 20 U.S. cities slowed for a 12th consecutive month in March.
|
 Kenneth J. Gruneisen started out as a licensed stockbroker in August 1987, a couple of months prior to the historic stock market crash that took the Dow Jones Industrial Average down -22.6% in a single day. He has published daily fact-based fundamental and technical analysis on high-ranked stocks online for two decades. Through FACTBASEDINVESTING.COM, Kenneth provides educational articles, news, market commentary, and other information regarding proven investment systems that work in good times and bad.
Comments contained in the body of this report are technical opinions only and are not necessarily those of Gruneisen Growth Corp. The material herein has been obtained from sources believed to be reliable and accurate, however, its accuracy and completeness cannot be guaranteed. Our firm, employees, and customers may effect transactions, including transactions contrary to any recommendation herein, or have positions in the securities mentioned herein or options with respect thereto. Any recommendation contained in this report may not be suitable for all investors and it is not to be deemed an offer or solicitation on our part with respect to the purchase or sale of any securities. |
|
 |
Financial, Tech, Retail, and Commodity-Linked Groups Fell
Kenneth J. Gruneisen - Passed the CAN SLIM® Master's Exam
The Bank Index ($BKX -1.43%) and Broker/Dealer Index ($XBD -1.63%) both slumped for large losses and the Retail Index ($RLX -0.36%) also edged lower. The tech sector had a negative bias as the Semiconductor Index ($SOX -0.89%), Networking Index ($NWX -0.99%), and the Biotech Index ($BTK -0.93%) suffered unanimous losses. Commodity-linked groups also fell as the Oil Services Index ($OSX -1.74%), Integrated Oil Index ($XOI -0.94%), and Gold & Silver Index ($XAU -0.47%) each lost ground. Charts courtesy of www.stockcharts.com
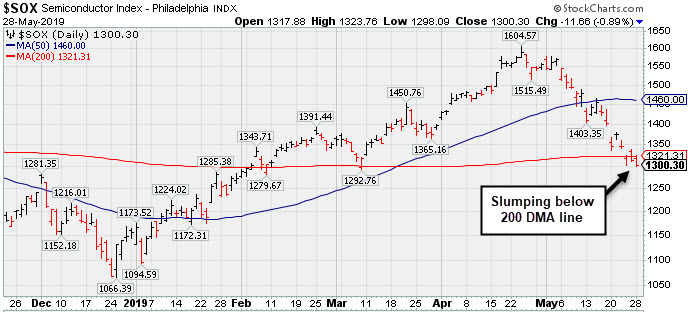 PICTURED: The Semiconductor Index ($SOX -0.89%) is slumping below its 200-day moving average (DMA) line.
| Oil Services |
$OSX |
76.59 |
-1.36 |
-1.74% |
-4.98% |
| Integrated Oil |
$XOI |
1,211.75 |
-11.50 |
-0.94% |
+4.54% |
| Semiconductor |
$SOX |
1,300.30 |
-11.67 |
-0.89% |
+12.56% |
| Networking |
$NWX |
550.69 |
-5.48 |
-0.99% |
+12.69% |
| Broker/Dealer |
$XBD |
258.48 |
-4.30 |
-1.63% |
+8.91% |
| Retail |
$RLX |
2,239.90 |
-8.05 |
-0.36% |
+14.78% |
| Gold & Silver |
$XAU |
66.24 |
-0.32 |
-0.48% |
-6.26% |
| Bank |
$BKX |
94.47 |
-1.37 |
-1.43% |
+10.12% |
| Biotech |
$BTK |
4,466.20 |
-41.79 |
-0.93% |
+5.81% |
|
|
|
 |
Rallied But Slumped Back Near 50-Day Moving Average
Kenneth J. Gruneisen - Passed the CAN SLIM® Master's Exam
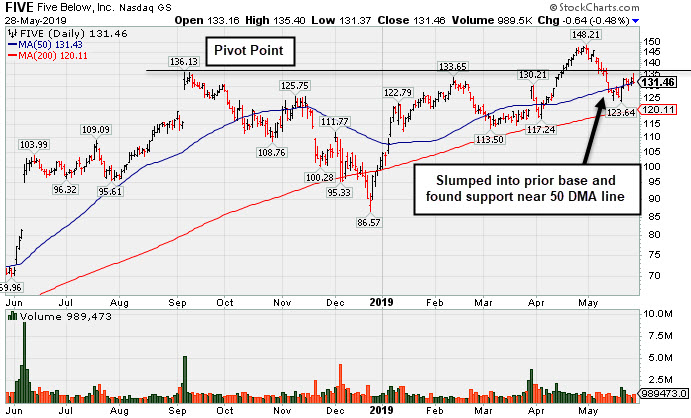
Five Below Inc (FIVE -$0.64 or -0.48% to $131.46) is consolidating near its 50-day moving average (DMA) line ($131.43). Below that important short-term average, the recent low ($123.64 on 5/20/19) defines important near-term support above its 200 DMA line. It has sputtered in recent weeks, but made good progress for a couple of weeks after finishing strong when highlighted in yellow with new pivot point cited based on its 2/12/19 high plus 10 cents in the 4/11/19 mid-day report (read here). It was last shown in this FSU section on 4/11/19 with an annotated graph under the headline, "Finished Strong After Featured Again in Mid-Day Report".
Recently it reported earnings +34% on +19% sales revenues for the Jan '19 quarter versus the year ago period. Three of the past 4 quarterly earnings comparisons had increases above the +25% minimum guideline (C criteria). The Retail - Discount & Variety firm has a 97 Earnings Per Share Rating and matches the fact-based investment system's winning models with a good annual earnings (A criteria) track record.
It traded up as much as +159% since highlighted in yellow with new pivot point cited based on its 5/19/17 high plus 10 cents in the 10/06/17 mid-day report (read here). Its current Up/Down Volume Ratio of 1.4 is an unbiased indication its shares have been under accumulation over the past 50 days. Its current Timeliness Rating is A and its Sponsorship Rating is B.
FIVE had a choppy history since its $17 IPO in July 2012 and 3 subsequent Secondary Offerings. It still has a small supply of 55.8 million shares outstanding (S criteria), which can lead to greater price volatility in the event of institutional buying or selling. The number of top-rated funds owning its shares rose from 465 in Sep '17 to 687 in Mar '19, a reassuring sign concerning the I criteria.
|
|
|
Color Codes Explained :
Y - Better candidates highlighted by our
staff of experts.
G - Previously featured
in past reports as yellow but may no longer be buyable under the
guidelines.
***Last / Change / Volume data in this table is the closing quote data***
Symbol/Exchange
Company Name
Industry Group |
PRICE |
CHANGE
(%Change) |
Day High |
Volume
(% DAV)
(% 50 day avg vol) |
52 Wk Hi
% From Hi |
Featured
Date |
Price
Featured |
Pivot Featured |
|
Max Buy |
SPSC
-
NASDAQ
S P S Commerce Inc
COMPUTER SOFTWARE and SERVICES - Application Software
|
$101.93
|
+0.46
0.45% |
$103.56
|
84,319
54.75% of 50 DAV
50 DAV is 154,000
|
$115.00
-11.37%
|
3/26/2019
|
$107.12
|
PP = $113.41
|
|
MB = $119.08
|
Most Recent Note - 5/24/2019 4:18:40 PM
G - Met resistance while sputtering below its 50 DMA line ($104.60) and it faces resistance due to overhead supply up to the $115 level. Recent low ($98.59 on 4/18/19) defines important near-term support to watch. Fundamentals remain strong.
>>> FEATURED STOCK ARTICLE : Sputtering Near 50-Day Average Line Building Base-On-Base - 5/1/2019 |
View all notes |
Set NEW NOTE alert |
Company Profile |
SEC
News |
Chart |
Request a new note
C
A
S
I |
EPAM
-
NYSE
Epam Systems Inc
COMPUTER SOFTWARE and SERVICES - Information Technology Service
|
$166.95
|
-0.36
-0.22% |
$170.07
|
2,793,374
735.10% of 50 DAV
50 DAV is 380,000
|
$180.55
-7.53%
|
5/9/2019
|
$169.25
|
PP = $180.55
|
|
MB = $189.58
|
 Most Recent Note - 5/28/2019 12:43:24 PM
G - Met resistance near its 50 DMA line ($171) in recent weeks, and a rebound above that important short-term average is needed for its outlook to improve. Reported earnings +34% on +23% sales revenues for the Mar '19 quarter, continuing its strong earnings track record.
>>> FEATURED STOCK ARTICLE : Found Support and Closed in Upper Third of Day's Range - 5/9/2019 |
View all notes |
Set NEW NOTE alert |
Company Profile |
SEC
News |
Chart |
Request a new note
C
A
S
I |
ENV
-
NYSE
Envestnet Inc
FINANCIAL SERVICES - Diversified Investments
|
$68.86
|
+0.69
1.01% |
$69.17
|
312,073
104.02% of 50 DAV
50 DAV is 300,000
|
$72.67
-5.24%
|
3/15/2019
|
$66.05
|
PP = $64.90
|
|
MB = $68.15
|
Most Recent Note - 5/28/2019 8:21:33 PM
G - Consolidating above its 50 DMA line ($68.07). Weak action came after recently reporting earnings +5% on +1% sales revenues for the Mar '19 quarter, below the +25% minimum earnings guideline (C criteria). The prior high ($64.80 on 9/14/18) defines important near-term support to watch.
>>> FEATURED STOCK ARTICLE : Negative Reversal After Another New High - 4/24/2019 |
View all notes |
Set NEW NOTE alert |
Company Profile |
SEC
News |
Chart |
Request a new note
C
A
S
I |
TPL
-
NYSE
Texas Pacific Land Trust
Real Estate Dvlpmt/Ops
|
$801.79
|
+18.23
2.33% |
$815.50
|
154
0.64% of 50 DAV
50 DAV is 24,000
|
$915.66
-12.44%
|
5/15/2019
|
$850.01
|
PP = $915.76
|
|
MB = $961.55
|
Most Recent Note - 5/23/2019 12:57:01 PM
G - Color code is changed to green while slumping below its 50 DMA line ($817) with today's loss raising concerns. A prompt rebound is needed for its outlook to improve. Subsequent gains above the pivot point backed by at least +40% above average volume may trigger a technical buy signal. Keep in mind that the major averages (M criteria) need a follow-through day to confirm a new uptrend before any new buying efforts are justified under the fact-based investment system. Reported earnings +222% on +219% sales revenues for the Mar '19 quarter continuing its strong earnings track record.
>>> FEATURED STOCK ARTICLE : Recently Found Support and Rose Toward All-Time High - 5/17/2019 |
View all notes |
Set NEW NOTE alert |
Company Profile |
SEC
News |
Chart |
Request a new note
C
A
S
I |
LHCG
-
NASDAQ
L H C Group Inc
HEALTH SERVICES - Home Health Care
|
$114.40
|
-0.09
-0.08% |
$115.44
|
264,965
101.13% of 50 DAV
50 DAV is 262,000
|
$122.20
-6.38%
|
4/29/2019
|
$110.94
|
PP = $115.64
|
|
MB = $121.42
|
Most Recent Note - 5/23/2019 4:39:43 PM
Y - Slumped back below its "max buy" level and undercut its pivot point with a loss today on higher volume and its color code is changed to yellow. Its 50 DMA line ($111) defines near-term support Fundamentals remain strong.
>>> FEATURED STOCK ARTICLE : Long-Term Care Firm Hovering Near All-Time High - 5/14/2019 |
View all notes |
Set NEW NOTE alert |
Company Profile |
SEC
News |
Chart |
Request a new note
C
A
S
I |
Symbol/Exchange
Company Name
Industry Group |
PRICE |
CHANGE
(%Change) |
Day High |
Volume
(% DAV)
(% 50 day avg vol) |
52 Wk Hi
% From Hi |
Featured
Date |
Price
Featured |
Pivot Featured |
|
Max Buy |
ENSG
-
NASDAQ
Ensign Group Inc
HEALTH SERVICES - Long-Term Care Facilities
|
$55.11
|
-0.16
-0.29% |
$55.69
|
349,193
114.87% of 50 DAV
50 DAV is 304,000
|
$58.14
-5.21%
|
4/30/2019
|
$51.46
|
PP = $53.30
|
|
MB = $55.97
|
Most Recent Note - 5/24/2019 5:44:01 PM
Y - Posted a big gain today with below average volume. Showing resilience in recent weeks after it reported earnings +22% on +12% sales revenues for the Mar '19 quarter, below the +25% minimum earnings guideline (C criteria), raising fundamental concerns.
>>> FEATURED STOCK ARTICLE : Two Damaging Losses Hurt Outlook - 4/17/2019 |
View all notes |
Set NEW NOTE alert |
Company Profile |
SEC
News |
Chart |
Request a new note
C
A
S
I |
LULU
-
NASDAQ
Lululemon Athletica
MANUFACTURING - Textile Manufacturing
|
$173.55
|
+0.77
0.45% |
$176.04
|
2,032,705
92.06% of 50 DAV
50 DAV is 2,208,000
|
$179.50
-3.31%
|
3/28/2019
|
$169.20
|
PP = $164.89
|
|
MB = $173.13
|
Most Recent Note - 5/23/2019 4:49:34 PM
Y - Color code is changed to yellow after pulling back below its "max buy" level. Its 50 DMA line ($166.91) defines important near-term support above prior highs in the $164 area.
>>> FEATURED STOCK ARTICLE : Volume Light While Hovering Near High - 5/10/2019 |
View all notes |
Set NEW NOTE alert |
Company Profile |
SEC
News |
Chart |
Request a new note
C
A
S
I |
ULTA
-
NASDAQ
Ulta Beauty Inc
SPECIALTY RETAIL - Specialty Retail, Other
|
$334.85
|
-0.24
-0.07% |
$338.50
|
1,002,541
136.21% of 50 DAV
50 DAV is 736,000
|
$359.69
-6.91%
|
3/15/2019
|
$341.27
|
PP = $322.59
|
|
MB = $338.72
|
Most Recent Note - 5/23/2019 4:55:27 PM
G - Slumped below its 50 DMA line ($345) with a volume-driven loss today hurting its outlook. Prior low ($325.62 on 5/14/19) defines important near-term support. It may be forming a new base and there is little resistance remaining up to the $359 level.
>>> FEATURED STOCK ARTICLE : Volume Totals Cooling in Recent Weeks While Hovering Near High - 4/26/2019 |
View all notes |
Set NEW NOTE alert |
Company Profile |
SEC
News |
Chart |
Request a new note
C
A
S
I |
ESNT
-
NYSE
Essent Group Ltd
Finance-MrtgandRel Svc
|
$48.10
|
+0.34
0.71% |
$48.68
|
422,669
63.85% of 50 DAV
50 DAV is 662,000
|
$48.88
-1.60%
|
3/18/2019
|
$45.84
|
PP = $45.06
|
|
MB = $47.31
|
Most Recent Note - 5/28/2019 8:22:43 PM
Y - Still perched near its 52-week high. Recently reported earnings +15% on +20% sales revenues for the Mar '19 quarter, below the +25% minimum earnings guideline (C criteria), raising fundamental concerns. Its 50 DMA line ($46.16) defines near term support to watch. Faces very little resistance due to overhead supply up to the $50 level.
>>> FEATURED STOCK ARTICLE : Perched Above Pivot Point With Earnings News Due May 3rd - 4/25/2019 |
View all notes |
Set NEW NOTE alert |
Company Profile |
SEC
News |
Chart |
Request a new note
C
A
S
I |
FIVE
-
NASDAQ
Five Below Inc
Retail-DiscountandVariety
|
$131.46
|
-0.64
-0.48% |
$135.40
|
984,767
85.71% of 50 DAV
50 DAV is 1,149,000
|
$148.22
-11.31%
|
4/11/2019
|
$132.05
|
PP = $133.75
|
|
MB = $140.44
|
Most Recent Note - 5/28/2019 8:16:32 PM
Y - Consolidating near its 50 DMA line ($131.43). Recent low ($123.64 on 5/20/19) defines important near-term support above its 200 DMA line. See the latest FSU analysis for more details and a new annotated graph.
>>> FEATURED STOCK ARTICLE : Rallied But Slumped Back Near 50-Day Moving Average - 5/28/2019 |
View all notes |
Set NEW NOTE alert |
Company Profile |
SEC
News |
Chart |
Request a new note
C
A
S
I |
Symbol/Exchange
Company Name
Industry Group |
PRICE |
CHANGE
(%Change) |
Day High |
Volume
(% DAV)
(% 50 day avg vol) |
52 Wk Hi
% From Hi |
Featured
Date |
Price
Featured |
Pivot Featured |
|
Max Buy |
NOW
-
NYSE
Servicenow Inc
Computer Sftwr-Enterprse
|
$266.65
|
-2.30
-0.86% |
$272.12
|
1,413,454
78.26% of 50 DAV
50 DAV is 1,806,000
|
$281.74
-5.36%
|
4/22/2019
|
$242.64
|
PP = $251.75
|
|
MB = $264.34
|
Most Recent Note - 5/24/2019 4:17:11 PM
G - The 50 DMA line ($254) and prior high ($251.65 on 3/21/19) define important near-term support to watch while consolidating near its all-time high. Recently reported earnings +20% on +34% sales revenues for the Mar '19 quarter, below the +25% minimum earnings guideline (C criteria), raising concerns, fundamentally.
>>> FEATURED STOCK ARTICLE : Found Recent Support at 50-Day Moving Average - 4/15/2019 |
View all notes |
Set NEW NOTE alert |
Company Profile |
SEC
News |
Chart |
Request a new note
C
A
S
I |
QLYS
-
NASDAQ
Qualys Inc
Computer Sftwr-Security
|
$91.72
|
+1.31
1.45% |
$92.00
|
316,819
97.18% of 50 DAV
50 DAV is 326,000
|
$98.30
-6.69%
|
5/23/2019
|
$90.43
|
PP = $98.40
|
|
MB = $103.32
|
Most Recent Note - 5/24/2019 4:15:23 PM
Y - Color code was changed to yellow while subsequent volume-driven gains above the pivot point are needed to trigger a technical buy signal. Its Relative Strength Rating has improved to 88, above the 80+ minimum guideline for buy candidates. Found support near its 50 DMA line ($85.28) after encountering distributional pressure in recent weeks and dropped from the Featured Stocks list on 5/13/19. Met stubborn resistance in the $97-98 area. Reported earnings +36% on +16% sales revenues for the Mar '19 quarter, continuing its strong earnings history.
>>> FEATURED STOCK ARTICLE : Rallying to Challenge Previously Stubborn Resistance - 5/2/2019 |
View all notes |
Set NEW NOTE alert |
Company Profile |
SEC
News |
Chart |
Request a new note
C
A
S
I |
SPLK
-
NASDAQ
Splunk Inc
Computer Sftwr-Database
|
$122.19
|
+2.89
2.42% |
$124.98
|
15,748
65.62% of 50 DAV
50 DAV is 24,000
|
$143.70
-14.97%
|
5/22/2019
|
$136.52
|
PP = $143.80
|
|
MB = $150.99
|
Most Recent Note - 5/28/2019 1:09:45 PM
G - A prompt rebound above its 50 DMA ($131) is needed for its outlook to improve. Found support at its 200 DMA line ($117) after a big volume-driven loss. Its Relative Strength Rating has slumped to 69, below the 80+ minimum for buy candidates. Weakness came after it reported earnings of 2 cents per share versus a loss of 7 cents per share on +36% sales revenues from the year ago period ended April 30th. Members were repeatedly reminded - "Volume and volatility often increase near earnings news."
>>> FEATURED STOCK ARTICLE : Perched Near Prior High With Earnings News Due - 5/22/2019 |
View all notes |
Set NEW NOTE alert |
Company Profile |
SEC
News |
Chart |
Request a new note
C
A
S
I |
PAYC
-
NYSE
Paycom Software Inc
COMPUTER SOFTWARE and SERVICES - Application Software
|
$208.19
|
-0.04
-0.02% |
$212.70
|
2,636,382
406.85% of 50 DAV
50 DAV is 648,000
|
$215.65
-3.46%
|
2/6/2019
|
$171.66
|
PP = $164.18
|
|
MB = $172.39
|
Most Recent Note - 5/23/2019 12:58:05 PM
G - Pulling back after getting extended from any sound base. Its 50 DMA line ($194) defines important near-term support to watch. Reported earnings +25% on +30% sales revenues for the Mar '19 quarter.
>>> FEATURED STOCK ARTICLE : Paycom Software Quietly Hovering Near All-Time High - 4/16/2019 |
View all notes |
Set NEW NOTE alert |
Company Profile |
SEC
News |
Chart |
Request a new note
C
A
S
I |
PYPL
-
NASDAQ
Paypal Holdings Inc
Finance-CrdtCard/PmtPr
|
$111.74
|
+1.89
1.72% |
$113.14
|
6,154,742
99.74% of 50 DAV
50 DAV is 6,171,000
|
$114.66
-2.55%
|
1/24/2019
|
$92.56
|
PP = $93.80
|
|
MB = $98.49
|
Most Recent Note - 5/23/2019 4:57:30 PM
G - Pulling back from its all-time high after getting very extended from any sound base. Well above its 50 DMA line ($107.37) and prior low which define near-term support to watch. Recently reported earnings +37% on +12% sales revenues for the Mar '19 quarter, continuing its strong earnings track record.
>>> FEATURED STOCK ARTICLE : Hovering Near All Time High Extended From Any Sound Base - 5/15/2019 |
View all notes |
Set NEW NOTE alert |
Company Profile |
SEC
News |
Chart |
Request a new note
C
A
S
I |
Symbol/Exchange
Company Name
Industry Group |
PRICE |
CHANGE
(%Change) |
Day High |
Volume
(% DAV)
(% 50 day avg vol) |
52 Wk Hi
% From Hi |
Featured
Date |
Price
Featured |
Pivot Featured |
|
Max Buy |
PLNT
-
NYSE
Planet Fitness Inc Cl A
Leisure-Services
|
$75.49
|
+0.93
1.25% |
$76.71
|
1,121,631
79.04% of 50 DAV
50 DAV is 1,419,000
|
$81.76
-7.67%
|
11/7/2018
|
$57.10
|
PP = $55.45
|
|
MB = $58.22
|
Most Recent Note - 5/23/2019 5:59:05 PM
G - Pulled back today for a 5th consecutive loss after getting very extended from any sound base. Its 50 DMA line ($72.80) and prior low define near-term support. Reported earnings +30% on +23% sales revenues for its first quarter ended March 31, 2019. See the latest FSU analysis for more details and a new annotated graph.
>>> FEATURED STOCK ARTICLE : Pulling Back From High After Impressive Rally - 5/23/2019 |
View all notes |
Set NEW NOTE alert |
Company Profile |
SEC
News |
Chart |
Request a new note
C
A
S
I |
BLD
-
NYSE
Topbuild Corp
Bldg-Constr Prds/Misc
|
$78.40
|
-1.30
-1.63% |
$80.00
|
471,460
149.67% of 50 DAV
50 DAV is 315,000
|
$87.21
-10.10%
|
5/17/2019
|
$82.19
|
PP = $87.31
|
|
MB = $91.68
|
Most Recent Note - 5/23/2019 4:40:59 PM
Y - Encountered distributional pressure after highlighted in the 5/17/19 mid-day report. Subsequent gains above the pivot point backed by at least +40% above average volume may trigger a technical buy signal. Reported earnings +45% on +26% sales revenues for the Mar '19 quarter. Quarterly earnings increases have been above the +25% minimum guideline (C criteria). Annual earnings (A criteria) history has been strong and steady since turning profitable in FY '14.
>>> FEATURED STOCK ARTICLE : Encountered Distributional Pressure Near Prior High - 5/20/2019 |
View all notes |
Set NEW NOTE alert |
Company Profile |
SEC
News |
Chart |
Request a new note
C
A
S
I |
TEAM
-
NASDAQ
Atlassian Corp Plc Cl A
Comp Sftwr-Spec Enterprs
|
$128.45
|
-1.07
-0.83% |
$132.87
|
1,224,988
68.05% of 50 DAV
50 DAV is 1,800,000
|
$131.99
-2.68%
|
5/24/2019
|
$129.52
|
PP = $132.09
|
|
MB = $138.69
|
Most Recent Note - 5/24/2019 5:41:53 PM
Y - Color code is changed to yellow after it has formed an advanced "3-weeks tight" base. Subsequent volume-driven gains for new highs may trigger a new (or add-on) technical buy signal. Reported earnings +133% on +38% sales revenues for the Mar '19 quarter, continuing its strong earnings track record. See the latest FSU analysis for more details and a new annotated graph.
>>> FEATURED STOCK ARTICLE : Perched Near All-Time High After "3-Weeks Tight" - 5/24/2019 |
View all notes |
Set NEW NOTE alert |
Company Profile |
SEC
News |
Chart |
Request a new note
C
A
S
I |
GLOB
-
NYSE
Globant SA
Computer-Tech Services
|
$92.85
|
+3.39
3.79% |
$93.50
|
4,404,354
1,850.57% of 50 DAV
50 DAV is 238,000
|
$89.93
3.25%
|
2/15/2019
|
$69.35
|
PP = $70.00
|
|
MB = $73.50
|
Most Recent Note - 5/28/2019 12:48:53 PM
G - Posting yet another gain with above average volume today for a new all-time high, getting more extended from any sound base. Its 50 DMA line ($79.36) defines important support above the prior high ($74). Violations would raise concerns and trigger technical sell signals. Reported earnings +32% on +22% sales revenues for the quarter ended March 31st, 2019 versus the year ago period, continuing its strong earning track record.
>>> FEATURED STOCK ARTICLE : Earnings News Due While Perched Near All-Time High - 5/7/2019 |
View all notes |
Set NEW NOTE alert |
Company Profile |
SEC
News |
Chart |
Request a new note
C
A
S
I |
|
|
|
THESE ARE NOT BUY RECOMMENDATIONS!
Comments contained in the body of this report are technical
opinions only. The material herein has been obtained
from sources believed to be reliable and accurate, however,
its accuracy and completeness cannot be guaranteed.
This site is not an investment advisor, hence it does
not endorse or recommend any securities or other investments.
Any recommendation contained in this report may not
be suitable for all investors and it is not to be deemed
an offer or solicitation on our part with respect to
the purchase or sale of any securities. All trademarks,
service marks and trade names appearing in this report
are the property of their respective owners, and are
likewise used for identification purposes only.
This report is a service available
only to active Paid Premium Members.
You may opt-out of receiving report notifications
at any time. Questions or comments may be submitted
by writing to Premium Membership Services 665 S.E. 10 Street, Suite 201 Deerfield Beach, FL 33441-5634 or by calling 1-800-965-8307
or 954-785-1121.
|
|
|