You are not logged in.
This means you
CAN ONLY VIEW reports that were published prior to Sunday, February 18, 2024.
You
MUST UPGRADE YOUR MEMBERSHIP if you want to see any current reports.
AFTER MARKET UPDATE - WEDNESDAY, MAY 27TH, 2020
Previous After Market Report Next After Market Report >>>
|
|
|
|
DOW |
+553.16 |
25,548.27 |
+2.21% |
|
Volume |
1,134,875,312 |
-1% |
|
Volume |
4,425,513,200 |
+1% |
|
NASDAQ |
+72.14 |
9,412.36 |
+0.77% |
|
Advancers |
2,368 |
82% |
|
Advancers |
2,195 |
67% |
|
S&P 500 |
+44.36 |
3,036.13 |
+1.48% |
|
Decliners |
536 |
18% |
|
Decliners |
1,085 |
33% |
|
Russell 2000 |
+43.28 |
1,436.36 |
+3.11% |
|
52 Wk Highs |
21 |
|
|
52 Wk Highs |
49 |
|
|
S&P 600 |
+31.51 |
837.98 |
+3.91% |
|
52 Wk Lows |
7 |
|
|
52 Wk Lows |
12 |
|
|
 |
Stocks Rose Lifting S&P 500 Index Above 200-Day Average
Kenneth J. Gruneisen - Passed the CAN SLIM® Master's Exam
On Wednesday the Dow Jones Industrial Average rose 553.16, S&P 500 Index rose 44.36, and the Nasdaq Composite rose 72.14. Breadth was positive as advancers led decliners by more than a 4-1 margin on the NYSE and by more than a 2-1 margin on the Nasdaq exchange. The reported volume totals were mixed, slightly lower than the prior session on the NYSE and slightly higher on the Nasdaq exchange. There were 20 high-ranked companies from the Leaders List that hit new 52-week highs and were listed on the BreakOuts Page, versus 50 on the prior session. New 52-week highs totals contracted yet still outnumbered new 52-week lows totals on the NYSE and on the Nasdaq exchange. The major indices are in a confirmed uptrend (M criteria). Any sustainable rally requires a healthy crop of new leaders, so the recent improvement in new highs totals was noted as an encouraging sign. Charts used courtesy of www.stockcharts.com
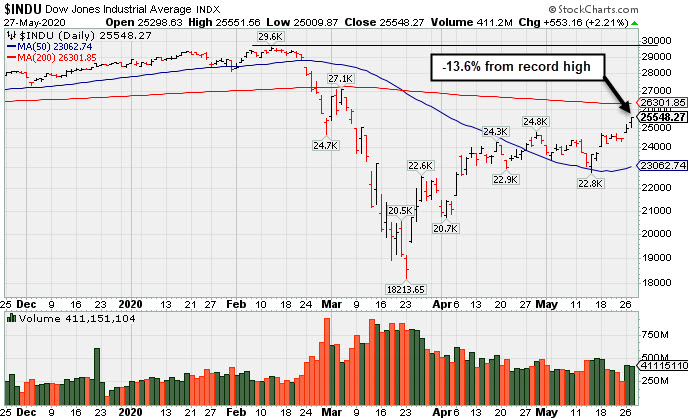
PICTURED: The Dow Jones Industrial Average finished -13.6% off its record high hit on 2/12/20. As it has rebounded from the March lows, it has been lagging behind the other major indices.
Stocks finished higher on Wednesday as economic reopenings continued to fuel hopes for a quick economic recovery. The S&P 500 climbed 1.5%, closing above the 3,000 point mark and its 200-day moving average for the first time since March. The benchmark index is now within 10.4% of its all-time high reached in February, and down just 6% year-to-date. The Dow jumped 553 points, surpassing the 25,000 level, while the small-cap Russell 2000 extended its recent rally, rising 3.1%. The Tech-heavy Nasdaq Composite reversed direction to add 0.8% after Micron Technology (MU +7.97%) forecasted earnings above consensus expectations.
All 11 S&P 500 sectors closed in positive territory, with Financials and Industrials outperforming amid a perceived rotation into more cyclical and value-oriented groups. Retailers that were especially pressured during the coronavirus-inspired rout were also among the standouts. Meanwhile, Tech and Tech-related companies that benefited from the stay at home orders lagged, with Zoom Video Communications (ZM -1.24%) dipping.
Reports of additional stimulus measures aided sentiment, with the Trump Administration reportedly considering proposals to provide unemployed Americans cash as an incentive to return to work. Meanwhile, the European Commission is finalizing an economic recovery fund worth an unprecedented 750 billion euros. In geopolitical news, U.S.-China tensions remained in focus, with Secretary of State Mike Pompeo stating that the U.S. had certified that Hong Kong has lost its political autonomy from China.
Treasuries were little changed, with the yield on the 10-year note steady at 0.68%. In commodities, WTI crude declined 4.5% to $32.81/barrel. |
 Kenneth J. Gruneisen started out as a licensed stockbroker in August 1987, a couple of months prior to the historic stock market crash that took the Dow Jones Industrial Average down -22.6% in a single day. He has published daily fact-based fundamental and technical analysis on high-ranked stocks online for two decades. Through FACTBASEDINVESTING.COM, Kenneth provides educational articles, news, market commentary, and other information regarding proven investment systems that work in good times and bad.
Comments contained in the body of this report are technical opinions only and are not necessarily those of Gruneisen Growth Corp. The material herein has been obtained from sources believed to be reliable and accurate, however, its accuracy and completeness cannot be guaranteed. Our firm, employees, and customers may effect transactions, including transactions contrary to any recommendation herein, or have positions in the securities mentioned herein or options with respect thereto. Any recommendation contained in this report may not be suitable for all investors and it is not to be deemed an offer or solicitation on our part with respect to the purchase or sale of any securities. |
|
 |
Financial, Energy, Tech, and Retail Indexes Rose
Kenneth J. Gruneisen - Passed the CAN SLIM® Master's Exam
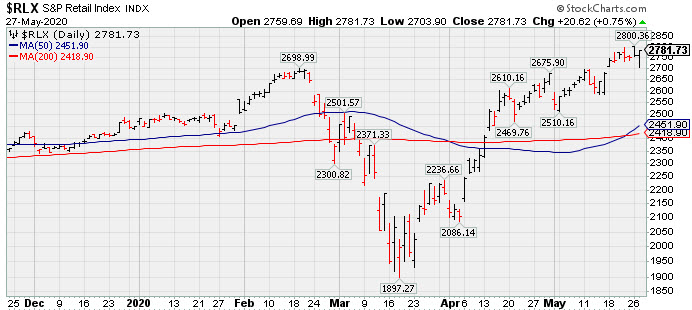
The Bank Index ($BKX +6.68%) and the Broker/Dealer Index ($XBD +5.12%) both posted standout gains on Wednesday. The tech sector had a positive bias as the Semiconductor Index ($SOX +1.47%) and Networking Index ($NWX +1.99%) both outpaced the Biotech Index ($BTK +0.44%). Energy-linked groups also had a positive bias as the Oil Services Index ($OSX +3.99%) and Integrated Oil Index ($XOI +1.31%) both rose. Gold & Silver Index ($XAU -0.21%) edged lower, making it a standout decliner. PICTURED: The Retail Index ($RLX +0.75%) finished modestly higher, perched near its all-time high.
| Oil Services |
$OSX |
33.23 |
+1.27 |
+3.97% |
-57.56% |
| Integrated Oil |
$XOI |
817.40 |
+10.58 |
+1.31% |
-35.67% |
| Semiconductor |
$SOX |
1,847.31 |
+26.80 |
+1.47% |
-0.12% |
| Networking |
$NWX |
547.58 |
+10.68 |
+1.99% |
-6.14% |
| Broker/Dealer |
$XBD |
269.21 |
+13.10 |
+5.12% |
-7.29% |
| Retail |
$RLX |
2,781.73 |
+20.62 |
+0.75% |
+13.57% |
| Gold & Silver |
$XAU |
118.63 |
-0.25 |
-0.21% |
+10.95% |
| Bank |
$BKX |
78.80 |
+4.94 |
+6.69% |
-30.49% |
| Biotech |
$BTK |
5,572.87 |
+24.35 |
+0.44% |
+9.97% |
|
|
|
 |
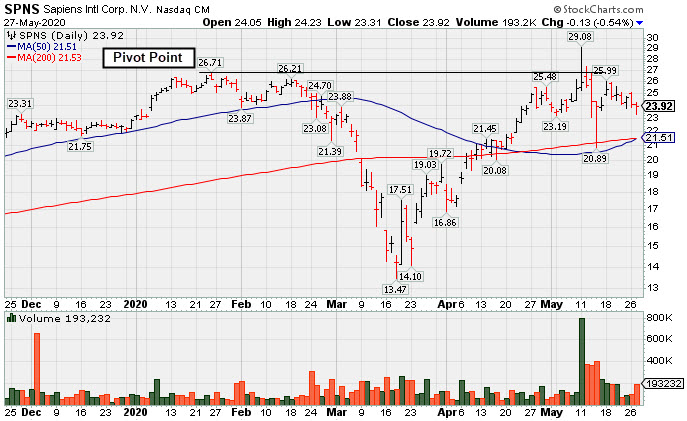
Stalled After Quarter Missed Investment System's Minimum Guideline
Kenneth J. Gruneisen - Passed the CAN SLIM® Master's Exam
Sapiens Intl Corp (SPNS -$0.13 or -0.54% to $23.92) pulled back today with +27% above average volume. It encountered distributional pressure recently, yet found prompt support at its 200 DMA line.
Recently the company reported Mar '20 quarterly earnings +18% on +18% sales revenues versus the year ago period, below the +25% minimum guideline (C criteria), raising fundamental concerns. SPNS was highlighted in yellow with pivot point cited based on its 1/24/20 high plus 10 cents in the 5/11/20 mid-day report (read here). It powered to a new 52-week high with a big volume-driven gain, but it erased much of the early gain and ended in the lower third of its intra-day range, an indication that it was encountering distributional pressure. It failed to produce subsequent gains above the pivot point backed by at least +40% above average volume to clinch a convincing technical buy signal.
SPNS was last shown in this FSU section on 5/11/20 with an annotated graph under the headline, "Encountered Distributional Pressure After Hitting New High". Through the Dec '19 quarter it had posted 5 consecutive quarterly comparisons above the +25% minimum guideline (C criteria). This Israel-based Computer - Tech Services firm's annual earnings (A criteria) history included a downturn in FY '17, a noted fundamental flaw, however, it has a 91 Earnings Per Share rating.
There is a small supply of only 50.2 million shares outstanding (S criteria) which can contribute to greater price volatility in the event of institutional buying or selling. The number of top-rated funds owning its shares rose from 104 in Jun '19 to 126 in Mar '20, a reassuring sign concerning the I criteria. It has a Timeliness Rating of B and an Accumulation/Distribution Rating of C+. |
|
|
Color Codes Explained :
Y - Better candidates highlighted by our
staff of experts.
G - Previously featured
in past reports as yellow but may no longer be buyable under the
guidelines.
***Last / Change / Volume data in this table is the closing quote data***
Symbol/Exchange
Company Name
Industry Group |
PRICE |
CHANGE
(%Change) |
Day High |
Volume
(% DAV)
(% 50 day avg vol) |
52 Wk Hi
% From Hi |
Featured
Date |
Price
Featured |
Pivot Featured |
|
Max Buy |
 FTNT
-
NASDAQ
FTNT
-
NASDAQ
Fortinet Inc
Computer Sftwr-Security
|
$131.15
|
-6.38
-4.64% |
$138.36
|
3,342,958
143.17% of 50 DAV
50 DAV is 2,335,000
|
$149.69
-12.39%
|
5/7/2020
|
$134.40
|
PP = $121.92
|
|
MB = $128.02
|
 Most Recent Note - 5/27/2020 5:42:30 PM
G - Volume was above average behind today's 4th consecutive loss while slumping near its "max buy" level intra-day. Prior highs in the $121 area define initial support to watch.
>>> FEATURED STOCK ARTICLE : Extended From Prior Base and Holding Ground Stubbornly - 5/22/2020 |
View all notes |
Set NEW NOTE alert |
Company Profile |
SEC
News |
Chart |
Request a new note
C
A
S
I |
SPNS
-
NASDAQ
Sapiens Intl Corp
COMPUTER SOFTWARE and SERVICES - Technical and System Software
|
$23.92
|
-0.13
-0.54% |
$24.23
|
193,232
127.13% of 50 DAV
50 DAV is 152,000
|
$29.24
-18.19%
|
5/11/2020
|
$27.80
|
PP = $26.96
|
|
MB = $28.31
|
Most Recent Note - 5/27/2020 5:35:00 PM
G - Pulled back today with +27% above average volume. Encountered distributional pressure recently, yet found prompt support at its 200 DMA line. Recently reported Mar '20 quarterly earnings +18% on +18% sales revenues versus the year ago period, below the +25% minimum guideline (C criteria), raising fundamental concerns. See the latest FSU analysis for more details and a new annotated graph.
>>> FEATURED STOCK ARTICLE : Encountered Distributional Pressure After Hitting New High - 5/11/2020 |
View all notes |
Set NEW NOTE alert |
Company Profile |
SEC
News |
Chart |
Request a new note
C
A
S
I |
EBS
-
NYSE
Emergent Biosolutions
DRUGS - Biotechnology
|
$84.13
|
+0.12
0.14% |
$84.20
|
781,851
144.52% of 50 DAV
50 DAV is 541,000
|
$90.00
-6.52%
|
4/24/2020
|
$72.10
|
PP = $73.99
|
|
MB = $77.69
|
Most Recent Note - 5/27/2020 5:40:23 PM
G - Managed an impressive "positive reversal" for a small gain today with above average volume after undercutting the 20-day moving average ($81.81). It is extended from the previously noted base. Prior highs in the $71-73 area define initial support to watch on pullbacks. Fundamentals remain strong. See the latest FSU analysis for more details and an annotated graph.
>>> FEATURED STOCK ARTICLE : Volume Light Behind Recent Pullback From All-Time High - 5/26/2020 |
View all notes |
Set NEW NOTE alert |
Company Profile |
SEC
News |
Chart |
Request a new note
C
A
S
I |
NBIX
-
NASDAQ
Neurocrine Biosciences
DRUGS - Biotechnology
|
$119.11
|
+0.22
0.19% |
$119.59
|
1,222,484
160.01% of 50 DAV
50 DAV is 764,000
|
$128.29
-7.16%
|
5/19/2020
|
$123.71
|
PP = $119.75
|
|
MB = $125.74
|
Most Recent Note - 5/27/2020 5:46:57 PM
Y - Managed a "positive reversal" for a small gain today with above average volume. Its pullback negated the recent breakout by closing back below the pivot point, raising some concerns. Recent quarterly comparisons through Mar '20 showed greatly improved sales revenues and earnings increases versus year ago periods (C criteria). After years of losses it reported solid annual earnings (A criteria) in FY '18 and '19.
>>> FEATURED STOCK ARTICLE : Biotech Firm Has New Parkinson's Treatment Drug Approved by FDA - 5/19/2020 |
View all notes |
Set NEW NOTE alert |
Company Profile |
SEC
News |
Chart |
Request a new note
C
A
S
I |
TREX
-
NYSE
Trex Company Inc
MATERIALS and CONSTRUCTION - General Building Materials
|
$125.71
|
-2.29
-1.79% |
$130.03
|
859,880
82.05% of 50 DAV
50 DAV is 1,048,000
|
$132.84
-5.37%
|
5/5/2020
|
$109.05
|
PP = $111.95
|
|
MB = $117.55
|
Most Recent Note - 5/27/2020 5:56:58 PM
G - Pulled back with light volume today after hitting new all-time highs with 4 consecutive gains. Recent gains above the pivot point lacked the great volume conviction indicative of institutional demand. Prior highs in the $111 area define initial support to watch on pullbacks. Fundamentals remain strong.
>>> FEATURED STOCK ARTICLE : Bullish Action Continues for Top Wood Alternative Firm - 5/20/2020 |
View all notes |
Set NEW NOTE alert |
Company Profile |
SEC
News |
Chart |
Request a new note
C
A
S
I |
Symbol/Exchange
Company Name
Industry Group |
PRICE |
CHANGE
(%Change) |
Day High |
Volume
(% DAV)
(% 50 day avg vol) |
52 Wk Hi
% From Hi |
Featured
Date |
Price
Featured |
Pivot Featured |
|
Max Buy |
NFLX
-
NASDAQ
Netflix Inc
SPECIALTY RETAIL - Music and Video Stores
|
$419.89
|
+5.12
1.23% |
$420.02
|
10,411,772
113.06% of 50 DAV
50 DAV is 9,209,000
|
$458.97
-8.51%
|
5/14/2020
|
$441.95
|
PP = $449.62
|
|
MB = $472.10
|
Most Recent Note - 5/27/2020 5:49:47 PM
Y - Managed a "positive reversal" for a gain today backed by above average volume, breaking a streak of 6 consecutive losses with below average volume. Found prompt support near its 50 DMA line ($403) which defines support above prior highs in the $393 area. A rebound and subsequent gains above the pivot point must be backed by at least +40% above average volume to trigger a proper new (or add-on) technical buy signal. Fundamentals remain strong.
>>> FEATURED STOCK ARTICLE : Pulling Back After Brief New Base Formation - 5/21/2020 |
View all notes |
Set NEW NOTE alert |
Company Profile |
SEC
News |
Chart |
Request a new note
C
A
S
I |
NOW
-
NYSE
Servicenow Inc
Computer Sftwr-Enterprse
|
$371.16
|
-9.51
-2.50% |
$378.05
|
3,742,154
144.88% of 50 DAV
50 DAV is 2,583,000
|
$396.15
-6.31%
|
4/30/2020
|
$343.05
|
PP = $363.05
|
|
MB = $381.20
|
Most Recent Note - 5/27/2020 5:53:29 PM
Y - Suffered a loss with above average volume yet finished in the upper third of its intra-day range today. There was a "negative reversal" on the prior session at its all-time high. Color code was changed to yellow after retreating below the "max buy" level. Recent gains above the pivot point were not backed by the +40% above average volume necessary to clinch a proper technical buy signal. Prior highs in the $362 area define initial support to watch on pullbacks.
>>> FEATURED STOCK ARTICLE : Consolidating Near Prior High After Wedging Into New High Ground - 5/14/2020 |
View all notes |
Set NEW NOTE alert |
Company Profile |
SEC
News |
Chart |
Request a new note
C
A
S
I |
QLYS
-
NASDAQ
Qualys Inc
Computer Sftwr-Security
|
$112.79
|
-4.53
-3.86% |
$117.49
|
703,689
121.12% of 50 DAV
50 DAV is 581,000
|
$117.54
-4.04%
|
4/9/2020
|
$100.44
|
PP = $97.22
|
|
MB = $102.08
|
Most Recent Note - 5/27/2020 5:55:22 PM
G - Pulled back with +21% above average volume today, retreating from a new all-time high quietly hit on the prior session. Prior highs in the $97 area recently acted as support. Fundamentals remain strong.
>>> FEATURED STOCK ARTICLE : Quiet Pullback Just Below "Max Buy" Level - 5/13/2020 |
View all notes |
Set NEW NOTE alert |
Company Profile |
SEC
News |
Chart |
Request a new note
C
A
S
I |
TEAM
-
NASDAQ
Atlassian Corp Plc Cl A
Comp Sftwr-Spec Enterprs
|
$175.31
|
+2.25
1.30% |
$175.72
|
3,890,601
199.11% of 50 DAV
50 DAV is 1,954,000
|
$190.21
-7.83%
|
5/4/2020
|
$159.70
|
PP = $156.22
|
|
MB = $164.03
|
Most Recent Note - 5/27/2020 2:44:34 PM
G - Briefly dipped below the "max buy" level at the session's early low. Prior highs in the $156 area define initial support to watch.
>>> FEATURED STOCK ARTICLE : Pullback on Lighter Volume After Gain For New High on Big Volume - 5/18/2020 |
View all notes |
Set NEW NOTE alert |
Company Profile |
SEC
News |
Chart |
Request a new note
C
A
S
I |
AAXN
-
NASDAQ
Axon Enterprise Inc
Security/Sfty
|
$75.70
|
-0.10
-0.13% |
$76.79
|
681,322
84.74% of 50 DAV
50 DAV is 804,000
|
$90.10
-15.98%
|
5/8/2020
|
$84.86
|
PP = $90.20
|
|
MB = $94.71
|
Most Recent Note - 5/27/2020 5:37:37 PM
Y - Tested its 50 DMA line ($71.69) today yet rebounded to finish little changed. A rebound and subsequent volume-driven gains above the pivot point are still needed to trigger a technical buy signal.
>>> FEATURED STOCK ARTICLE : Security/Safety Firm Perched Near 52-Week High After Gap Up - 5/12/2020 |
View all notes |
Set NEW NOTE alert |
Company Profile |
SEC
News |
Chart |
Request a new note
C
A
S
I |
Symbol/Exchange
Company Name
Industry Group |
PRICE |
CHANGE
(%Change) |
Day High |
Volume
(% DAV)
(% 50 day avg vol) |
52 Wk Hi
% From Hi |
Featured
Date |
Price
Featured |
Pivot Featured |
|
Max Buy |
|
|
|
THESE ARE NOT BUY RECOMMENDATIONS!
Comments contained in the body of this report are technical
opinions only. The material herein has been obtained
from sources believed to be reliable and accurate, however,
its accuracy and completeness cannot be guaranteed.
This site is not an investment advisor, hence it does
not endorse or recommend any securities or other investments.
Any recommendation contained in this report may not
be suitable for all investors and it is not to be deemed
an offer or solicitation on our part with respect to
the purchase or sale of any securities. All trademarks,
service marks and trade names appearing in this report
are the property of their respective owners, and are
likewise used for identification purposes only.
This report is a service available
only to active Paid Premium Members.
You may opt-out of receiving report notifications
at any time. Questions or comments may be submitted
by writing to Premium Membership Services 665 S.E. 10 Street, Suite 201 Deerfield Beach, FL 33441-5634 or by calling 1-800-965-8307
or 954-785-1121.
|
|
|