You are not logged in.
This means you
CAN ONLY VIEW reports that were published prior to Sunday, February 25, 2024.
You
MUST UPGRADE YOUR MEMBERSHIP if you want to see any current reports.
AFTER MARKET UPDATE - TUESDAY, MAY 26TH, 2020
Previous After Market Report Next After Market Report >>>
|
|
|
|
DOW |
+529.95 |
24,995.11 |
+2.17% |
|
Volume |
1,142,267,469 |
+59% |
|
Volume |
4,398,631,300 |
+22% |
|
NASDAQ |
+15.63 |
9,340.22 |
+0.17% |
|
Advancers |
2,455 |
84% |
|
Advancers |
2,303 |
71% |
|
S&P 500 |
+36.32 |
2,991.77 |
+1.23% |
|
Decliners |
461 |
16% |
|
Decliners |
962 |
29% |
|
Russell 2000 |
+37.54 |
1,393.07 |
+2.77% |
|
52 Wk Highs |
42 |
|
|
52 Wk Highs |
125 |
|
|
S&P 600 |
+31.13 |
806.47 |
+4.02% |
|
52 Wk Lows |
3 |
|
|
52 Wk Lows |
11 |
|
|
 |
Breadth Positive and Leadership Improved as Major Indices Rose
Kenneth J. Gruneisen - Passed the CAN SLIM® Master's Exam
The S&P 500 advanced 1.2%, briefly surpassing the 3,000 point mark and its 200-day moving average for the first time since early March. The Dow climbed 529 points, while the Nasdaq Composite added just 0.2%. The small-cap Russell 2000 Index surged 2.9%, building onto last week’s 7.8% gain. Breadth was positive as advancers led decliners by more than a 5-1 margin on the NYSE and by more than a 2-1 margin on the Nasdaq exchange. The reported volume totals were higher than the prior session on the NYSE and on the Nasdaq exchange, indicative of greater institutional buying demand. There were 50 high-ranked companies from the Leaders List that hit new 52-week highs and were listed on the BreakOuts Page, versus 22 on the prior session. New 52-week highs totals expanded and easily outnumbered new 52-week lows totals on the NYSE and on the Nasdaq exchange. The major indices are in a confirmed uptrend (M criteria). Any sustainable rally requires a healthy crop of new leaders, so the recent improvement in new highs totals was noted as an encouraging sign. Charts used courtesy of www.stockcharts.com
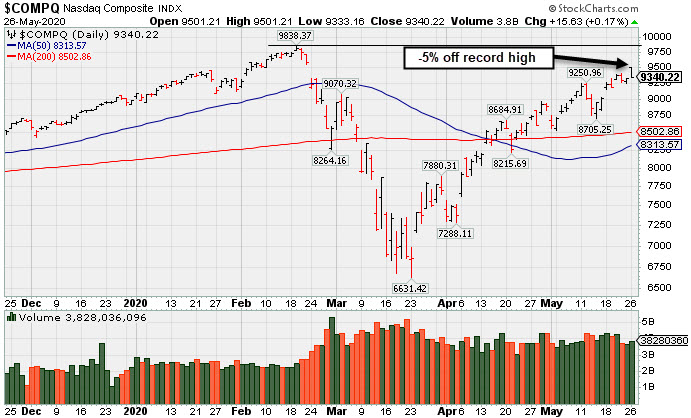
PICTURED: The Nasdaq Composite index finished -5% off its record high hit on 2/19/20. It has rebounded impressively from the March lows, outpacing the other major indices.
Stocks U.S. equities rallied on Tuesday as amid optimism surrounding economic reopenings and COVID-19 vaccine developments. However, ongoing U.S.-China tensions lingered, with stocks paring session gains on fresh reports that Washington was contemplating imposing a range of sanctions on Beijing over plans to implement new national security laws in Hong Kong.
Nine of 11 S&P 500 sectors closed in positive territory, with Health Care and Technology shares lagging. Financials paced gains, with the KBW Bank Index jumping 8.6%. Beleaguered travel-related stocks were also among the standouts, with several airline and cruise line operators posting gains of at least 12.5%. In corporate news, shares of biotech company Novavax (NVAX +4.47%) rose after announcing the start of its first human coronavirus vaccine trial, while Merck (MRK +1.17%) also advanced on plans to develop two separate vaccines.
Perceived safe haven assets declined, with the yield on the 10-year note up two basis points to 0.68%. COMEX gold lost 1.8% to $1,704.80/ounce, while a gauge of the U.S. dollar slumped 0.9%. In commodities, WTI crude climbed to its highest level since March 10, now up more than 80% month-to-date.
On the data front, the Conference Board’s gauge of consumer confidence improved slightly in May from the prior month’s downwardly revised figure. Separately, new home sales unexpectedly increased in April. |
 Kenneth J. Gruneisen started out as a licensed stockbroker in August 1987, a couple of months prior to the historic stock market crash that took the Dow Jones Industrial Average down -22.6% in a single day. He has published daily fact-based fundamental and technical analysis on high-ranked stocks online for two decades. Through FACTBASEDINVESTING.COM, Kenneth provides educational articles, news, market commentary, and other information regarding proven investment systems that work in good times and bad.
Comments contained in the body of this report are technical opinions only and are not necessarily those of Gruneisen Growth Corp. The material herein has been obtained from sources believed to be reliable and accurate, however, its accuracy and completeness cannot be guaranteed. Our firm, employees, and customers may effect transactions, including transactions contrary to any recommendation herein, or have positions in the securities mentioned herein or options with respect thereto. Any recommendation contained in this report may not be suitable for all investors and it is not to be deemed an offer or solicitation on our part with respect to the purchase or sale of any securities. |
|
 |
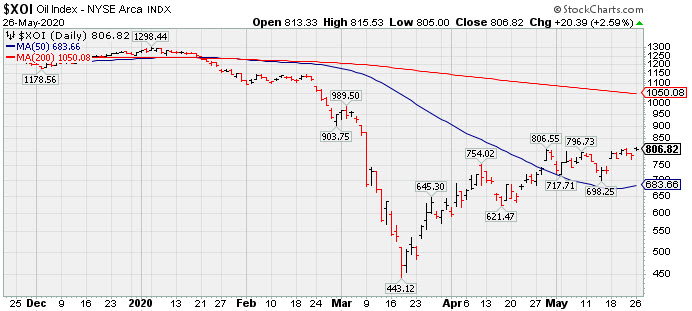
Financial, Energy, Networking, and Semiconductor Indexes Rose
Kenneth J. Gruneisen - Passed the CAN SLIM® Master's Exam
The Bank Index ($BKX +8.62%) and the Broker/Dealer Index ($XBD +5.74%) both posted standout gains on Tuesday. The Retail Index ($RLX +0.40%) finished modestly higher. The tech sector was mixed as the Semiconductor Index ($SOX +1.01%) and Networking Index ($NWX +1.73%) both rose but the Biotech Index ($BTK -1.31%) lost ground. Energy-linked groups had a positive bias as the Oil Services Index ($OSX +5.27%) and Integrated Oil Index ($XOI +2.59%) both rose. Gold & Silver Index ($XAU -4.31%) was a standout decliner. PICTURED: The Integrated Oil Index ($XOI +2.59%) posted a gain, yet it remains well below its 200-day moving average (DMA) line while rebounding from the March lows.
| Oil Services |
$OSX |
31.96 |
+1.60 |
+5.27% |
-59.18% |
| Integrated Oil |
$XOI |
806.82 |
+20.39 |
+2.59% |
-36.50% |
| Semiconductor |
$SOX |
1,820.51 |
+18.20 |
+1.01% |
-1.57% |
| Networking |
$NWX |
536.90 |
+9.15 |
+1.73% |
-7.97% |
| Broker/Dealer |
$XBD |
256.11 |
+13.91 |
+5.74% |
-11.80% |
| Retail |
$RLX |
2,761.11 |
+10.97 |
+0.40% |
+12.73% |
| Gold & Silver |
$XAU |
118.88 |
-5.36 |
-4.31% |
+11.19% |
| Bank |
$BKX |
73.86 |
+5.86 |
+8.62% |
-34.84% |
| Biotech |
$BTK |
5,548.48 |
-73.42 |
-1.31% |
+9.49% |
|
|
|
 |
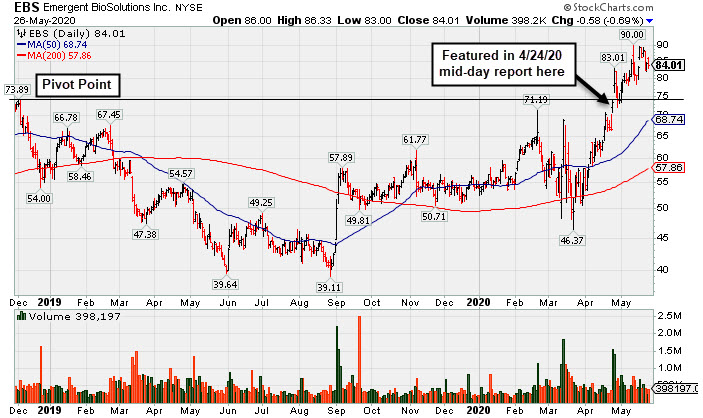
Volume Light Behind Recent Pullback From All-Time High
Kenneth J. Gruneisen - Passed the CAN SLIM® Master's Exam
Emergent Biosolutions (EBS -$0.58 or -0.69% to $84.01) has been pulling back from its all-time high with recent losses backed by below average volume. It is extended from the previously noted base. Prior highs in the $71-73 area define initial support to watch on pullbacks. Fundamentals remain strong.
EBS finished strong after highlighted in yellow with pivot point cited based on its December 2018 high in the 4/24/20 mid-day report (read here). It gapped up hitting a new 52-week high and touched a new all-time high (N criteria). Subsequent gains and strong close above the pivot point backed by more than +40% above average volume clinched a convincing technical buy signal (see the annotated graph below).
EBS was last shown in this FSU section on 5/08/20 with an annotated graph under the headline, "Light Volume Gain for New High Close Caps 7th Straight Weekly Gain". It currently has a 90 Earnings Per Share Rating, putting it in the top 10% of all publicly traded companies based on its earnings history. It it reported Mar '20 earnings of 1 cent per share versus a 10 cents per share loss for the year ago period with +1% better sales revenues. Earnings rose +101% on +33% sales revenues for the Dec '19 quarter, and earnings rose +120% on +80% sales revenues in the Sep '19 quarter, very strong quarterly comparisons versus the year ago periods. Annual earnings history (A criteria) has been strong since a downturn in FY '16.
It has a small supply (S criteria) of only 44.9 million shares in the publicly traded float which can contribute to greater price volatility in the event of institutional buying or selling. The number of top-rated funds owning its shares rose from 453 in Sep '19 to 463 in Mar '20, and its current Up/Down Volume Ratio of 1.4 is an unbiased indication its shares have been under accumulation over the past 50 days. It has an A Timeliness rating and an A- Accumulation/Distribution rating. The company is in the Medical - Biomed/Biotech industry group which is a leading group currently ranked 5th out of the 197 industry groups (L criteria). |
|
|
Color Codes Explained :
Y - Better candidates highlighted by our
staff of experts.
G - Previously featured
in past reports as yellow but may no longer be buyable under the
guidelines.
***Last / Change / Volume data in this table is the closing quote data***
Symbol/Exchange
Company Name
Industry Group |
PRICE |
CHANGE
(%Change) |
Day High |
Volume
(% DAV)
(% 50 day avg vol) |
52 Wk Hi
% From Hi |
Featured
Date |
Price
Featured |
Pivot Featured |
|
Max Buy |
 FTNT
-
NASDAQ
FTNT
-
NASDAQ
Fortinet Inc
Computer Sftwr-Security
|
$137.53
|
-5.11
-3.58% |
$145.48
|
2,001,307
85.13% of 50 DAV
50 DAV is 2,351,000
|
$149.69
-8.12%
|
5/7/2020
|
$134.40
|
PP = $121.92
|
|
MB = $128.02
|
 Most Recent Note - 5/26/2020 5:05:17 PM
G - Pulled back from its all-time high with below average volume behind today's 3rd consecutive loss. It is extended from the prior base. Prior highs in the $121 area define initial support to watch.
>>> FEATURED STOCK ARTICLE : Extended From Prior Base and Holding Ground Stubbornly - 5/22/2020 |
View all notes |
Set NEW NOTE alert |
Company Profile |
SEC
News |
Chart |
Request a new note
C
A
S
I |
SPNS
-
NASDAQ
Sapiens Intl Corp
COMPUTER SOFTWARE and SERVICES - Technical and System Software
|
$24.05
|
-0.64
-2.59% |
$25.06
|
99,185
64.83% of 50 DAV
50 DAV is 153,000
|
$29.24
-17.75%
|
5/11/2020
|
$27.80
|
PP = $26.96
|
|
MB = $28.31
|
Most Recent Note - 5/26/2020 5:13:25 PM
G - Pulled back today with light volume. Encountered distributional pressure recently, yet found prompt support at its 200 DMA line. Recently reported Mar '20 quarterly earnings +18% on +18% sales revenues versus the year ago period, below the +25% minimum guideline (C criteria), raising fundamental concerns. It slumped after highlighted in the 5/11/20 mid-day report with pivot point cited based on its 1/24/20 high plus 10 cents.
>>> FEATURED STOCK ARTICLE : Encountered Distributional Pressure After Hitting New High - 5/11/2020 |
View all notes |
Set NEW NOTE alert |
Company Profile |
SEC
News |
Chart |
Request a new note
C
A
S
I |
EBS
-
NYSE
Emergent Biosolutions
DRUGS - Biotechnology
|
$84.01
|
-0.58
-0.69% |
$86.33
|
397,897
69.93% of 50 DAV
50 DAV is 569,000
|
$90.00
-6.66%
|
4/24/2020
|
$72.10
|
PP = $73.99
|
|
MB = $77.69
|
Most Recent Note - 5/26/2020 5:18:19 PM
G - Pulled back again today with below average volume. It is extended from the previously noted base. Prior highs in the $71-73 area define initial support to watch on pullbacks. Fundamentals remain strong. See the latest FSU analysis for more details and a new annotated graph.
>>> FEATURED STOCK ARTICLE : Volume Light Behind Recent Pullback From All-Time High - 5/26/2020 |
View all notes |
Set NEW NOTE alert |
Company Profile |
SEC
News |
Chart |
Request a new note
C
A
S
I |
NBIX
-
NASDAQ
Neurocrine Biosciences
DRUGS - Biotechnology
|
$118.89
|
-5.91
-4.74% |
$128.29
|
1,186,699
135.78% of 50 DAV
50 DAV is 874,000
|
$127.28
-6.59%
|
5/19/2020
|
$123.71
|
PP = $119.75
|
|
MB = $125.74
|
Most Recent Note - 5/26/2020 5:07:57 PM
Y - There was a "negative reversal" for a loss with above average volume after hitting another new all-time high today. Negated the recent breakout by closing back below the pivot point, raising some concerns. Recent quarterly comparisons through Mar '20 showed greatly improved sales revenues and earnings increases versus year ago periods (C criteria). After years of losses it reported solid annual earnings (A criteria) in FY '18 and '19.
>>> FEATURED STOCK ARTICLE : Biotech Firm Has New Parkinson's Treatment Drug Approved by FDA - 5/19/2020 |
View all notes |
Set NEW NOTE alert |
Company Profile |
SEC
News |
Chart |
Request a new note
C
A
S
I |
TREX
-
NYSE
Trex Company Inc
MATERIALS and CONSTRUCTION - General Building Materials
|
$128.00
|
+0.29
0.23% |
$132.84
|
1,117,446
106.73% of 50 DAV
50 DAV is 1,047,000
|
$127.87
0.10%
|
5/5/2020
|
$109.05
|
PP = $111.95
|
|
MB = $117.55
|
Most Recent Note - 5/22/2020 5:13:49 PM
G - Posted a gain with light volume today for another new all-time high. Recent gains above the pivot point lacked the great volume conviction indicative of institutional demand. Prior highs in the $111 area define initial support to watch on pullbacks. Fundamentals remain strong.
>>> FEATURED STOCK ARTICLE : Bullish Action Continues for Top Wood Alternative Firm - 5/20/2020 |
View all notes |
Set NEW NOTE alert |
Company Profile |
SEC
News |
Chart |
Request a new note
C
A
S
I |
Symbol/Exchange
Company Name
Industry Group |
PRICE |
CHANGE
(%Change) |
Day High |
Volume
(% DAV)
(% 50 day avg vol) |
52 Wk Hi
% From Hi |
Featured
Date |
Price
Featured |
Pivot Featured |
|
Max Buy |
NFLX
-
NASDAQ
Netflix Inc
SPECIALTY RETAIL - Music and Video Stores
|
$414.77
|
-14.55
-3.39% |
$428.50
|
7,804,351
84.45% of 50 DAV
50 DAV is 9,241,000
|
$458.97
-9.63%
|
5/14/2020
|
$441.95
|
PP = $449.62
|
|
MB = $472.10
|
Most Recent Note - 5/26/2020 5:09:19 PM
Y - Pulled back today for a 6th consecutive loss with below average volume. A rebound and subsequent gains above the pivot point must be backed by at least +40% above average volume to trigger a proper new (or add-on) technical buy signal. Its 50 DMA line ($400.58) defines support above prior highs in the $393 area which acted as support following the recent breakout. Fundamentals remain strong.
>>> FEATURED STOCK ARTICLE : Pulling Back After Brief New Base Formation - 5/21/2020 |
View all notes |
Set NEW NOTE alert |
Company Profile |
SEC
News |
Chart |
Request a new note
C
A
S
I |
NOW
-
NYSE
Servicenow Inc
Computer Sftwr-Enterprse
|
$380.67
|
-7.29
-1.88% |
$396.15
|
1,713,877
65.67% of 50 DAV
50 DAV is 2,610,000
|
$394.76
-3.57%
|
4/30/2020
|
$343.05
|
PP = $363.05
|
|
MB = $381.20
|
Most Recent Note - 5/26/2020 5:10:50 PM
G - Touched a new high but reversed into the red today. Recent gains above the pivot point were not backed by the +40% above average volume necessary to clinch a proper technical buy signal. Prior highs in the $362 area define initial support to watch on pullbacks.
>>> FEATURED STOCK ARTICLE : Consolidating Near Prior High After Wedging Into New High Ground - 5/14/2020 |
View all notes |
Set NEW NOTE alert |
Company Profile |
SEC
News |
Chart |
Request a new note
C
A
S
I |
QLYS
-
NASDAQ
Qualys Inc
Computer Sftwr-Security
|
$117.32
|
+5.32
4.75% |
$117.54
|
619,700
107.21% of 50 DAV
50 DAV is 578,000
|
$113.02
3.80%
|
4/9/2020
|
$100.44
|
PP = $97.22
|
|
MB = $102.08
|
Most Recent Note - 5/26/2020 5:12:26 PM
G - Powered to a new all-time high and finished strong with today's big gain backed by higher (near average) volume. Prior highs in the $97 area recently acted as support. Fundamentals remain strong.
>>> FEATURED STOCK ARTICLE : Quiet Pullback Just Below "Max Buy" Level - 5/13/2020 |
View all notes |
Set NEW NOTE alert |
Company Profile |
SEC
News |
Chart |
Request a new note
C
A
S
I |
TEAM
-
NASDAQ
Atlassian Corp Plc Cl A
Comp Sftwr-Spec Enterprs
|
$173.06
|
-9.54
-5.22% |
$184.62
|
2,231,105
113.43% of 50 DAV
50 DAV is 1,967,000
|
$190.21
-9.02%
|
5/4/2020
|
$159.70
|
PP = $156.22
|
|
MB = $164.03
|
Most Recent Note - 5/26/2020 5:03:08 PM
G - Pulled back for a big loss with higher (slightly above average) volume today. It has been repeatedly noted as extended from the previously noted base, and prior highs in the $156 area define initial support to watch on pullbacks.
>>> FEATURED STOCK ARTICLE : Pullback on Lighter Volume After Gain For New High on Big Volume - 5/18/2020 |
View all notes |
Set NEW NOTE alert |
Company Profile |
SEC
News |
Chart |
Request a new note
C
A
S
I |
AAXN
-
NASDAQ
Axon Enterprise Inc
Security/Sfty
|
$75.80
|
+1.69
2.28% |
$76.79
|
503,106
61.81% of 50 DAV
50 DAV is 814,000
|
$90.10
-15.87%
|
5/8/2020
|
$84.86
|
PP = $90.20
|
|
MB = $94.71
|
Most Recent Note - 5/22/2020 5:12:27 PM
Y - Pulled back today testing recent lows with a loss on light volume. A rebound and subsequent volume-driven gains above the pivot point are still needed to trigger a technical buy signal.
>>> FEATURED STOCK ARTICLE : Security/Safety Firm Perched Near 52-Week High After Gap Up - 5/12/2020 |
View all notes |
Set NEW NOTE alert |
Company Profile |
SEC
News |
Chart |
Request a new note
C
A
S
I |
Symbol/Exchange
Company Name
Industry Group |
PRICE |
CHANGE
(%Change) |
Day High |
Volume
(% DAV)
(% 50 day avg vol) |
52 Wk Hi
% From Hi |
Featured
Date |
Price
Featured |
Pivot Featured |
|
Max Buy |
|
|
|
THESE ARE NOT BUY RECOMMENDATIONS!
Comments contained in the body of this report are technical
opinions only. The material herein has been obtained
from sources believed to be reliable and accurate, however,
its accuracy and completeness cannot be guaranteed.
This site is not an investment advisor, hence it does
not endorse or recommend any securities or other investments.
Any recommendation contained in this report may not
be suitable for all investors and it is not to be deemed
an offer or solicitation on our part with respect to
the purchase or sale of any securities. All trademarks,
service marks and trade names appearing in this report
are the property of their respective owners, and are
likewise used for identification purposes only.
This report is a service available
only to active Paid Premium Members.
You may opt-out of receiving report notifications
at any time. Questions or comments may be submitted
by writing to Premium Membership Services 665 S.E. 10 Street, Suite 201 Deerfield Beach, FL 33441-5634 or by calling 1-800-965-8307
or 954-785-1121.
|
|
|