You are not logged in.
This means you
CAN ONLY VIEW reports that were published prior to Friday, February 16, 2024.
You
MUST UPGRADE YOUR MEMBERSHIP if you want to see any current reports.
AFTER MARKET UPDATE - WEDNESDAY, MAY 25TH, 2022
Previous After Market Report Next After Market Report >>>
|
|
|
|
DOW |
+191.66 |
32,120.28 |
+0.60% |
|
Volume |
1,027,141,729 |
+1% |
|
Volume |
4,453,130,900 |
-5% |
|
NASDAQ |
+170.29 |
11,434.74 |
+1.51% |
|
Advancers |
2,424 |
78% |
|
Advancers |
2,929 |
68% |
|
S&P 500 |
+37.25 |
3,978.73 |
+0.95% |
|
Decliners |
667 |
22% |
|
Decliners |
1,392 |
32% |
|
Russell 2000 |
+34.34 |
1,799.16 |
+1.95% |
|
52 Wk Highs |
47 |
|
|
52 Wk Highs |
35 |
|
|
S&P 600 |
+24.01 |
1,195.42 |
+2.05% |
|
52 Wk Lows |
82 |
|
|
52 Wk Lows |
307 |
|
|
The market remains in a correction (M criteria). New buying efforts should be avoided until a solid follow-through day shows more decisive strength returning.
|
 |
Major Indices Rose Without Great Volume Conviction
Kenneth J. Gruneisen - Passed the CAN SLIM® Master's Exam
The Dow added 191 points, while the S&P 500 advanced 1%. The Nasdaq Composite climbed 1.5% as growth-oriented shares outperformed. Volume totals reported were mixed, higher than the prior session on the NYSE and lighter on the Nasdaq exchange. Breadth was positive as advancers led decliners by almost a 4-1 margin on the NYSE and by more than 2-1 on the Nasdaq exchange. There were 23 high-ranked companies from the Leaders List that hit new 52-week highs and were listed on the BreakOuts Page, versus 14 on the prior session. New 52-week lows totals still outnumbered new 52-week highs totals on both the NYSE and the Nasdaq exchange. Damaging losses for the major indices recently signaled a continuation of the market correction (M criteria). Followers of the fact-based investment system know to watch for a follow-through day on Day 4-7 of a new rally attempt which could signal a new confirmed uptrend.
Chart courtesy of www.stockcharts.com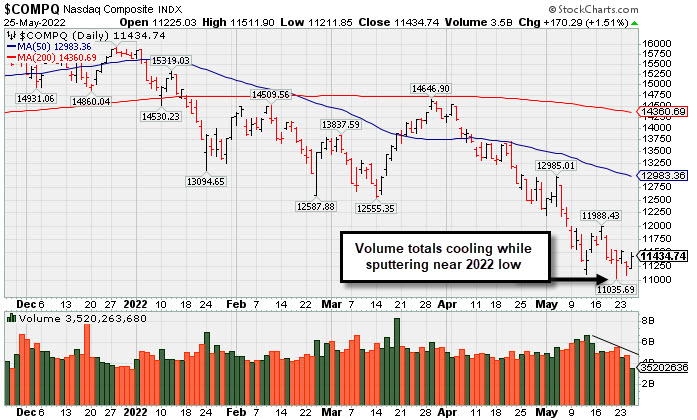 PICTURED: The Nasdaq Composite Index has seen volume totals cooling while sputtering near its 2022 low.
U.S. stocks finished higher in another choppy session Wednesday as Wall Street digested the Federal Reserve’s (Fed) May meeting minutes. Sentiment seemed to be supported by the lack of hawkish surprise. The release reaffirmed that most officials expect to implement two additional 0.50% rate increases during the upcoming June and July meetings. While committee members agreed that more restrictive policy could become appropriate, their aggressive approach to tightening early could leave the central bank “well positioned later this year to assess the effects of policy firming,” offering a potential pause in rate hikes.
Ten of 11 S&P 500 sectors closed in positive territory, with Consumer Discretionary pacing gains. In earnings, Nordstrom Inc. (JWN +14.02%) rose after the high-end department store retailer raised its full-year sales forecast. Shares of Dick’s Sporting Goods Inc.(DKS +9.69%) reversed course to rally despite offering disappointing guidance. Meanwhile, Kohl’s Corp. (KSS +11.89%) rose following a report that bidders were still vying for an acquisition of the company. Elsewhere, luxury home builder Toll Brothers Inc. (TOL +7.97%) rose as evidence of its strong pricing power overshadowed commentary on somewhat moderating demand.
Treasuries were little changed, with the yield on the 10-year note holding steady at 2.76%. On the data front, preliminary April readings showed durable and capital goods orders increased less than expected during the month. Separately, mortgage applications dipped 1.2% in the latest week after declining 11% in the prior period. In commodities, West Texas Intermediate crude gained 0.9% to $110.73/barrel amid a weekly drop in domestic stockpiles.
|
 Kenneth J. Gruneisen started out as a licensed stockbroker in August 1987, a couple of months prior to the historic stock market crash that took the Dow Jones Industrial Average down -22.6% in a single day. He has published daily fact-based fundamental and technical analysis on high-ranked stocks online for two decades. Through FACTBASEDINVESTING.COM, Kenneth provides educational articles, news, market commentary, and other information regarding proven investment systems that work in good times and bad.
Comments contained in the body of this report are technical opinions only and are not necessarily those of Gruneisen Growth Corp. The material herein has been obtained from sources believed to be reliable and accurate, however, its accuracy and completeness cannot be guaranteed. Our firm, employees, and customers may effect transactions, including transactions contrary to any recommendation herein, or have positions in the securities mentioned herein or options with respect thereto. Any recommendation contained in this report may not be suitable for all investors and it is not to be deemed an offer or solicitation on our part with respect to the purchase or sale of any securities. |
|
 |
Retail, Financial, Tech, and Energy-Linked Groups Rose
Kenneth J. Gruneisen - Passed the CAN SLIM® Master's Exam
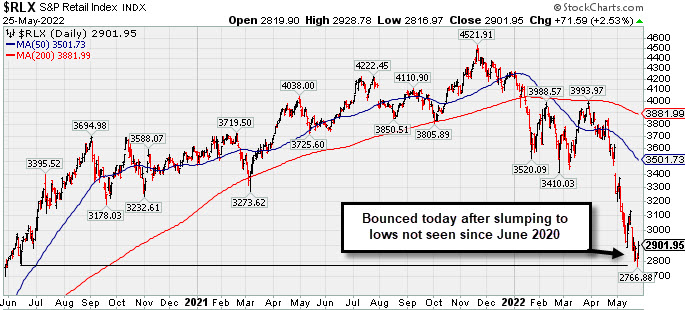
The Retail Index ($RLX +2.53%), Broker/Dealer Index ($XBD +1.46%), and Bank Index ($BKX +1.66%) each posted influential gains. The Semiconductor Index ($SOX +1.98%) led the tech sector higher while the Networking Index ($NWX +1.11%) and Biotech Index ($BTK +0.67%) both posted smaller gains. Commodity-linked groups were mixed as the Oil Services Index ($OSX +1.91%) and Integrated Oil Index ($XOI +2.19%) both posted gains, meanwhile the Gold & Silver Index ($XAU -0.63%) edged lower.
PICTURED: The Retail Index ($RLX +2.53%) bounced on Wednesday after slumping to lows not seen since June 2020.
| Oil Services |
$OSX |
79.58 |
+1.49 |
+1.91% |
+50.95% |
| Integrated Oil |
$XOI |
1,751.56 |
+37.49 |
+2.19% |
+48.66% |
| Semiconductor |
$SOX |
2,882.93 |
+55.88 |
+1.98% |
-26.94% |
| Networking |
$NWX |
724.98 |
+7.94 |
+1.11% |
-25.34% |
| Broker/Dealer |
$XBD |
402.12 |
+5.77 |
+1.46% |
-17.40% |
| Retail |
$RLX |
2,901.95 |
+71.59 |
+2.53% |
-31.34% |
| Gold & Silver |
$XAU |
131.63 |
-0.84 |
-0.63% |
-0.62% |
| Bank |
$BKX |
112.10 |
+1.83 |
+1.66% |
-15.21% |
| Biotech |
$BTK |
4,516.31 |
+30.15 |
+0.67% |
-18.16% |
|
|
|
 |
Consolidating Above 50-Day Moving Average Near All-Time High
Kenneth J. Gruneisen - Passed the CAN SLIM® Master's Exam
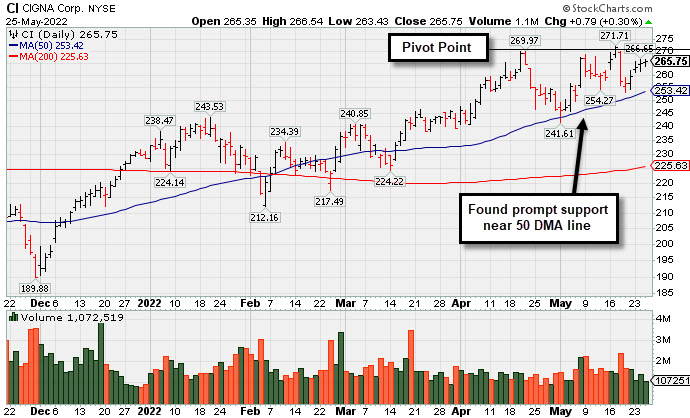
Cigna Corp (CI +$0.79 or +0.30% to $265.75) posted a 4th consecutive small gain today with below average volume. It has been consolidating above its 50-day moving average (DMA) line ($253.41) after challenging its all-time high last week. Subsequent gains above the pivot point backed by at least +40% above average volume may trigger a technical buy signal. Fundamentals remain strong. New buying efforts may only be considered after a solid follow-through day confirms a new market uptrend (M criteria) under the fact-based investment system. Follow this closely in the daily market commentaries
CI was highlighted in yellow in the 5/06/22 mid-day report (read here) with a pivot point cited based on its 4/21/22 high. It was shown in greater detail that evening with an annotated graph under the headline, "Cigna Rises Near All-Time High."
CI has a 95 Earnings Per Share Rating. It reported a strong +27% earnings increase on +7% sales revenues for the Mar '22 quarter versus the year ago period, its 3rd strong quarterly comparison above the +25% minimum guideline (C criteria). Annual earnings growth (A criteria) has been strong.
The number of top-rated funds owning its shares rose from 2,628 in Dec '21 to 2,681 in Mar '22, a reassuring sign concerning the I criteria. The Medical - Managed Care group is currently ranked 27th on the 197 Industry Groups list and has a Group Relative Strength Rating of 86 (A), a reassuring sign concerning the L criteria. |
|
|
Color Codes Explained :
Y - Better candidates highlighted by our
staff of experts.
G - Previously featured
in past reports as yellow but may no longer be buyable under the
guidelines.
***Last / Change / Volume data in this table is the closing quote data***
Symbol/Exchange
Company Name
Industry Group |
PRICE |
CHANGE
(%Change) |
Day High |
Volume
(% DAV)
(% 50 day avg vol) |
52 Wk Hi
% From Hi |
Featured
Date |
Price
Featured |
Pivot Featured |
|
Max Buy |
 CI
-
NYSE
CI
-
NYSE
Cigna Corp
Medical-Managed Care
|
$265.75
|
+0.79
0.30% |
$266.54
|
1,071,016
71.45% of 50 DAV
50 DAV is 1,499,000
|
$271.71
-2.19%
|
5/6/2022
|
$263.52
|
PP = $269.97
|
|
MB = $283.47
|
 Most Recent Note - 5/25/2022 5:17:26 PM
Y - Posted a 4th consecutive small gain today with below average volume, consolidating above its 50 DMA line ($253.41) after challenging its all-time high last week. Subsequent gains above the pivot point backed by at least +40% above average volume may trigger a technical buy signal. Fundamentals remain strong. See the latest FSU analysis for more details and a new annotated graph.
>>> FEATURED STOCK ARTICLE : Consolidating Above 50-Day Moving Average Near All-Time High - 5/25/2022 |
View all notes |
Set NEW NOTE alert |
Company Profile |
SEC
News |
Chart |
Request a new note
C
A
S
I |
PAG
-
NYSE
Penske Automotive Grp
Retail/Whlsle-Automobile
|
$112.31
|
+3.44
3.16% |
$113.30
|
314,759
92.03% of 50 DAV
50 DAV is 342,000
|
$119.47
-5.99%
|
5/13/2022
|
$114.88
|
PP = $114.57
|
|
MB = $120.30
|
Most Recent Note - 5/25/2022 4:41:07 PM
Y - Posted a 3rd consecutive gain with near average volume. Held its ground after completely negating a recent technical breakout. Its 50 DMA line ($103.33) defines near term support to watch.
>>> FEATURED STOCK ARTICLE : Breakout With Volume-Driven Gain to New High - 5/13/2022 |
View all notes |
Set NEW NOTE alert |
Company Profile |
SEC
News |
Chart |
Request a new note
C
A
S
I |
LLY
-
NYSE
Eli Lilly & Co
Medical-Diversified
|
$307.01
|
+1.05
0.34% |
$310.42
|
3,192,382
107.45% of 50 DAV
50 DAV is 2,971,000
|
$314.00
-2.23%
|
5/16/2022
|
$302.46
|
PP = $314.10
|
|
MB = $329.81
|
Most Recent Note - 5/25/2022 4:42:53 PM
Y - Perched within close striking distance of its 52-week high after a 4th consecutive small gain with near average volume. Near its 50 DMA line ($293) it recently found prompt support. Pivot point cited was based on its 4/07/22 high plus 10 cents. Three of the past 4 quarterly comparisons were above the +25% minimum earnings guideline (C criteria).
>>> FEATURED STOCK ARTICLE : Eli Lilly & Co Challenges All-Time High - 5/16/2022 |
View all notes |
Set NEW NOTE alert |
Company Profile |
SEC
News |
Chart |
Request a new note
C
A
S
I |
|
|
|
THESE ARE NOT BUY RECOMMENDATIONS!
Comments contained in the body of this report are technical
opinions only. The material herein has been obtained
from sources believed to be reliable and accurate, however,
its accuracy and completeness cannot be guaranteed.
This site is not an investment advisor, hence it does
not endorse or recommend any securities or other investments.
Any recommendation contained in this report may not
be suitable for all investors and it is not to be deemed
an offer or solicitation on our part with respect to
the purchase or sale of any securities. All trademarks,
service marks and trade names appearing in this report
are the property of their respective owners, and are
likewise used for identification purposes only.
This report is a service available
only to active Paid Premium Members.
You may opt-out of receiving report notifications
at any time. Questions or comments may be submitted
by writing to Premium Membership Services 665 S.E. 10 Street, Suite 201 Deerfield Beach, FL 33441-5634 or by calling 1-800-965-8307
or 954-785-1121.
|
|
|