You are not logged in.
This means you
CAN ONLY VIEW reports that were published prior to Saturday, February 24, 2024.
You
MUST UPGRADE YOUR MEMBERSHIP if you want to see any current reports.
AFTER MARKET UPDATE - FRIDAY, MAY 24TH, 2019
Previous After Market Report Next After Market Report >>>
|
|
|
|
DOW |
+95.22 |
25,585.69 |
+0.37% |
|
Volume |
640,267,180 |
-26% |
|
Volume |
1,679,557,330 |
-26% |
|
NASDAQ |
+8.73 |
7,637.01 |
+0.11% |
|
Advancers |
1,935 |
68% |
|
Advancers |
1,936 |
65% |
|
S&P 500 |
+3.82 |
2,826.06 |
+0.14% |
|
Decliners |
924 |
32% |
|
Decliners |
1,053 |
35% |
|
Russell 2000 |
+12.73 |
1,514.11 |
+0.85% |
|
52 Wk Highs |
120 |
|
|
52 Wk Highs |
54 |
|
|
S&P 600 |
+8.09 |
917.54 |
+0.89% |
|
52 Wk Lows |
86 |
|
|
52 Wk Lows |
107 |
|
|
 |
Major Indices Rose With Light Volume Ahead of Holiday
Kenneth J. Gruneisen - Passed the CAN SLIM® Master's Exam
For the week, the Dow slipped 0.7%, capping its longest weekly losing streak (five weeks) since 2011. The S&P 500 and Nasdaq each recorded their third-straight weekly declines, falling 1.2% and 2.3%, respectively, and marking the longest stretch since December 2018. Stocks finished higher Friday to pare the week’s losses. The S&P 500 and Nasdaq Composite each added 0.1%, while the Dow gained 95 points. The volume totals reported were lighter on the NYSE and on the Nasdaq exchange, revealing lackluster conviction behind institutional buying. Breadth was positive as advancers led decliners by a 2-1 margin on the NYSE and nearly 2-1 on the Nasdaq exchange. There were 32 high-ranked companies from the Leaders List that hit new 52-week highs and were listed on the BreakOuts Page, versus the total of 19 on the prior session. New 52-week highs outnumbered new 52-week lows on the NYSE but new lows outnumbered new highs on the Nasdaq exchange. While the major indices (M criteria) are showing action indicative of a market "correction" the fact-based investment system discourages any new buying efforts and suggests selling stocks on a case-by-case basis, raising cash levels to reduce market exposure. The Featured Stocks Page provides the most timely analysis on high-ranked leaders. Charts used courtesy of www.stockcharts.com
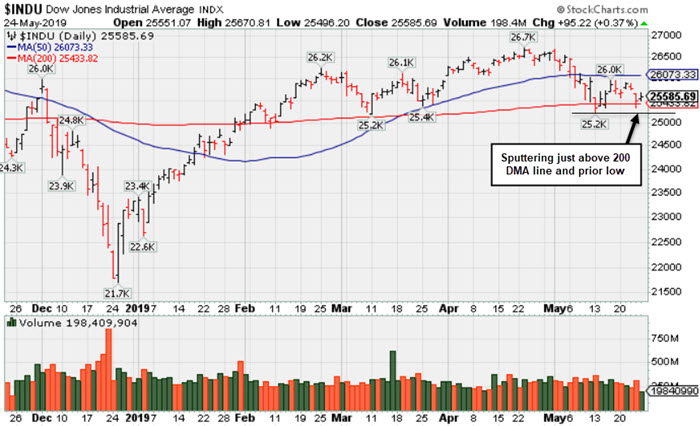
PICTURED: The Dow Jones Industrial Average is sputtering just above its 200-day moving average (DMA) line and prior low. Disciplined investors have been watching for a follow-through day of big gains (more than +1%) from at least one of the major indices backed with higher volume and an expansion in stocks reaching new 52-week highs - all of which are critical components for a new confirmed uptrend under the fact-based system.
In earnings, Hibbett Sports (HIBB +20.89%) gapped up after the sporting goods retailer exceeded Wall Street profit estimates. Shares of HP Inc. (HPQ +4.38%) rose after the software company topped analyst earnings expectations. In other corporate news, Boeing (BA +1.24%) rose on reports that the 737 MAX aircraft could be approved for a return to service as early as late June.
Trade tensions remain in focus, with investor sentiment rising after President Trump said he expects a quick end to the trade dispute. Treasuries weakened Friday ahead of the long holiday weekend. The yield on the 10-year note advanced three basis points to 2.32%. The uptick in rates followed Thursday’s session, in which yields tumbled to the lowest since late 2017 amid a perceived “flight to safety.”
On the data front, a report showed durable goods orders declined more than anticipated in April. In commodities, WTI crude rebounded 1.2% but still notched its worst week of the year amid increasing supply and worries surrounding global demand.
|
 Kenneth J. Gruneisen started out as a licensed stockbroker in August 1987, a couple of months prior to the historic stock market crash that took the Dow Jones Industrial Average down -22.6% in a single day. He has published daily fact-based fundamental and technical analysis on high-ranked stocks online for two decades. Through FACTBASEDINVESTING.COM, Kenneth provides educational articles, news, market commentary, and other information regarding proven investment systems that work in good times and bad.
Comments contained in the body of this report are technical opinions only and are not necessarily those of Gruneisen Growth Corp. The material herein has been obtained from sources believed to be reliable and accurate, however, its accuracy and completeness cannot be guaranteed. Our firm, employees, and customers may effect transactions, including transactions contrary to any recommendation herein, or have positions in the securities mentioned herein or options with respect thereto. Any recommendation contained in this report may not be suitable for all investors and it is not to be deemed an offer or solicitation on our part with respect to the purchase or sale of any securities. |
|
 |
Financial, Retail, Networking and Biotech Indexes Rose
Kenneth J. Gruneisen - Passed the CAN SLIM® Master's Exam
The Bank Index ($BKX +0.98%) and Broker/Dealer Index ($XBD +0.96%) both posted solid gains and the Retail Index ($RLX +0.30%) also edged higher. The tech sector was mixed as the Semiconductor Index ($SOX -0.82%) fell, meanwhile the Networking Index ($NWX +0.73%) and the Biotech Index ($BTK +0.86%) both rose. Energy-linked groups were mixed as the Oil Services Index ($OSX -1.50%) fell and the Integrated Oil Index ($XOI +0.54%) rose. The Gold & Silver Index ($XAU +0.53%) also gained some ground.
Charts courtesy of www.stockcharts.com
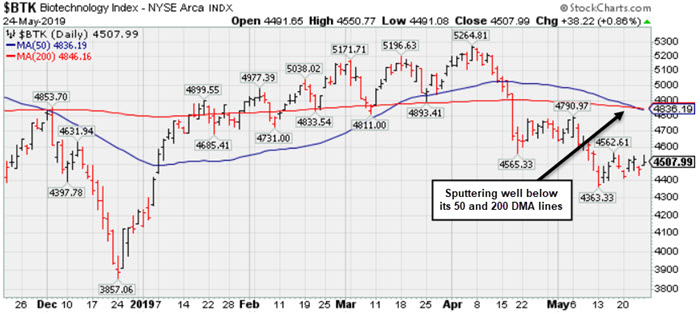
PICTURED: The Biotech Index ($BTK +0.86%) is sputtering below its 50-day and 200-day moving average (DMA) lines.
| Oil Services |
$OSX |
77.95 |
-1.19 |
-1.50% |
-3.29% |
| Integrated Oil |
$XOI |
1,223.25 |
+6.57 |
+0.54% |
+5.53% |
| Semiconductor |
$SOX |
1,311.97 |
-10.87 |
-0.82% |
+13.57% |
| Networking |
$NWX |
556.18 |
+4.05 |
+0.73% |
+13.81% |
| Broker/Dealer |
$XBD |
262.78 |
+2.50 |
+0.96% |
+10.72% |
| Retail |
$RLX |
2,247.95 |
+6.71 |
+0.30% |
+15.20% |
| Gold & Silver |
$XAU |
66.56 |
+0.35 |
+0.53% |
-5.80% |
| Bank |
$BKX |
95.84 |
+0.93 |
+0.98% |
+11.71% |
| Biotech |
$BTK |
4,507.99 |
+38.22 |
+0.86% |
+6.80% |
|
|
|
 |
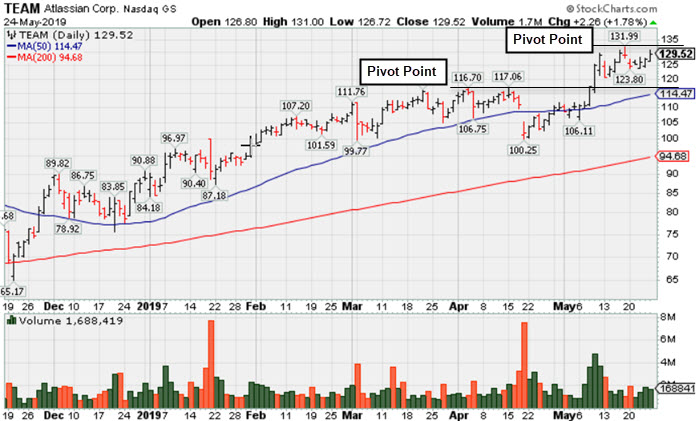
Perched Near All-Time High After "3-Weeks Tight"
Kenneth J. Gruneisen - Passed the CAN SLIM® Master's Exam
Atlassian Corp (TEAM +$2.26 or +1.78% to $129.52) remains perched near its all-time high and has formed an advanced "3-weeks tight" base. Subsequent volume-driven gains above the new pivot point may trigger a new (or add-on) technical buy signal. Keep in mind that the major averages (M criteria) need a follow-through day to confirm a new uptrend before any new buying efforts are justified under the fact-based investment system. Meanwhile, its prior high ($117.06 on 4/15/19) and 50-day moving average (DMA) line ($114.47) define near-term support to watch where violations would raise concerns and trigger technical sell signals.
Fundamentals remain strong. This Australia - based software developer recently reported earnings +133% on +38% sales revenues for the Mar '19 quarter, continuing its strong earnings track record with its 6th consecutive quarterly comparison above the +25% minimum guideline (C criteria). Its annual earnings (A criteria) history has been strong since its $21 IPO on 12/10/15.
TEAM was highlighted in yellow with new pivot point cited based on its 10/01/18 high plus 10 cents in the 1/04/19 mid-day report (read here). It was last shown in the FSU section on 4/09/19 with an annotated graph under the headline, "Perched Near High Enduring Distributional Pressure". The number of top-rated funds owning its shares rose from 266 in Sep '17 to 509 in Mar '19, a reassuring sign concerning the I criteria. It has a Timeliness Rating of A and Sponsorship Rating of B. Its current Up/Down Volume Ratio of 1.8 is an unbiased indication its shares have been under accumulation. |
|
|
Color Codes Explained :
Y - Better candidates highlighted by our
staff of experts.
G - Previously featured
in past reports as yellow but may no longer be buyable under the
guidelines.
***Last / Change / Volume data in this table is the closing quote data***
Symbol/Exchange
Company Name
Industry Group |
PRICE |
CHANGE
(%Change) |
Day High |
Volume
(% DAV)
(% 50 day avg vol) |
52 Wk Hi
% From Hi |
Featured
Date |
Price
Featured |
Pivot Featured |
|
Max Buy |
SPSC
-
NASDAQ
S P S Commerce Inc
COMPUTER SOFTWARE and SERVICES - Application Software
|
$101.47
|
+0.90
0.89% |
$103.67
|
166,622
108.90% of 50 DAV
50 DAV is 153,000
|
$115.00
-11.77%
|
3/26/2019
|
$107.12
|
PP = $113.41
|
|
MB = $119.08
|
 Most Recent Note - 5/24/2019 4:18:40 PM
G - Met resistance while sputtering below its 50 DMA line ($104.60) and it faces resistance due to overhead supply up to the $115 level. Recent low ($98.59 on 4/18/19) defines important near-term support to watch. Fundamentals remain strong.
>>> FEATURED STOCK ARTICLE : Sputtering Near 50-Day Average Line Building Base-On-Base - 5/1/2019 |
View all notes |
Set NEW NOTE alert |
Company Profile |
SEC
News |
Chart |
Request a new note
C
A
S
I |
EPAM
-
NYSE
Epam Systems Inc
COMPUTER SOFTWARE and SERVICES - Information Technology Service
|
$167.31
|
+0.90
0.54% |
$168.94
|
418,579
111.32% of 50 DAV
50 DAV is 376,000
|
$180.55
-7.33%
|
5/9/2019
|
$169.25
|
PP = $180.55
|
|
MB = $189.58
|
Most Recent Note - 5/23/2019 4:53:00 PM
G - Met resistance near its 50 DMA line ($171) and a rebound above that important short-term average is needed for its outlook to improve. Reported earnings +34% on +23% sales revenues for the Mar '19 quarter, continuing its strong earnings track record.
>>> FEATURED STOCK ARTICLE : Found Support and Closed in Upper Third of Day's Range - 5/9/2019 |
View all notes |
Set NEW NOTE alert |
Company Profile |
SEC
News |
Chart |
Request a new note
C
A
S
I |
ENV
-
NYSE
Envestnet Inc
FINANCIAL SERVICES - Diversified Investments
|
$68.17
|
+0.67
0.99% |
$68.62
|
124,080
41.36% of 50 DAV
50 DAV is 300,000
|
$72.67
-6.19%
|
3/15/2019
|
$66.05
|
PP = $64.90
|
|
MB = $68.15
|
Most Recent Note - 5/21/2019 5:49:23 PM
G - Rebounded above its 50 DMA line ($67.79) with today's gain on average volume. Weak action came after recently reporting earnings +5% on +1% sales revenues for the Mar '19 quarter, below the +25% minimum earnings guideline (C criteria). The prior high ($64.80 on 9/14/18) defines important near-term support to watch.
>>> FEATURED STOCK ARTICLE : Negative Reversal After Another New High - 4/24/2019 |
View all notes |
Set NEW NOTE alert |
Company Profile |
SEC
News |
Chart |
Request a new note
C
A
S
I |
TPL
-
NYSE
Texas Pacific Land Trust
Real Estate Dvlpmt/Ops
|
$783.56
|
-2.07
-0.26% |
$791.75
|
7,339
48.93% of 50 DAV
50 DAV is 15,000
|
$915.66
-14.43%
|
5/15/2019
|
$850.01
|
PP = $915.76
|
|
MB = $961.55
|
Most Recent Note - 5/23/2019 12:57:01 PM
G - Color code is changed to green while slumping below its 50 DMA line ($817) with today's loss raising concerns. A prompt rebound is needed for its outlook to improve. Subsequent gains above the pivot point backed by at least +40% above average volume may trigger a technical buy signal. Keep in mind that the major averages (M criteria) need a follow-through day to confirm a new uptrend before any new buying efforts are justified under the fact-based investment system. Reported earnings +222% on +219% sales revenues for the Mar '19 quarter continuing its strong earnings track record.
>>> FEATURED STOCK ARTICLE : Recently Found Support and Rose Toward All-Time High - 5/17/2019 |
View all notes |
Set NEW NOTE alert |
Company Profile |
SEC
News |
Chart |
Request a new note
C
A
S
I |
LHCG
-
NASDAQ
L H C Group Inc
HEALTH SERVICES - Home Health Care
|
$114.49
|
+0.49
0.43% |
$116.49
|
210,117
80.20% of 50 DAV
50 DAV is 262,000
|
$122.20
-6.31%
|
4/29/2019
|
$110.94
|
PP = $115.64
|
|
MB = $121.42
|
Most Recent Note - 5/23/2019 4:39:43 PM
Y - Slumped back below its "max buy" level and undercut its pivot point with a loss today on higher volume and its color code is changed to yellow. Its 50 DMA line ($111) defines near-term support Fundamentals remain strong.
>>> FEATURED STOCK ARTICLE : Long-Term Care Firm Hovering Near All-Time High - 5/14/2019 |
View all notes |
Set NEW NOTE alert |
Company Profile |
SEC
News |
Chart |
Request a new note
C
A
S
I |
Symbol/Exchange
Company Name
Industry Group |
PRICE |
CHANGE
(%Change) |
Day High |
Volume
(% DAV)
(% 50 day avg vol) |
52 Wk Hi
% From Hi |
Featured
Date |
Price
Featured |
Pivot Featured |
|
Max Buy |
ENSG
-
NASDAQ
Ensign Group Inc
HEALTH SERVICES - Long-Term Care Facilities
|
$55.27
|
+1.53
2.85% |
$55.65
|
266,951
88.10% of 50 DAV
50 DAV is 303,000
|
$58.14
-4.94%
|
4/30/2019
|
$51.46
|
PP = $53.30
|
|
MB = $55.97
|
Most Recent Note - 5/24/2019 5:44:01 PM
Y - Posted a big gain today with below average volume. Showing resilience in recent weeks after it reported earnings +22% on +12% sales revenues for the Mar '19 quarter, below the +25% minimum earnings guideline (C criteria), raising fundamental concerns.
>>> FEATURED STOCK ARTICLE : Two Damaging Losses Hurt Outlook - 4/17/2019 |
View all notes |
Set NEW NOTE alert |
Company Profile |
SEC
News |
Chart |
Request a new note
C
A
S
I |
LULU
-
NASDAQ
Lululemon Athletica
MANUFACTURING - Textile Manufacturing
|
$172.78
|
+2.58
1.52% |
$173.24
|
1,482,144
66.67% of 50 DAV
50 DAV is 2,223,000
|
$179.50
-3.74%
|
3/28/2019
|
$169.20
|
PP = $164.89
|
|
MB = $173.13
|
Most Recent Note - 5/23/2019 4:49:34 PM
Y - Color code is changed to yellow after pulling back below its "max buy" level. Its 50 DMA line ($166.91) defines important near-term support above prior highs in the $164 area.
>>> FEATURED STOCK ARTICLE : Volume Light While Hovering Near High - 5/10/2019 |
View all notes |
Set NEW NOTE alert |
Company Profile |
SEC
News |
Chart |
Request a new note
C
A
S
I |
NXST
-
NASDAQ
Nexstar Media Group Cl A
MEDIA - Broadcasting - TV
|
$104.31
|
+1.06
1.03% |
$105.07
|
386,023
77.67% of 50 DAV
50 DAV is 497,000
|
$119.93
-13.02%
|
5/1/2019
|
$115.33
|
PP = $120.03
|
|
MB = $126.03
|
Most Recent Note - 5/24/2019 4:22:25 PM
Still sputtering below its 50 DMA line ($110) and a rebound above the 50 DMA line is needed for its outlook to improve. Reported earnings +14% on +2% sales revenues for the Mar '19 quarter, below the +25% minimum earnings guideline (C criteria). It will be dropped from the Featured Stocks list tonight
>>> FEATURED STOCK ARTICLE : Technical and Fundamental Concerns Recently Raised - 5/21/2019 |
View all notes |
Set NEW NOTE alert |
Company Profile |
SEC
News |
Chart |
Request a new note
C
A
S
I |
ULTA
-
NASDAQ
Ulta Beauty Inc
SPECIALTY RETAIL - Specialty Retail, Other
|
$335.09
|
-2.74
-0.81% |
$340.84
|
614,748
82.08% of 50 DAV
50 DAV is 749,000
|
$359.69
-6.84%
|
3/15/2019
|
$341.27
|
PP = $322.59
|
|
MB = $338.72
|
Most Recent Note - 5/23/2019 4:55:27 PM
G - Slumped below its 50 DMA line ($345) with a volume-driven loss today hurting its outlook. Prior low ($325.62 on 5/14/19) defines important near-term support. It may be forming a new base and there is little resistance remaining up to the $359 level.
>>> FEATURED STOCK ARTICLE : Volume Totals Cooling in Recent Weeks While Hovering Near High - 4/26/2019 |
View all notes |
Set NEW NOTE alert |
Company Profile |
SEC
News |
Chart |
Request a new note
C
A
S
I |
ESNT
-
NYSE
Essent Group Ltd
Finance-MrtgandRel Svc
|
$47.76
|
+0.02
0.04% |
$48.22
|
472,625
71.83% of 50 DAV
50 DAV is 658,000
|
$48.88
-2.29%
|
3/18/2019
|
$45.84
|
PP = $45.06
|
|
MB = $47.31
|
Most Recent Note - 5/21/2019 5:53:26 PM
Y - Traded near its 52-week high today but erased its gain and ended near the session low. Recently reported earnings +15% on +20% sales revenues for the Mar '19 quarter, below the +25% minimum earnings guideline (C criteria), raising fundamental concerns. Its 50 DMA line ($45.82 defines near term support to watch. Faces very little resistance due to overhead supply up to the $50 level.
>>> FEATURED STOCK ARTICLE : Perched Above Pivot Point With Earnings News Due May 3rd - 4/25/2019 |
View all notes |
Set NEW NOTE alert |
Company Profile |
SEC
News |
Chart |
Request a new note
C
A
S
I |
Symbol/Exchange
Company Name
Industry Group |
PRICE |
CHANGE
(%Change) |
Day High |
Volume
(% DAV)
(% 50 day avg vol) |
52 Wk Hi
% From Hi |
Featured
Date |
Price
Featured |
Pivot Featured |
|
Max Buy |
FIVE
-
NASDAQ
Five Below Inc
Retail-DiscountandVariety
|
$132.10
|
+1.28
0.98% |
$133.80
|
608,010
52.96% of 50 DAV
50 DAV is 1,148,000
|
$148.22
-10.88%
|
4/11/2019
|
$132.05
|
PP = $133.75
|
|
MB = $140.44
|
Most Recent Note - 5/21/2019 5:47:24 PM
Y - Color code is changed to yellow after rebounding above its 50 DMA line ($130) with volume-driven gains helping its outlook to improve. Recent low defines important near-term support above its 200 DMA line.
>>> FEATURED STOCK ARTICLE : Finished Strong After Featured Again in Mid-Day Report - 4/11/2019 |
View all notes |
Set NEW NOTE alert |
Company Profile |
SEC
News |
Chart |
Request a new note
C
A
S
I |
NOW
-
NYSE
Servicenow Inc
Computer Sftwr-Enterprse
|
$268.95
|
+4.16
1.57% |
$269.44
|
1,181,366
64.87% of 50 DAV
50 DAV is 1,821,000
|
$281.74
-4.54%
|
4/22/2019
|
$242.64
|
PP = $251.75
|
|
MB = $264.34
|
Most Recent Note - 5/24/2019 4:17:11 PM
G - The 50 DMA line ($254) and prior high ($251.65 on 3/21/19) define important near-term support to watch while consolidating near its all-time high. Recently reported earnings +20% on +34% sales revenues for the Mar '19 quarter, below the +25% minimum earnings guideline (C criteria), raising concerns, fundamentally.
>>> FEATURED STOCK ARTICLE : Found Recent Support at 50-Day Moving Average - 4/15/2019 |
View all notes |
Set NEW NOTE alert |
Company Profile |
SEC
News |
Chart |
Request a new note
C
A
S
I |
QLYS
-
NASDAQ
Qualys Inc
Computer Sftwr-Security
|
$90.41
|
+0.24
0.27% |
$91.80
|
283,547
86.98% of 50 DAV
50 DAV is 326,000
|
$98.30
-8.03%
|
5/23/2019
|
$90.43
|
PP = $98.40
|
|
MB = $103.32
|
Most Recent Note - 5/24/2019 4:15:23 PM
Y - Color code was changed to yellow while subsequent volume-driven gains above the pivot point are needed to trigger a technical buy signal. Its Relative Strength Rating has improved to 88, above the 80+ minimum guideline for buy candidates. Found support near its 50 DMA line ($85.28) after encountering distributional pressure in recent weeks and dropped from the Featured Stocks list on 5/13/19. Met stubborn resistance in the $97-98 area. Reported earnings +36% on +16% sales revenues for the Mar '19 quarter, continuing its strong earnings history.
>>> FEATURED STOCK ARTICLE : Rallying to Challenge Previously Stubborn Resistance - 5/2/2019 |
View all notes |
Set NEW NOTE alert |
Company Profile |
SEC
News |
Chart |
Request a new note
C
A
S
I |
SPLK
-
NASDAQ
Splunk Inc
Computer Sftwr-Database
|
$119.30
|
-9.43
-7.33% |
$129.50
|
11,625,353
841.20% of 50 DAV
50 DAV is 1,382,000
|
$143.70
-16.98%
|
5/22/2019
|
$136.52
|
PP = $143.80
|
|
MB = $150.99
|
Most Recent Note - 5/24/2019 4:12:22 PM
G - Slumped well below its 50 DMA line and undercut prior lows while testing support at its 200 DMA line ($117) with today's big volume-driven loss. Reported earnings of 2 cents per share versus a loss of 7 cents per share on +36% sales revenues from the year ago period ended April 30th. Volume and volatility often increase near earnings news. See the latest FSU analysis for more details and an annotated graph.
>>> FEATURED STOCK ARTICLE : Perched Near Prior High With Earnings News Due - 5/22/2019 |
View all notes |
Set NEW NOTE alert |
Company Profile |
SEC
News |
Chart |
Request a new note
C
A
S
I |
PAYC
-
NYSE
Paycom Software Inc
COMPUTER SOFTWARE and SERVICES - Application Software
|
$208.23
|
+1.46
0.71% |
$210.91
|
510,541
78.42% of 50 DAV
50 DAV is 651,000
|
$215.65
-3.44%
|
2/6/2019
|
$171.66
|
PP = $164.18
|
|
MB = $172.39
|
Most Recent Note - 5/23/2019 12:58:05 PM
G - Pulling back after getting extended from any sound base. Its 50 DMA line ($194) defines important near-term support to watch. Reported earnings +25% on +30% sales revenues for the Mar '19 quarter.
>>> FEATURED STOCK ARTICLE : Paycom Software Quietly Hovering Near All-Time High - 4/16/2019 |
View all notes |
Set NEW NOTE alert |
Company Profile |
SEC
News |
Chart |
Request a new note
C
A
S
I |
Symbol/Exchange
Company Name
Industry Group |
PRICE |
CHANGE
(%Change) |
Day High |
Volume
(% DAV)
(% 50 day avg vol) |
52 Wk Hi
% From Hi |
Featured
Date |
Price
Featured |
Pivot Featured |
|
Max Buy |
PYPL
-
NASDAQ
Paypal Holdings Inc
Finance-CrdtCard/PmtPr
|
$109.85
|
-0.05
-0.05% |
$111.24
|
4,816,046
77.89% of 50 DAV
50 DAV is 6,183,000
|
$114.66
-4.20%
|
1/24/2019
|
$92.56
|
PP = $93.80
|
|
MB = $98.49
|
Most Recent Note - 5/23/2019 4:57:30 PM
G - Pulling back from its all-time high after getting very extended from any sound base. Well above its 50 DMA line ($107.37) and prior low which define near-term support to watch. Recently reported earnings +37% on +12% sales revenues for the Mar '19 quarter, continuing its strong earnings track record.
>>> FEATURED STOCK ARTICLE : Hovering Near All Time High Extended From Any Sound Base - 5/15/2019 |
View all notes |
Set NEW NOTE alert |
Company Profile |
SEC
News |
Chart |
Request a new note
C
A
S
I |
PLNT
-
NYSE
Planet Fitness Inc Cl A
Leisure-Services
|
$74.56
|
+0.15
0.20% |
$75.88
|
1,027,516
72.46% of 50 DAV
50 DAV is 1,418,000
|
$81.76
-8.81%
|
11/7/2018
|
$57.10
|
PP = $55.45
|
|
MB = $58.22
|
Most Recent Note - 5/23/2019 5:59:05 PM
G - Pulled back today for a 5th consecutive loss after getting very extended from any sound base. Its 50 DMA line ($72.80) and prior low define near-term support. Reported earnings +30% on +23% sales revenues for its first quarter ended March 31, 2019. See the latest FSU analysis for more details and a new annotated graph.
>>> FEATURED STOCK ARTICLE : Pulling Back From High After Impressive Rally - 5/23/2019 |
View all notes |
Set NEW NOTE alert |
Company Profile |
SEC
News |
Chart |
Request a new note
C
A
S
I |
BLD
-
NYSE
Topbuild Corp
Bldg-Constr Prds/Misc
|
$79.70
|
+1.36
1.74% |
$79.95
|
390,037
124.61% of 50 DAV
50 DAV is 313,000
|
$87.21
-8.61%
|
5/17/2019
|
$82.19
|
PP = $87.31
|
|
MB = $91.68
|
Most Recent Note - 5/23/2019 4:40:59 PM
Y - Encountered distributional pressure after highlighted in the 5/17/19 mid-day report. Subsequent gains above the pivot point backed by at least +40% above average volume may trigger a technical buy signal. Reported earnings +45% on +26% sales revenues for the Mar '19 quarter. Quarterly earnings increases have been above the +25% minimum guideline (C criteria). Annual earnings (A criteria) history has been strong and steady since turning profitable in FY '14.
>>> FEATURED STOCK ARTICLE : Encountered Distributional Pressure Near Prior High - 5/20/2019 |
View all notes |
Set NEW NOTE alert |
Company Profile |
SEC
News |
Chart |
Request a new note
C
A
S
I |
TEAM
-
NASDAQ
Atlassian Corp Plc Cl A
Comp Sftwr-Spec Enterprs
|
$129.52
|
+2.26
1.78% |
$131.00
|
1,678,240
93.18% of 50 DAV
50 DAV is 1,801,000
|
$131.99
-1.87%
|
5/24/2019
|
$129.52
|
PP = $132.09
|
|
MB = $138.69
|
Most Recent Note - 5/24/2019 5:41:53 PM
Y - Color code is changed to yellow after it has formed an advanced "3-weeks tight" base. Subsequent volume-driven gains for new highs may trigger a new (or add-on) technical buy signal. Reported earnings +133% on +38% sales revenues for the Mar '19 quarter, continuing its strong earnings track record. See the latest FSU analysis for more details and a new annotated graph.
>>> FEATURED STOCK ARTICLE : Perched Near All-Time High After "3-Weeks Tight" - 5/24/2019 |
View all notes |
Set NEW NOTE alert |
Company Profile |
SEC
News |
Chart |
Request a new note
C
A
S
I |
GLOB
-
NYSE
Globant SA
Computer-Tech Services
|
$89.46
|
+1.00
1.13% |
$89.93
|
415,238
176.70% of 50 DAV
50 DAV is 235,000
|
$89.71
-0.28%
|
2/15/2019
|
$69.35
|
PP = $70.00
|
|
MB = $73.50
|
Most Recent Note - 5/24/2019 5:45:04 PM
G - Posted yet another gain with above average volume today for a new all-time high, getting more extended from any sound base. Its 50 DMA line ($79) defines important support above the prior high ($74). Violations would raise concerns and trigger technical sell signals. Reported earnings +32% on +22% sales revenues for the quarter ended March 31st, 2019 versus the year ago period, continuing its strong earning track record.
>>> FEATURED STOCK ARTICLE : Earnings News Due While Perched Near All-Time High - 5/7/2019 |
View all notes |
Set NEW NOTE alert |
Company Profile |
SEC
News |
Chart |
Request a new note
C
A
S
I |
Symbol/Exchange
Company Name
Industry Group |
PRICE |
CHANGE
(%Change) |
Day High |
Volume
(% DAV)
(% 50 day avg vol) |
52 Wk Hi
% From Hi |
Featured
Date |
Price
Featured |
Pivot Featured |
|
Max Buy |
|
|
|
THESE ARE NOT BUY RECOMMENDATIONS!
Comments contained in the body of this report are technical
opinions only. The material herein has been obtained
from sources believed to be reliable and accurate, however,
its accuracy and completeness cannot be guaranteed.
This site is not an investment advisor, hence it does
not endorse or recommend any securities or other investments.
Any recommendation contained in this report may not
be suitable for all investors and it is not to be deemed
an offer or solicitation on our part with respect to
the purchase or sale of any securities. All trademarks,
service marks and trade names appearing in this report
are the property of their respective owners, and are
likewise used for identification purposes only.
This report is a service available
only to active Paid Premium Members.
You may opt-out of receiving report notifications
at any time. Questions or comments may be submitted
by writing to Premium Membership Services 665 S.E. 10 Street, Suite 201 Deerfield Beach, FL 33441-5634 or by calling 1-800-965-8307
or 954-785-1121.
|
|
|