You are not logged in.
This means you
CAN ONLY VIEW reports that were published prior to Saturday, February 24, 2024.
You
MUST UPGRADE YOUR MEMBERSHIP if you want to see any current reports.
AFTER MARKET UPDATE - FRIDAY, MAY 22ND, 2020
Previous After Market Report Next After Market Report >>>
|
|
|
|
DOW |
-8.96 |
24,465.16 |
-0.04% |
|
Volume |
719,693,248 |
-26% |
|
Volume |
3,611,489,700 |
-3% |
|
NASDAQ |
+41.11 |
9,325.99 |
+0.44% |
|
Advancers |
1,637 |
57% |
|
Advancers |
1,839 |
57% |
|
S&P 500 |
+6.94 |
2,955.45 |
+0.24% |
|
Decliners |
1,241 |
43% |
|
Decliners |
1,363 |
43% |
|
Russell 2000 |
+7.97 |
1,355.53 |
+0.59% |
|
52 Wk Highs |
26 |
|
|
52 Wk Highs |
72 |
|
|
S&P 600 |
+3.93 |
775.34 |
+0.51% |
|
52 Wk Lows |
7 |
|
|
52 Wk Lows |
10 |
|
|
 |
Major Indices Posted Weekly Gains Led by Small Caps
Kenneth J. Gruneisen - Passed the CAN SLIM® Master's Exam
The Dow slipped 8 points while the S&P 500 edged up 0.2%. The Nasdaq Composite advanced 0.4%. For the week, the Dow gained 3.3%, posting its largest weekly advance since early April. The S&P 500 added 3.2%, while the Nasdaq Composite jumped 3.4%. Meanwhile, small cap stocks led weekly outperformance with the Russell 2000 surging 8.3%. Breadth was positive as advancers led decliners by a 4-3 margin on the NYSE and by a 9-7 margin on the Nasdaq exchange. The reported volume totals were lighter than the prior session on the NYSE and on the Nasdaq exchange. There were 22 high-ranked companies from the Leaders List that hit new 52-week highs and were listed on the BreakOuts Page, versus 15 on the prior session. New 52-week highs totals outnumbered new 52-week lows totals on the NYSE and on the Nasdaq exchange. The major indices are in a confirmed uptrend (M criteria). Any sustainable rally requires a healthy crop of new leaders, so the recent improvement in new highs totals was noted as an encouraging sign. Charts used courtesy of www.stockcharts.com

PICTURED: The S&P 500 index finished -13% off its record high hit on 2/19/20. It has met resistance near its 200-day moving average (DMA) line after rebounding from the March lows.
Stocks finished mixed Friday, as market participants digested the latest geopolitical headlines. Overnight, China pledged its intentions to implement phase one of the trade deal despite the recent ramp-up in rhetoric between leaders in Beijing and Washington. China proposed new national-security measures in Hong Kong, a move which led to speculation of more mass protests in the city and drew sharp criticism from U.S. politicians. This follows legislation passed yesterday by the U.S. Senate which aims to increase oversight of foreign companies listed on U.S. stock exchanges. Treasuries advanced, with the yield on the 10-year note falling one basis points to 0.66%.
Six of 11 S&P 500 sectors ended the session in positive territory with the widely viewed defensive groups Real Estate and Utilities pacing gains. In earnings, NVIDIA (NVDA +2.9%) rose after the chipmaker’s first quarter financial results beat Wall Street expectations. Alibaba (BABA -5.87%) fell after the Chinese e-commerce giant topped analysts revenue projections but offered soft forward guidance for 2021. Shares of Hewlett Packard Enterprises (HPE -11.49%) sank after falling short of earnings and revenue projections. In other corporate news, Moderna (MRNA +2.91%) rose after top U.S. infectious disease official, Dr. Anthony Fauci, said its COVID-19 vaccine data looked “promising.” |
 Kenneth J. Gruneisen started out as a licensed stockbroker in August 1987, a couple of months prior to the historic stock market crash that took the Dow Jones Industrial Average down -22.6% in a single day. He has published daily fact-based fundamental and technical analysis on high-ranked stocks online for two decades. Through FACTBASEDINVESTING.COM, Kenneth provides educational articles, news, market commentary, and other information regarding proven investment systems that work in good times and bad.
Comments contained in the body of this report are technical opinions only and are not necessarily those of Gruneisen Growth Corp. The material herein has been obtained from sources believed to be reliable and accurate, however, its accuracy and completeness cannot be guaranteed. Our firm, employees, and customers may effect transactions, including transactions contrary to any recommendation herein, or have positions in the securities mentioned herein or options with respect thereto. Any recommendation contained in this report may not be suitable for all investors and it is not to be deemed an offer or solicitation on our part with respect to the purchase or sale of any securities. |
|
 |
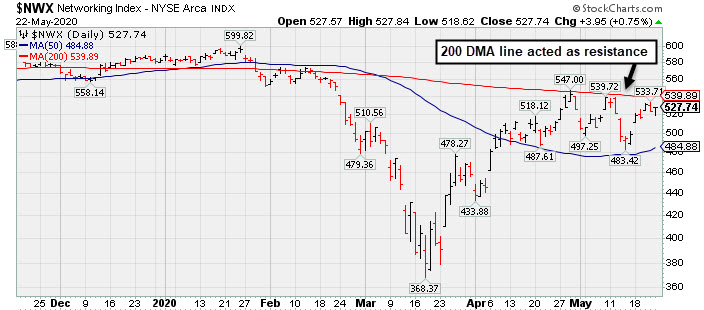
Tech indices Rose While Financial and Commodity-Linked Groups Fell
Kenneth J. Gruneisen - Passed the CAN SLIM® Master's Exam
The Bank Index ($BKX -0.87%) and the Broker/Dealer Index ($XBD -0.24%) both lost ground and the Retail Index ($RLX -0.08%) finished flat. The tech sector had a positive bias as the Semiconductor Index ($SOX +0.63%), Networking Index ($NWX +0.75%), and Biotech Index ($BTK +0.50%) each ended higher. Energy-linked groups had a negative bias as the Oil Services Index ($OSX -2.09%) and Integrated Oil Index ($XOI -0.86%) both fell. Gold & Silver Index ($XAU -0.25%) also edged lower. PICTURED: The Networking Index ($NWX +0.75%) posted a gain, yet it remains below its 200-day moving average (DMA) line which has acted as resistance after rebounding from the March lows.
| Oil Services |
$OSX |
30.36 |
-0.65 |
-2.10% |
-61.22% |
| Integrated Oil |
$XOI |
786.42 |
-6.84 |
-0.86% |
-38.10% |
| Semiconductor |
$SOX |
1,802.31 |
+11.35 |
+0.63% |
-2.56% |
| Networking |
$NWX |
527.74 |
+3.95 |
+0.75% |
-9.54% |
| Broker/Dealer |
$XBD |
242.21 |
-0.58 |
-0.24% |
-16.59% |
| Retail |
$RLX |
2,750.14 |
-2.21 |
-0.08% |
+12.28% |
| Gold & Silver |
$XAU |
124.21 |
-0.34 |
-0.27% |
+16.17% |
| Bank |
$BKX |
68.00 |
-0.60 |
-0.87% |
-40.01% |
| Biotech |
$BTK |
5,621.89 |
+27.77 |
+0.50% |
+10.94% |
|
|
|
 |
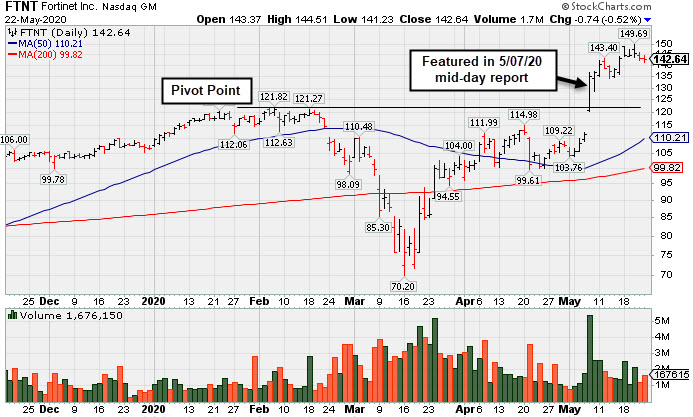
Extended From Prior Base and Holding Ground Stubbornly
Kenneth J. Gruneisen - Passed the CAN SLIM® Master's Exam
Fortinet Inc (FTNT -$0.74 or -0.52% to $142.64) remains perched near its all-time high, extended from the prior base. Prior highs in the $121 area define initial support to watch on pullbacks.
FTNT finished strong after highlighted in yellow with new pivot point cited based on its 2/06/20 high plus 10 cents in the 5/07/20 mid-day report (read here). Fundamentals remain strong. Bullish action came after reporting earnings +30% on +22% sales revenues for the Mar '20 quarter, its 9th consecutive quarterly comparison with earnings above the +25% minimum guideline (C criteria). Annual earnings (A criteria) have been improving since FY '14, also helping it match with the fact-based investment system's guidelines.
The number of top-rated funds owning its shares rose from 960 in Jun '18 to 1,559 in Mar '20, a reassuring sign concerning the I criteria. Its current Up/Down Volume ratio of 1.6 is an unbiased indication its shares have been neutral concerning accumulation/distribution over the past 50 days. It has a Timeliness rating of A and Sponsorship rating of B.
Charts courtesy of www.stockcharts.com
 |
|
|
Color Codes Explained :
Y - Better candidates highlighted by our
staff of experts.
G - Previously featured
in past reports as yellow but may no longer be buyable under the
guidelines.
***Last / Change / Volume data in this table is the closing quote data***
Symbol/Exchange
Company Name
Industry Group |
PRICE |
CHANGE
(%Change) |
Day High |
Volume
(% DAV)
(% 50 day avg vol) |
52 Wk Hi
% From Hi |
Featured
Date |
Price
Featured |
Pivot Featured |
|
Max Buy |
 FTNT
-
NASDAQ
FTNT
-
NASDAQ
Fortinet Inc
Computer Sftwr-Security
|
$142.64
|
-0.74
-0.52% |
$144.51
|
1,674,493
70.56% of 50 DAV
50 DAV is 2,373,000
|
$149.69
-4.71%
|
5/7/2020
|
$134.40
|
PP = $121.92
|
|
MB = $128.02
|
 Most Recent Note - 5/22/2020 5:07:26 PM
G - Holding its ground stubbornly near its all-time high, extended from the prior base. Prior highs in the $121 area define initial support to watch on pullbacks. See the latest FSU analysis for more details and a new annotated graph.
>>> FEATURED STOCK ARTICLE : Extended From Prior Base and Holding Ground Stubbornly - 5/22/2020 |
View all notes |
Set NEW NOTE alert |
Company Profile |
SEC
News |
Chart |
Request a new note
C
A
S
I |
SPNS
-
NASDAQ
Sapiens Intl Corp
COMPUTER SOFTWARE and SERVICES - Technical and System Software
|
$24.83
|
+0.56
2.31% |
$24.85
|
87,418
56.76% of 50 DAV
50 DAV is 154,000
|
$29.24
-15.08%
|
5/11/2020
|
$27.80
|
PP = $26.96
|
|
MB = $28.31
|
Most Recent Note - 5/21/2020 6:09:05 PM
G - Pulled back today with light volume. Encountered distributional pressure recently, yet found prompt support at its 200 DMA line. Last week it reported Mar '20 quarterly earnings +18% on +18% sales revenues versus the year ago period, below the +25% minimum guideline (C criteria), raising fundamental concerns. It slumped after highlighted in the 5/11/20 mid-day report with pivot point cited based on its 1/24/20 high plus 10 cents.
>>> FEATURED STOCK ARTICLE : Encountered Distributional Pressure After Hitting New High - 5/11/2020 |
View all notes |
Set NEW NOTE alert |
Company Profile |
SEC
News |
Chart |
Request a new note
C
A
S
I |
EBS
-
NYSE
Emergent Biosolutions
DRUGS - Biotechnology
|
$84.59
|
+2.10
2.55% |
$84.65
|
279,254
47.57% of 50 DAV
50 DAV is 587,000
|
$90.00
-6.01%
|
4/24/2020
|
$72.10
|
PP = $73.99
|
|
MB = $77.69
|
Most Recent Note - 5/21/2020 6:07:43 PM
G - Suffered a big loss today with -28% below average volume. It is extended from the previously noted base. Prior highs in the $71-73 area define initial support to watch on pullbacks. Fundamentals remain strong.
>>> FEATURED STOCK ARTICLE : Light Volume Gain for New High Close Caps 7th Straight Weekly Gain - 5/8/2020 |
View all notes |
Set NEW NOTE alert |
Company Profile |
SEC
News |
Chart |
Request a new note
C
A
S
I |
NBIX
-
NASDAQ
Neurocrine Biosciences
DRUGS - Biotechnology
|
$124.80
|
+3.63
3.00% |
$124.89
|
631,516
71.28% of 50 DAV
50 DAV is 886,000
|
$127.28
-1.95%
|
5/19/2020
|
$123.71
|
PP = $119.75
|
|
MB = $125.74
|
Most Recent Note - 5/22/2020 5:09:27 PM
Y - Finished at the session high for a best-ever close with a gain today on light volume. Technically, it broke out on 5/18/20 with +101% above average volume behind a gap up and big gain. Recent quarterly comparisons through Mar '20 showed greatly improved sales revenues and earnings increases versus year ago periods (C criteria). After years of losses it reported solid annual earnings (A criteria) in FY '18 and '19.
>>> FEATURED STOCK ARTICLE : Biotech Firm Has New Parkinson's Treatment Drug Approved by FDA - 5/19/2020 |
View all notes |
Set NEW NOTE alert |
Company Profile |
SEC
News |
Chart |
Request a new note
C
A
S
I |
TREX
-
NYSE
Trex Company Inc
MATERIALS and CONSTRUCTION - General Building Materials
|
$127.71
|
+2.90
2.32% |
$127.87
|
751,399
70.49% of 50 DAV
50 DAV is 1,066,000
|
$125.96
1.39%
|
5/5/2020
|
$109.05
|
PP = $111.95
|
|
MB = $117.55
|
Most Recent Note - 5/22/2020 5:13:49 PM
G - Posted a gain with light volume today for another new all-time high. Recent gains above the pivot point lacked the great volume conviction indicative of institutional demand. Prior highs in the $111 area define initial support to watch on pullbacks. Fundamentals remain strong.
>>> FEATURED STOCK ARTICLE : Bullish Action Continues for Top Wood Alternative Firm - 5/20/2020 |
View all notes |
Set NEW NOTE alert |
Company Profile |
SEC
News |
Chart |
Request a new note
C
A
S
I |
Symbol/Exchange
Company Name
Industry Group |
PRICE |
CHANGE
(%Change) |
Day High |
Volume
(% DAV)
(% 50 day avg vol) |
52 Wk Hi
% From Hi |
Featured
Date |
Price
Featured |
Pivot Featured |
|
Max Buy |
NFLX
-
NASDAQ
Netflix Inc
SPECIALTY RETAIL - Music and Video Stores
|
$429.32
|
-6.93
-1.59% |
$439.09
|
5,393,759
57.54% of 50 DAV
50 DAV is 9,374,000
|
$458.97
-6.46%
|
5/14/2020
|
$441.95
|
PP = $449.62
|
|
MB = $472.10
|
Most Recent Note - 5/22/2020 5:10:55 PM
Y - Pulled back today with light volume. Subsequent gains above the pivot point must be backed by at least +40% above average volume to trigger a proper new (or add-on) technical buy signal. Its 50 DMA line ($399) defines support above prior highs in the $393 area which acted as support following the recent breakout. Fundamentals remain strong.
>>> FEATURED STOCK ARTICLE : Pulling Back After Brief New Base Formation - 5/21/2020 |
View all notes |
Set NEW NOTE alert |
Company Profile |
SEC
News |
Chart |
Request a new note
C
A
S
I |
NOW
-
NYSE
Servicenow Inc
Computer Sftwr-Enterprse
|
$387.96
|
+4.32
1.13% |
$394.14
|
996,265
37.36% of 50 DAV
50 DAV is 2,667,000
|
$394.76
-1.72%
|
4/30/2020
|
$343.05
|
PP = $363.05
|
|
MB = $381.20
|
Most Recent Note - 5/21/2020 6:13:52 PM
G - Pulled back today with light volume following 5 consecutive gains. Gains above the pivot point were not backed by the +40% above average volume necessary to clinch a proper technical buy signal. Prior highs in the $362 area define initial support to watch on pullbacks.
>>> FEATURED STOCK ARTICLE : Consolidating Near Prior High After Wedging Into New High Ground - 5/14/2020 |
View all notes |
Set NEW NOTE alert |
Company Profile |
SEC
News |
Chart |
Request a new note
C
A
S
I |
QLYS
-
NASDAQ
Qualys Inc
Computer Sftwr-Security
|
$112.00
|
+2.40
2.19% |
$112.09
|
270,380
45.98% of 50 DAV
50 DAV is 588,000
|
$113.02
-0.90%
|
4/9/2020
|
$100.44
|
PP = $97.22
|
|
MB = $102.08
|
Most Recent Note - 5/21/2020 6:15:16 PM
G - Pulled back today with very light volume after touching a new all-time high on the prior session with its 5th consecutive gain. Reported Mar '20 quarterly earnings +33% on +14% sales revenues versus the year ago period, its 12th consecutive quarterly earnings increase above the +25% minimum guideline (C criteria). Prior highs in the $97 area recently acted as support.
>>> FEATURED STOCK ARTICLE : Quiet Pullback Just Below "Max Buy" Level - 5/13/2020 |
View all notes |
Set NEW NOTE alert |
Company Profile |
SEC
News |
Chart |
Request a new note
C
A
S
I |
TEAM
-
NASDAQ
Atlassian Corp Plc Cl A
Comp Sftwr-Spec Enterprs
|
$182.60
|
+2.35
1.30% |
$185.45
|
1,456,221
73.47% of 50 DAV
50 DAV is 1,982,000
|
$190.21
-4.00%
|
5/4/2020
|
$159.70
|
PP = $156.22
|
|
MB = $164.03
|
Most Recent Note - 5/21/2020 6:11:53 PM
G - Pulled back with higher (near average) volume today. It is extended from the previously noted base, and prior highs in the $156 area define initial support to watch on pullbacks.
>>> FEATURED STOCK ARTICLE : Pullback on Lighter Volume After Gain For New High on Big Volume - 5/18/2020 |
View all notes |
Set NEW NOTE alert |
Company Profile |
SEC
News |
Chart |
Request a new note
C
A
S
I |
AAXN
-
NASDAQ
Axon Enterprise Inc
Security/Sfty
|
$74.11
|
-2.45
-3.20% |
$77.19
|
585,253
70.77% of 50 DAV
50 DAV is 827,000
|
$90.10
-17.75%
|
5/8/2020
|
$84.86
|
PP = $90.20
|
|
MB = $94.71
|
Most Recent Note - 5/22/2020 5:12:27 PM
Y - Pulled back today testing recent lows with a loss on light volume. A rebound and subsequent volume-driven gains above the pivot point are still needed to trigger a technical buy signal.
>>> FEATURED STOCK ARTICLE : Security/Safety Firm Perched Near 52-Week High After Gap Up - 5/12/2020 |
View all notes |
Set NEW NOTE alert |
Company Profile |
SEC
News |
Chart |
Request a new note
C
A
S
I |
Symbol/Exchange
Company Name
Industry Group |
PRICE |
CHANGE
(%Change) |
Day High |
Volume
(% DAV)
(% 50 day avg vol) |
52 Wk Hi
% From Hi |
Featured
Date |
Price
Featured |
Pivot Featured |
|
Max Buy |
|
|
|
THESE ARE NOT BUY RECOMMENDATIONS!
Comments contained in the body of this report are technical
opinions only. The material herein has been obtained
from sources believed to be reliable and accurate, however,
its accuracy and completeness cannot be guaranteed.
This site is not an investment advisor, hence it does
not endorse or recommend any securities or other investments.
Any recommendation contained in this report may not
be suitable for all investors and it is not to be deemed
an offer or solicitation on our part with respect to
the purchase or sale of any securities. All trademarks,
service marks and trade names appearing in this report
are the property of their respective owners, and are
likewise used for identification purposes only.
This report is a service available
only to active Paid Premium Members.
You may opt-out of receiving report notifications
at any time. Questions or comments may be submitted
by writing to Premium Membership Services 665 S.E. 10 Street, Suite 201 Deerfield Beach, FL 33441-5634 or by calling 1-800-965-8307
or 954-785-1121.
|
|
|