You are not logged in.
This means you
CAN ONLY VIEW reports that were published prior to Saturday, February 24, 2024.
You
MUST UPGRADE YOUR MEMBERSHIP if you want to see any current reports.
AFTER MARKET UPDATE - THURSDAY, MAY 21ST, 2020
Previous After Market Report Next After Market Report >>>
|
|
|
|
DOW |
-101.78 |
24,474.12 |
-0.41% |
|
Volume |
975,905,779 |
+6% |
|
Volume |
3,723,840,000 |
-12% |
|
NASDAQ |
-90.90 |
9,284.88 |
-0.97% |
|
Advancers |
1,500 |
52% |
|
Advancers |
1,354 |
42% |
|
S&P 500 |
-23.10 |
2,948.51 |
-0.78% |
|
Decliners |
1,374 |
48% |
|
Decliners |
1,882 |
58% |
|
Russell 2000 |
+0.63 |
1,347.56 |
+0.05% |
|
52 Wk Highs |
30 |
|
|
52 Wk Highs |
58 |
|
|
S&P 600 |
+0.16 |
771.41 |
+0.02% |
|
52 Wk Lows |
6 |
|
|
52 Wk Lows |
13 |
|
|
 |
Small Cap Indexes Inched Higher as Major Indices Pulled Back
Kenneth J. Gruneisen - Passed the CAN SLIM® Master's Exam
The Dow slipped 101 points, while the S&P 500 fell 0.8% and the Nasdaq Composite declined 1%. However, the major averages remain on pace for robust weekly gains. Breadth was mixed as advancers led decliners by a narrow margin on the NYSE but decliners led advancer by about a 3-2 margin n the Nasdaq exchange. The reported volume totals were mixed, higher than the prior session on the NYSE and lower on the Nasdaq exchange. Leadership waned as there were 15 high-ranked companies from the Leaders List that hit new 52-week highs and were listed on the BreakOuts Page, versus 37 on the prior session. New 52-week highs totals outnumbered new 52-week lows totals on the NYSE and on the Nasdaq exchange. The major indices are in a confirmed uptrend (M criteria). Any sustainable rally requires a healthy crop of new leaders, so the recent improvement in new highs totals was noted as an encouraging sign. Charts used courtesy of www.stockcharts.com
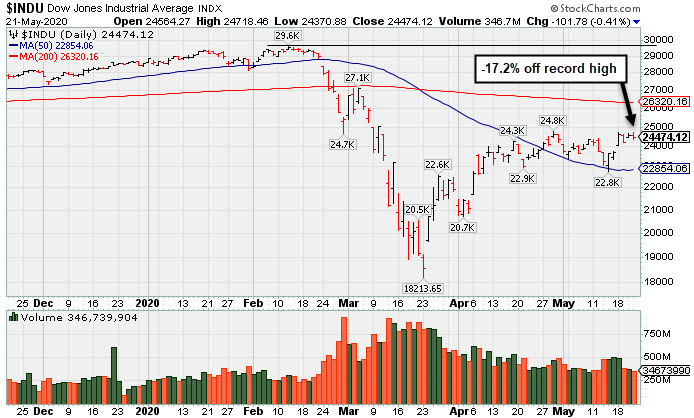
PICTURED: The Dow Jones Industrial Average finished -17.2% off its record high hit on 2/12/20.
Stocks finished lower on Thursday, as investors monitored ongoing U.S.-China tensions and digested economic data updates. In geopolitics, the Senate introduced a bipartisan bill that would sanction Chinese officials and entities that enforced the new national-security laws in Hong Kong, pressuring Beijing to preserve the city’s autonomy. This came a day after senators unanimously voted in favor of a bill aimed to increase oversight of foreign companies listed on U.S. exchanges, seemingly targeting certain Chinese companies and potentially preventing them from listing altogether. Additionally, President Trump and the White House have ramped up rhetoric against China, criticizing the nation’s leadership, as well as its trade and military policies.
On the data front, initial jobless claims eased from the prior period, but remained elevated at 2.4 million in the latest week. Separately, preliminary updates on the manufacturing and services sectors revealed both segments of the economy contracted at a slower pace in May. Treasuries modestly advanced, with the yield on the 10-year note down two basis points to 0.67%. In commodities, WTI crude rose for a sixth-straight session, while COMEX gold slid 1.6% to $1,724.500/ounce amid a stronger dollar.
Ten of 11 S&P 500 sectors ended lower, with Industrials bucking the downtrend. Energy and Technology stocks led laggards, with each group declining 1.4%. In earnings, TJX Companies (TJX +6.78%) rose after reporting strong sales at its 1,600 reopened stores. |
 Kenneth J. Gruneisen started out as a licensed stockbroker in August 1987, a couple of months prior to the historic stock market crash that took the Dow Jones Industrial Average down -22.6% in a single day. He has published daily fact-based fundamental and technical analysis on high-ranked stocks online for two decades. Through FACTBASEDINVESTING.COM, Kenneth provides educational articles, news, market commentary, and other information regarding proven investment systems that work in good times and bad.
Comments contained in the body of this report are technical opinions only and are not necessarily those of Gruneisen Growth Corp. The material herein has been obtained from sources believed to be reliable and accurate, however, its accuracy and completeness cannot be guaranteed. Our firm, employees, and customers may effect transactions, including transactions contrary to any recommendation herein, or have positions in the securities mentioned herein or options with respect thereto. Any recommendation contained in this report may not be suitable for all investors and it is not to be deemed an offer or solicitation on our part with respect to the purchase or sale of any securities. |
|
 |
Financial, Retail, Tech, and Commodity-Linked Groups Fell
Kenneth J. Gruneisen - Passed the CAN SLIM® Master's Exam
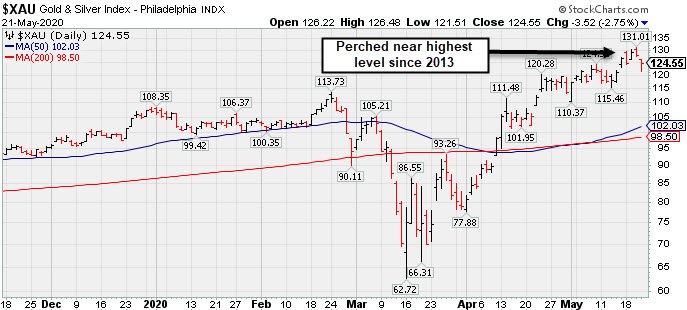
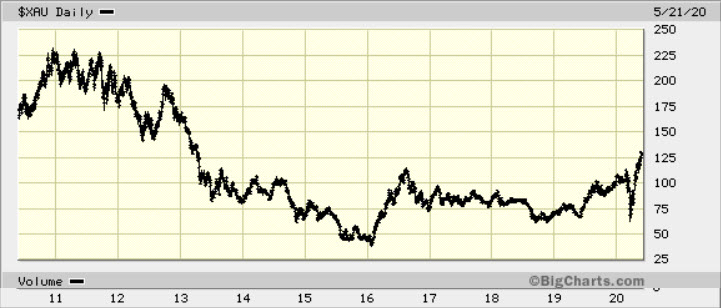
The Bank Index ($BKX -0.69%) and the Broker/Dealer Index ($XBD -0.98%) both lost ground and the Retail Index ($RLX -0.49%) also edged lower. The tech sector had a negative bias as the Semiconductor Index ($SOX -2.71%),Networking Index ($NWX -1.50%), and Biotech Index ($BTK -1.03%) each ended lower.Energy-linked groups also had a negative bias as the Oil Services Index ($OSX -1.08%) and Integrated Oil Index ($XOI -1.55%) both fell PICTURED: The Gold & Silver Index ($XAU -2.75%) also ended lower on the widely negative session. It is perched near its 2020 high after an abrupt pullback and rally above its 2016 high. However the 10-year graph illustrates how it is still well below its late 2010 and 2011 all-time highs
| Oil Services |
$OSX |
31.01 |
-0.33 |
-1.05% |
-60.39% |
| Integrated Oil |
$XOI |
793.27 |
-12.47 |
-1.55% |
-37.57% |
| Semiconductor |
$SOX |
1,790.96 |
-49.83 |
-2.71% |
-3.17% |
| Networking |
$NWX |
523.79 |
-7.98 |
-1.50% |
-10.22% |
| Broker/Dealer |
$XBD |
242.78 |
-2.39 |
-0.98% |
-16.39% |
| Retail |
$RLX |
2,752.35 |
-13.64 |
-0.49% |
+12.37% |
| Gold & Silver |
$XAU |
124.55 |
-3.52 |
-2.75% |
+16.49% |
| Bank |
$BKX |
68.60 |
-0.47 |
-0.68% |
-39.48% |
| Biotech |
$BTK |
5,594.13 |
-58.09 |
-1.03% |
+10.39% |
|
|
|
 |
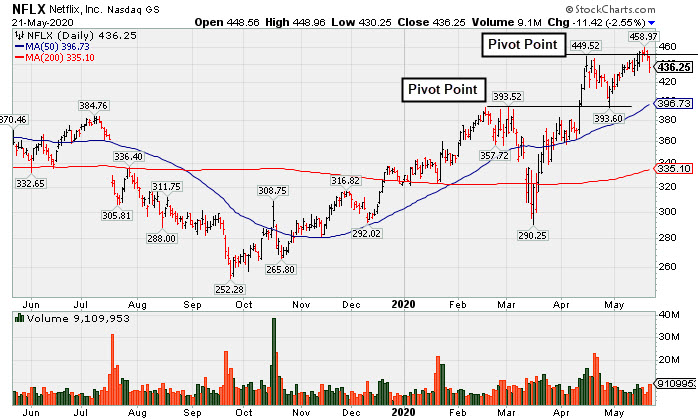
Pulling Back After Brief New Base Formation
Kenneth J. Gruneisen - Passed the CAN SLIM® Master's Exam
Netflix Inc (NFLX -$11.42 or -2.55% to $436.25) pulled back today with higher (near average) volume. Subsequent gains above the pivot point must be backed by at least +40% above average volume to trigger a proper new (or add-on) technical buy signal. Prior highs in the $393 area acted as support following the recent breakout. Volume totals had been cooling while stubbornly holding its ground near its all-time high. Its color code was changed to yellow with new pivot point cited based on its 4/16/20 high plus 10 cents. Recently it formed an advanced "3-weeks tight" base or what may also be considered a 4-week "square box" base. Fundamentals remain strong after it reported earnings +107% on +28% sales revenues for the Mar '20 quarter versus the year ago period, its 3rd consecutive quarterly comparison well above the +25% minimum guideline (C criteria). NFLX finished strong after it was highlighted in yellow with pivot point cited based on its 3/03/20 high plus 10 cents in the 4/13/20 mid-day report (read here). The gain above the pivot point was backed by +55% above average volume and triggered a technical buy signal. NFLX was last shown in this FSU section on 5/06/20 with an annotated graph under the headline, "Prior Highs Acted as Support Following Recent Breakout". A previously noted downturn in FY '15 earnings (A criteria) has been followed by very strong growth. The number of top-rated funds owning its shares (I criteria) rose from 1,534 in Mar '17 to 2,404 in Mar '20, a reassuring sign concerning the I criteria. The company has 422.2 million shares in the public float (S criteria) which can make it a less likely sprinter. It has a Timeliness rating of A, a Sponsorship rating of B, and an Accumulation/Distribution Rating of B+. Charts courtesy of www.stockcharts.com
 |
|
|
Color Codes Explained :
Y - Better candidates highlighted by our
staff of experts.
G - Previously featured
in past reports as yellow but may no longer be buyable under the
guidelines.
***Last / Change / Volume data in this table is the closing quote data***
Symbol/Exchange
Company Name
Industry Group |
PRICE |
CHANGE
(%Change) |
Day High |
Volume
(% DAV)
(% 50 day avg vol) |
52 Wk Hi
% From Hi |
Featured
Date |
Price
Featured |
Pivot Featured |
|
Max Buy |
 FTNT
-
NASDAQ
FTNT
-
NASDAQ
Fortinet Inc
Computer Sftwr-Security
|
$143.38
|
-2.24
-1.54% |
$146.00
|
1,220,826
50.87% of 50 DAV
50 DAV is 2,400,000
|
$149.69
-4.22%
|
5/7/2020
|
$134.40
|
PP = $121.92
|
|
MB = $128.02
|
Most Recent Note - 5/20/2020 5:55:36 PM
G - Hit another new all-time high with today's 5th consecutive gain, getting more extended from the prior base. Prior highs in the $121 area define initial support to watch on pullbacks.
>>> FEATURED STOCK ARTICLE : Gap Up and Big Volume-Driven Gain for Computer Security Firm - 5/7/2020 |
View all notes |
Set NEW NOTE alert |
Company Profile |
SEC
News |
Chart |
Request a new note
C
A
S
I |
SPNS
-
NASDAQ
Sapiens Intl Corp
COMPUTER SOFTWARE and SERVICES - Technical and System Software
|
$24.27
|
-0.80
-3.19% |
$25.24
|
66,518
42.64% of 50 DAV
50 DAV is 156,000
|
$29.24
-17.00%
|
5/11/2020
|
$27.80
|
PP = $26.96
|
|
MB = $28.31
|
 Most Recent Note - 5/21/2020 6:09:05 PM
G - Pulled back today with light volume. Encountered distributional pressure recently, yet found prompt support at its 200 DMA line. Last week it reported Mar '20 quarterly earnings +18% on +18% sales revenues versus the year ago period, below the +25% minimum guideline (C criteria), raising fundamental concerns. It slumped after highlighted in the 5/11/20 mid-day report with pivot point cited based on its 1/24/20 high plus 10 cents.
>>> FEATURED STOCK ARTICLE : Encountered Distributional Pressure After Hitting New High - 5/11/2020 |
View all notes |
Set NEW NOTE alert |
Company Profile |
SEC
News |
Chart |
Request a new note
C
A
S
I |
EBS
-
NYSE
Emergent Biosolutions
DRUGS - Biotechnology
|
$82.49
|
-6.10
-6.89% |
$88.12
|
420,496
71.63% of 50 DAV
50 DAV is 587,000
|
$90.00
-8.34%
|
4/24/2020
|
$72.10
|
PP = $73.99
|
|
MB = $77.69
|
Most Recent Note - 5/21/2020 6:07:43 PM
G - Suffered a big loss today with -28% below average volume. It is extended from the previously noted base. Prior highs in the $71-73 area define initial support to watch on pullbacks. Fundamentals remain strong.
>>> FEATURED STOCK ARTICLE : Light Volume Gain for New High Close Caps 7th Straight Weekly Gain - 5/8/2020 |
View all notes |
Set NEW NOTE alert |
Company Profile |
SEC
News |
Chart |
Request a new note
C
A
S
I |
NBIX
-
NASDAQ
Neurocrine Biosciences
DRUGS - Biotechnology
|
$121.17
|
-2.99
-2.41% |
$124.97
|
826,388
93.38% of 50 DAV
50 DAV is 885,000
|
$127.28
-4.80%
|
5/19/2020
|
$123.71
|
PP = $119.75
|
|
MB = $125.74
|
Most Recent Note - 5/20/2020 5:50:46 PM
Y - Finished near the session high with a gain today on average volume. Technically, it broke out on 5/18/20 with +101% above average volume behind a gap up and big gain. Recent quarterly comparisons through Mar '20 showed greatly improved sales revenues and earnings increases versus year ago periods (C criteria). After years of losses it reported solid annual earnings (A criteria) in FY '18 and '19. See the latest FSU analysis for more details and an annotated graph.
>>> FEATURED STOCK ARTICLE : Biotech Firm Has New Parkinson's Treatment Drug Approved by FDA - 5/19/2020 |
View all notes |
Set NEW NOTE alert |
Company Profile |
SEC
News |
Chart |
Request a new note
C
A
S
I |
TREX
-
NYSE
Trex Company Inc
MATERIALS and CONSTRUCTION - General Building Materials
|
$124.81
|
+2.71
2.22% |
$125.96
|
750,327
69.93% of 50 DAV
50 DAV is 1,073,000
|
$124.50
0.25%
|
5/5/2020
|
$109.05
|
PP = $111.95
|
|
MB = $117.55
|
Most Recent Note - 5/20/2020 5:47:33 PM
G - Perched near its all-time high, it posted a gain today with near average volume. Recent gains above the pivot point lacked the great volume conviction indicative of institutional demand. Prior highs in the $111 area define initial support to watch on pullbacks. Fundamentals remain strong. See the latest FSU analysis for more details and a new annotated graph.
>>> FEATURED STOCK ARTICLE : Bullish Action Continues for Top Wood Alternative Firm - 5/20/2020 |
View all notes |
Set NEW NOTE alert |
Company Profile |
SEC
News |
Chart |
Request a new note
C
A
S
I |
Symbol/Exchange
Company Name
Industry Group |
PRICE |
CHANGE
(%Change) |
Day High |
Volume
(% DAV)
(% 50 day avg vol) |
52 Wk Hi
% From Hi |
Featured
Date |
Price
Featured |
Pivot Featured |
|
Max Buy |
NFLX
-
NASDAQ
Netflix Inc
SPECIALTY RETAIL - Music and Video Stores
|
$436.25
|
-11.42
-2.55% |
$448.96
|
9,079,696
97.51% of 50 DAV
50 DAV is 9,312,000
|
$458.97
-4.95%
|
5/14/2020
|
$441.95
|
PP = $449.62
|
|
MB = $472.10
|
Most Recent Note - 5/21/2020 6:10:16 PM
Y - Pulled back today with higher (near average) volume. Subsequent gains above the pivot point must be backed by at least +40% above average volume to trigger a proper new (or add-on) technical buy signal. Prior highs in the $393 area acted as support following the recent breakout. Fundamentals remain strong.
>>> FEATURED STOCK ARTICLE : Pulling Back After Brief New Base Formation - 5/21/2020 |
View all notes |
Set NEW NOTE alert |
Company Profile |
SEC
News |
Chart |
Request a new note
C
A
S
I |
NOW
-
NYSE
Servicenow Inc
Computer Sftwr-Enterprse
|
$383.64
|
-6.52
-1.67% |
$393.59
|
981,458
36.28% of 50 DAV
50 DAV is 2,705,000
|
$394.76
-2.82%
|
4/30/2020
|
$343.05
|
PP = $363.05
|
|
MB = $381.20
|
Most Recent Note - 5/21/2020 6:13:52 PM
G - Pulled back today with light volume following 5 consecutive gains. Gains above the pivot point were not backed by the +40% above average volume necessary to clinch a proper technical buy signal. Prior highs in the $362 area define initial support to watch on pullbacks.
>>> FEATURED STOCK ARTICLE : Consolidating Near Prior High After Wedging Into New High Ground - 5/14/2020 |
View all notes |
Set NEW NOTE alert |
Company Profile |
SEC
News |
Chart |
Request a new note
C
A
S
I |
QLYS
-
NASDAQ
Qualys Inc
Computer Sftwr-Security
|
$109.60
|
-1.82
-1.63% |
$112.22
|
262,315
44.38% of 50 DAV
50 DAV is 591,000
|
$113.02
-3.03%
|
4/9/2020
|
$100.44
|
PP = $97.22
|
|
MB = $102.08
|
Most Recent Note - 5/21/2020 6:15:16 PM
G - Pulled back today with very light volume after touching a new all-time high on the prior session with its 5th consecutive gain. Reported Mar '20 quarterly earnings +33% on +14% sales revenues versus the year ago period, its 12th consecutive quarterly earnings increase above the +25% minimum guideline (C criteria). Prior highs in the $97 area recently acted as support.
>>> FEATURED STOCK ARTICLE : Quiet Pullback Just Below "Max Buy" Level - 5/13/2020 |
View all notes |
Set NEW NOTE alert |
Company Profile |
SEC
News |
Chart |
Request a new note
C
A
S
I |
TEAM
-
NASDAQ
Atlassian Corp Plc Cl A
Comp Sftwr-Spec Enterprs
|
$180.25
|
-3.59
-1.95% |
$185.28
|
1,828,410
91.01% of 50 DAV
50 DAV is 2,009,000
|
$190.21
-5.24%
|
5/4/2020
|
$159.70
|
PP = $156.22
|
|
MB = $164.03
|
Most Recent Note - 5/21/2020 6:11:53 PM
G - Pulled back with higher (near average) volume today. It is extended from the previously noted base, and prior highs in the $156 area define initial support to watch on pullbacks.
>>> FEATURED STOCK ARTICLE : Pullback on Lighter Volume After Gain For New High on Big Volume - 5/18/2020 |
View all notes |
Set NEW NOTE alert |
Company Profile |
SEC
News |
Chart |
Request a new note
C
A
S
I |
AAXN
-
NASDAQ
Axon Enterprise Inc
Security/Sfty
|
$76.56
|
+0.35
0.46% |
$77.54
|
676,260
80.80% of 50 DAV
50 DAV is 837,000
|
$90.10
-15.03%
|
5/8/2020
|
$84.86
|
PP = $90.20
|
|
MB = $94.71
|
Most Recent Note - 5/20/2020 5:57:12 PM
Y - Halted its recent slide with gains backed by very light volume. A rebound and subsequent volume-driven gains above the pivot point are still needed to trigger a technical buy signal.
>>> FEATURED STOCK ARTICLE : Security/Safety Firm Perched Near 52-Week High After Gap Up - 5/12/2020 |
View all notes |
Set NEW NOTE alert |
Company Profile |
SEC
News |
Chart |
Request a new note
C
A
S
I |
Symbol/Exchange
Company Name
Industry Group |
PRICE |
CHANGE
(%Change) |
Day High |
Volume
(% DAV)
(% 50 day avg vol) |
52 Wk Hi
% From Hi |
Featured
Date |
Price
Featured |
Pivot Featured |
|
Max Buy |
|
|
|
THESE ARE NOT BUY RECOMMENDATIONS!
Comments contained in the body of this report are technical
opinions only. The material herein has been obtained
from sources believed to be reliable and accurate, however,
its accuracy and completeness cannot be guaranteed.
This site is not an investment advisor, hence it does
not endorse or recommend any securities or other investments.
Any recommendation contained in this report may not
be suitable for all investors and it is not to be deemed
an offer or solicitation on our part with respect to
the purchase or sale of any securities. All trademarks,
service marks and trade names appearing in this report
are the property of their respective owners, and are
likewise used for identification purposes only.
This report is a service available
only to active Paid Premium Members.
You may opt-out of receiving report notifications
at any time. Questions or comments may be submitted
by writing to Premium Membership Services 665 S.E. 10 Street, Suite 201 Deerfield Beach, FL 33441-5634 or by calling 1-800-965-8307
or 954-785-1121.
|
|
|