You are not logged in.
This means you
CAN ONLY VIEW reports that were published prior to Sunday, February 25, 2024.
You
MUST UPGRADE YOUR MEMBERSHIP if you want to see any current reports.
AFTER MARKET UPDATE - WEDNESDAY, MAY 20TH, 2020
Previous After Market Report Next After Market Report >>>
|
|
|
|
DOW |
+369.04 |
24,575.90 |
+1.52% |
|
Volume |
921,029,155 |
+5% |
|
Volume |
4,240,727,900 |
+2% |
|
NASDAQ |
+189.32 |
9,374.42 |
+2.06% |
|
Advancers |
2,309 |
80% |
|
Advancers |
2,552 |
78% |
|
S&P 500 |
+49.12 |
2,972.06 |
+1.68% |
|
Decliners |
590 |
20% |
|
Decliners |
699 |
21% |
|
Russell 2000 |
+39.21 |
1,346.93 |
+3.00% |
|
52 Wk Highs |
34 |
|
|
52 Wk Highs |
88 |
|
|
S&P 600 |
+23.47 |
771.25 |
+3.14% |
|
52 Wk Lows |
7 |
|
|
52 Wk Lows |
15 |
|
|
 |
S&P 500 and Nasdaq Composite Index Rally to New Recovery Highs
Kenneth J. Gruneisen - Passed the CAN SLIM® Master's Exam
The S&P 500 advanced 1.7% to its best level in two months. The Nasdaq Composite was up 2.1%, bringing the Tech-heavy benchmark within 4.7% of its all-time high reached in February. The Dow climbed 369 points, while the small-cap Russell 2000 surged 2.8%. Breadth was positive as advancers led decliners by almost a 4-1 margin on the NYSE and more than 3-1 on the Nasdaq exchange. The reported volume totals were higher than the prior session on the NYSE and on the Nasdaq exchange, indicative of increasing institutional buying demand. There were 37 high-ranked companies from the Leaders List that hit new 52-week highs and were listed on the BreakOuts Page, versus 33 on the prior session. New 52-week highs totals outnumbered new 52-week lows totals on the NYSE and on the Nasdaq exchange. The major indices are in a confirmed uptrend (M criteria). Any sustainable rally requires a healthy crop of new leaders, so the recent improvement in new highs totals was noted as an encouraging sign. Charts used courtesy of www.stockcharts.com
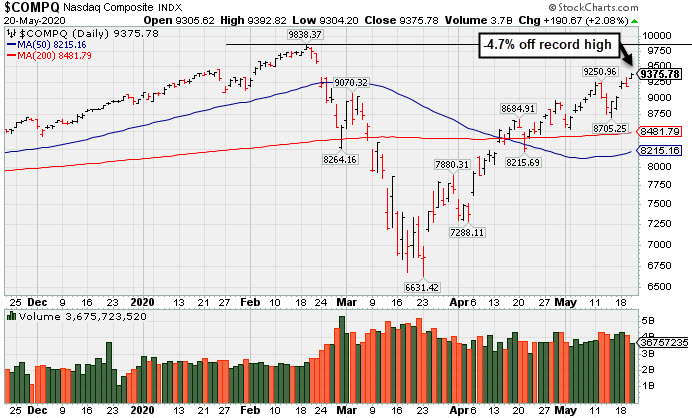
PICTURED: The Nasdaq Composite Index finished only -4.7% off its record high hit on 2/19/20.
Stock finished higher on Wednesday, as investors remained hopeful that an economic recovery would accelerate as more businesses reopen. All 11 S&P 500 sectors closed in positive territory. The Communication Services group outperformed, with Facebook (FB +6.04%) rallying to an all-time high following the announcement of its new e-commerce feature. Elsewhere, shares of Amazon (AMZN +1.98%) also climbed to a record level. Meanwhile, key retail earnings were in focus, with Lowe’s (LOW -0.10%) edging higher after topping profit and same-store sales estimates, and reporting an 80% surge in online sales. Target (TGT -2.87%) fell after recording a 64% drop in quarterly profit, as costs related to the coronavirus outweighed increased sales.
In central bank news, the minutes from the April FOMC meeting emphasized the Fed’s commitment to support the U.S. economy as participants acknowledged the potential downside risks over the medium-term due to COVID-19. Treasuries were little changed on the heels of the first 20-year bond auction in decades, with the yield on the 10-year note steady at 0.69%. In commodities, WTI crude advanced 4.9% to $33.54/barrel, its fifth-straight gain.
Also garnering attention was legislation unanimously passed by the Senate aimed to increase oversight of foreign companies listed on U.S. exchanges. The bill could prevent certain Chinese companies altogether, keeping tensions between the world’s two largest economies in focus. |
 Kenneth J. Gruneisen started out as a licensed stockbroker in August 1987, a couple of months prior to the historic stock market crash that took the Dow Jones Industrial Average down -22.6% in a single day. He has published daily fact-based fundamental and technical analysis on high-ranked stocks online for two decades. Through FACTBASEDINVESTING.COM, Kenneth provides educational articles, news, market commentary, and other information regarding proven investment systems that work in good times and bad.
Comments contained in the body of this report are technical opinions only and are not necessarily those of Gruneisen Growth Corp. The material herein has been obtained from sources believed to be reliable and accurate, however, its accuracy and completeness cannot be guaranteed. Our firm, employees, and customers may effect transactions, including transactions contrary to any recommendation herein, or have positions in the securities mentioned herein or options with respect thereto. Any recommendation contained in this report may not be suitable for all investors and it is not to be deemed an offer or solicitation on our part with respect to the purchase or sale of any securities. |
|
 |
Financial, Energy, Tech, and Retail Indexes Rose
Kenneth J. Gruneisen - Passed the CAN SLIM® Master's Exam
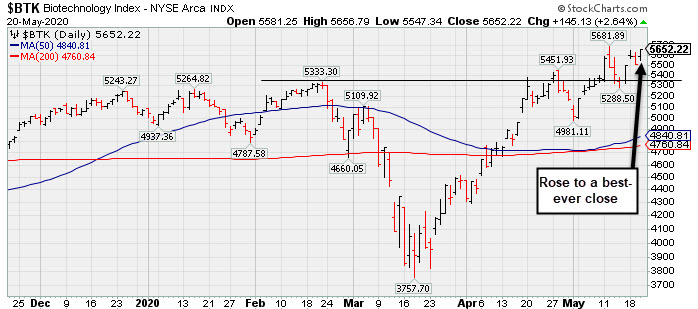
The Bank Index ($BKX +3.37%) and the Broker/Dealer Index ($XBD +3.00%) both posted solid gains and outpaced the Retail Index ($RLX +1.13%). The tech sector had a positive bias as the Semiconductor Index ($SOX +3.67%), Networking Index ($NWX +2.91%), and Biotech Index ($BTK +2.64%) each ended higher. Energy-linked groups also had a positive bias as the Oil Services Index ($OSX +6.36%) and Integrated Oil Index ($XOI +3.95%) both rose Meanwhile, the Gold & Silver Index ($XAU -0.92%) edged lower and was a standout decliner. PICTURED: The Biotech Index ($BTK +2.64%) posted a gain for a best-ever close.
| Oil Services |
$OSX |
31.35 |
+1.88 |
+6.38% |
-59.96% |
| Integrated Oil |
$XOI |
805.73 |
+30.59 |
+3.95% |
-36.58% |
| Semiconductor |
$SOX |
1,840.86 |
+65.25 |
+3.67% |
-0.47% |
| Networking |
$NWX |
531.77 |
+15.03 |
+2.91% |
-8.85% |
| Broker/Dealer |
$XBD |
245.18 |
+7.14 |
+3.00% |
-15.57% |
| Retail |
$RLX |
2,765.99 |
+30.80 |
+1.13% |
+12.93% |
| Gold & Silver |
$XAU |
128.07 |
-1.19 |
-0.92% |
+19.78% |
| Bank |
$BKX |
69.06 |
+2.24 |
+3.35% |
-39.08% |
| Biotech |
$BTK |
5,652.22 |
+145.13 |
+2.64% |
+11.54% |
|
|
|
 |
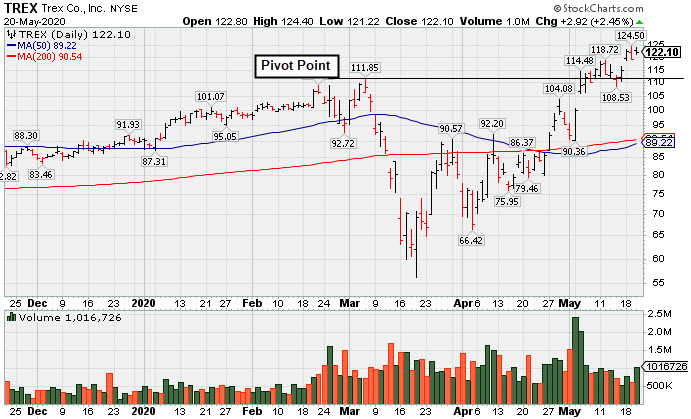
Bullish Action Continues for Top Wood Alternative Firm
Kenneth J. Gruneisen - Passed the CAN SLIM® Master's Exam
Trex Company Inc (TREX +$2.92 or +2.45% to $122.10) posted a small gain today. It gapped up on 5/18/20 rising above the "max buy" level, hitting a new all-time high with volume below average. Recent gains above the pivot point lacked the great volume conviction indicative of institutional demand. Prior highs in the $111 area define initial support to watch on pullbacks
TREX was highlighted in yellow with pivot point cited based on its 3/05/20 high plus 10 cents in the 5/05/20 mid-day report (read here). It rebounded impressively after a deep slump below its 50-day and 200-day moving average (DMA) lines during the recent market correction. It was last shown in this FSU section on 5/05/20 with an annotated graph under the headline, "Gapped Up for Volume-Driven Gain and Hit a New All-Time High".
It has earned the highest possible 99 Earnings Per Share Rating. TREX reported earnings +35% on +12% sales revenues for the Mar '20 quarter versus the year ago period, its 3rd consecutive quarterly comparison above the +25% minimum earnings guideline (C criteria). Annual earnings (A criteria) growth has been strong. The company hails from the General Building Materials industry group which currently has a Group Relative Strength Rating of B-.
The company has a new CEO as of 4/29/20. It has a small supply (S criteria) of only 57.9 million shares outstanding. The number of top-rated funds owning its shares rose from 540 in Jun '19 to 617 in Mar '20, a reassuring sign concerning the I criteria. Its current Up/Down Volume Ratio of 1.5 is an unbiased indication its shares have been under accumulation over the past 50 days. It has a Timeliness rating of A and a Sponsorship Rating of C.
|
|
|
Color Codes Explained :
Y - Better candidates highlighted by our
staff of experts.
G - Previously featured
in past reports as yellow but may no longer be buyable under the
guidelines.
***Last / Change / Volume data in this table is the closing quote data***
Symbol/Exchange
Company Name
Industry Group |
PRICE |
CHANGE
(%Change) |
Day High |
Volume
(% DAV)
(% 50 day avg vol) |
52 Wk Hi
% From Hi |
Featured
Date |
Price
Featured |
Pivot Featured |
|
Max Buy |
 FTNT
-
NASDAQ
FTNT
-
NASDAQ
Fortinet Inc
Computer Sftwr-Security
|
$145.62
|
+0.80
0.55% |
$149.69
|
1,527,874
63.01% of 50 DAV
50 DAV is 2,425,000
|
$148.85
-2.17%
|
5/7/2020
|
$134.40
|
PP = $121.92
|
|
MB = $128.02
|
 Most Recent Note - 5/20/2020 5:55:36 PM
G - Hit another new all-time high with today's 5th consecutive gain, getting more extended from the prior base. Prior highs in the $121 area define initial support to watch on pullbacks.
>>> FEATURED STOCK ARTICLE : Gap Up and Big Volume-Driven Gain for Computer Security Firm - 5/7/2020 |
View all notes |
Set NEW NOTE alert |
Company Profile |
SEC
News |
Chart |
Request a new note
C
A
S
I |
SPNS
-
NASDAQ
Sapiens Intl Corp
COMPUTER SOFTWARE and SERVICES - Technical and System Software
|
$25.07
|
+0.19
0.76% |
$25.69
|
179,531
115.08% of 50 DAV
50 DAV is 156,000
|
$29.24
-14.26%
|
5/11/2020
|
$27.80
|
PP = $26.96
|
|
MB = $28.31
|
Most Recent Note - 5/19/2020 12:54:33 PM
G - Encountered distributional pressure yet found prompt support at its 200 DMA line. Last week it reported Mar '20 quarterly earnings +18% on +18% sales revenues versus the year ago period, below the +25% minimum guideline (C criteria), raising fundamental concerns. It slumped after highlighted in the 5/11/20 mid-day report with pivot point cited based on its 1/24/20 high plus 10 cents.
>>> FEATURED STOCK ARTICLE : Encountered Distributional Pressure After Hitting New High - 5/11/2020 |
View all notes |
Set NEW NOTE alert |
Company Profile |
SEC
News |
Chart |
Request a new note
C
A
S
I |
EBS
-
NYSE
Emergent Biosolutions
DRUGS - Biotechnology
|
$88.59
|
+2.15
2.49% |
$89.49
|
526,465
89.84% of 50 DAV
50 DAV is 586,000
|
$90.00
-1.57%
|
4/24/2020
|
$72.10
|
PP = $73.99
|
|
MB = $77.69
|
Most Recent Note - 5/20/2020 5:51:39 PM
G - Posted a gain today with near average volume for the second-best ever close. It is extended from the previously noted base. Prior highs in the $71-73 area define initial support to watch on pullbacks. Fundamentals remain strong.
>>> FEATURED STOCK ARTICLE : Light Volume Gain for New High Close Caps 7th Straight Weekly Gain - 5/8/2020 |
View all notes |
Set NEW NOTE alert |
Company Profile |
SEC
News |
Chart |
Request a new note
C
A
S
I |
NBIX
-
NASDAQ
Neurocrine Biosciences
DRUGS - Biotechnology
|
$124.16
|
+4.23
3.53% |
$124.65
|
927,789
105.43% of 50 DAV
50 DAV is 880,000
|
$127.28
-2.45%
|
5/19/2020
|
$123.71
|
PP = $119.75
|
|
MB = $125.74
|
Most Recent Note - 5/20/2020 5:50:46 PM
Y - Finished near the session high with a gain today on average volume. Technically, it broke out on 5/18/20 with +101% above average volume behind a gap up and big gain. Recent quarterly comparisons through Mar '20 showed greatly improved sales revenues and earnings increases versus year ago periods (C criteria). After years of losses it reported solid annual earnings (A criteria) in FY '18 and '19. See the latest FSU analysis for more details and an annotated graph.
>>> FEATURED STOCK ARTICLE : Biotech Firm Has New Parkinson's Treatment Drug Approved by FDA - 5/19/2020 |
View all notes |
Set NEW NOTE alert |
Company Profile |
SEC
News |
Chart |
Request a new note
C
A
S
I |
TREX
-
NYSE
Trex Company Inc
MATERIALS and CONSTRUCTION - General Building Materials
|
$122.10
|
+2.92
2.45% |
$124.40
|
1,016,725
94.93% of 50 DAV
50 DAV is 1,071,000
|
$124.50
-1.93%
|
5/5/2020
|
$109.05
|
PP = $111.95
|
|
MB = $117.55
|
Most Recent Note - 5/20/2020 5:47:33 PM
G - Perched near its all-time high, it posted a gain today with near average volume. Recent gains above the pivot point lacked the great volume conviction indicative of institutional demand. Prior highs in the $111 area define initial support to watch on pullbacks. Fundamentals remain strong. See the latest FSU analysis for more details and a new annotated graph.
>>> FEATURED STOCK ARTICLE : Bullish Action Continues for Top Wood Alternative Firm - 5/20/2020 |
View all notes |
Set NEW NOTE alert |
Company Profile |
SEC
News |
Chart |
Request a new note
C
A
S
I |
Symbol/Exchange
Company Name
Industry Group |
PRICE |
CHANGE
(%Change) |
Day High |
Volume
(% DAV)
(% 50 day avg vol) |
52 Wk Hi
% From Hi |
Featured
Date |
Price
Featured |
Pivot Featured |
|
Max Buy |
NFLX
-
NASDAQ
Netflix Inc
SPECIALTY RETAIL - Music and Video Stores
|
$447.67
|
-3.37
-0.75% |
$455.81
|
5,594,054
59.82% of 50 DAV
50 DAV is 9,352,000
|
$458.97
-2.46%
|
5/14/2020
|
$441.95
|
PP = $449.62
|
|
MB = $472.10
|
Most Recent Note - 5/20/2020 5:59:01 PM
Y - Volume totals have been cooling while stubbornly holding its ground near its all-time high. Color code was changed to yellow with new pivot point cited based on its 4/16/20 high plus 10 cents. Recently formed an advanced "3-weeks tight" base or what may also be considered a 4-week "square box" base. Subsequent gains above the pivot point must be backed by at least +40% above average volume to trigger a proper new (or add-on) technical buy signal. Prior highs in the $393 area acted as support following the recent breakout. Fundamentals remain strong.
>>> FEATURED STOCK ARTICLE : Prior Highs Acted as Support Following Recent Breakout - 5/6/2020 |
View all notes |
Set NEW NOTE alert |
Company Profile |
SEC
News |
Chart |
Request a new note
C
A
S
I |
NOW
-
NYSE
Servicenow Inc
Computer Sftwr-Enterprse
|
$390.16
|
+7.28
1.90% |
$394.76
|
1,456,811
52.88% of 50 DAV
50 DAV is 2,755,000
|
$389.67
0.13%
|
4/30/2020
|
$343.05
|
PP = $363.05
|
|
MB = $381.20
|
Most Recent Note - 5/19/2020 6:15:43 PM
G - Posted a 4th consecutive gain today with light volume and its color code is changed to green after closing above its "max buy" level again. Gains above the pivot point should be backed by at least +40% above average volume to clinch a proper technical buy signal. Prior highs in the $362 area define initial support to watch on pullbacks.
>>> FEATURED STOCK ARTICLE : Consolidating Near Prior High After Wedging Into New High Ground - 5/14/2020 |
View all notes |
Set NEW NOTE alert |
Company Profile |
SEC
News |
Chart |
Request a new note
C
A
S
I |
QLYS
-
NASDAQ
Qualys Inc
Computer Sftwr-Security
|
$111.42
|
+2.06
1.88% |
$113.02
|
390,967
66.04% of 50 DAV
50 DAV is 592,000
|
$111.79
-0.33%
|
4/9/2020
|
$100.44
|
PP = $97.22
|
|
MB = $102.08
|
Most Recent Note - 5/19/2020 6:17:15 PM
G - Challenged its all-time high with today's 4th consecutive gain but volume was light and it ended near the session low. Reported Mar '20 quarterly earnings +33% on +14% sales revenues versus the year ago period, its 12th consecutive quarterly earnings increase above the +25% minimum guideline (C criteria). Prior highs in the $97 area recently acted as support.
>>> FEATURED STOCK ARTICLE : Quiet Pullback Just Below "Max Buy" Level - 5/13/2020 |
View all notes |
Set NEW NOTE alert |
Company Profile |
SEC
News |
Chart |
Request a new note
C
A
S
I |
TEAM
-
NASDAQ
Atlassian Corp Plc Cl A
Comp Sftwr-Spec Enterprs
|
$183.84
|
+2.56
1.41% |
$185.79
|
855,631
42.11% of 50 DAV
50 DAV is 2,032,000
|
$190.21
-3.35%
|
5/4/2020
|
$159.70
|
PP = $156.22
|
|
MB = $164.03
|
Most Recent Note - 5/18/2020 5:19:12 PM
G - Pulled back with lighter volume today following a gain with above average volume for a new all-time high on the prior session. Extended from the previously noted base, and prior highs in the $156 area define initial support to watch on pullbacks. See the latest FSU analysis for more details and a new annotated graph.
>>> FEATURED STOCK ARTICLE : Pullback on Lighter Volume After Gain For New High on Big Volume - 5/18/2020 |
View all notes |
Set NEW NOTE alert |
Company Profile |
SEC
News |
Chart |
Request a new note
C
A
S
I |
AAXN
-
NASDAQ
Axon Enterprise Inc
Security/Sfty
|
$76.21
|
+1.48
1.98% |
$77.37
|
415,326
49.21% of 50 DAV
50 DAV is 844,000
|
$90.10
-15.42%
|
5/8/2020
|
$84.86
|
PP = $90.20
|
|
MB = $94.71
|
Most Recent Note - 5/20/2020 5:57:12 PM
Y - Halted its recent slide with gains backed by very light volume. A rebound and subsequent volume-driven gains above the pivot point are still needed to trigger a technical buy signal.
>>> FEATURED STOCK ARTICLE : Security/Safety Firm Perched Near 52-Week High After Gap Up - 5/12/2020 |
View all notes |
Set NEW NOTE alert |
Company Profile |
SEC
News |
Chart |
Request a new note
C
A
S
I |
Symbol/Exchange
Company Name
Industry Group |
PRICE |
CHANGE
(%Change) |
Day High |
Volume
(% DAV)
(% 50 day avg vol) |
52 Wk Hi
% From Hi |
Featured
Date |
Price
Featured |
Pivot Featured |
|
Max Buy |
|
|
|
THESE ARE NOT BUY RECOMMENDATIONS!
Comments contained in the body of this report are technical
opinions only. The material herein has been obtained
from sources believed to be reliable and accurate, however,
its accuracy and completeness cannot be guaranteed.
This site is not an investment advisor, hence it does
not endorse or recommend any securities or other investments.
Any recommendation contained in this report may not
be suitable for all investors and it is not to be deemed
an offer or solicitation on our part with respect to
the purchase or sale of any securities. All trademarks,
service marks and trade names appearing in this report
are the property of their respective owners, and are
likewise used for identification purposes only.
This report is a service available
only to active Paid Premium Members.
You may opt-out of receiving report notifications
at any time. Questions or comments may be submitted
by writing to Premium Membership Services 665 S.E. 10 Street, Suite 201 Deerfield Beach, FL 33441-5634 or by calling 1-800-965-8307
or 954-785-1121.
|
|
|