***Last / Change / Volume data in this table is the closing quote data***
Symbol/Exchange
Company Name
Industry Group |
PRICE |
CHANGE
(%Change) |
Day High |
Volume
(% DAV)
(% 50 day avg vol) |
52 Wk Hi
% From Hi |
Featured
Date |
Price
Featured |
Pivot Featured |
|
Max Buy |
MLR
-
NYSE
Miller Industries Inc
AUTOMOTIVE - Auto Parts
|
$30.15
|
-0.39
-1.28% |
$30.87
|
33,650
82.68% of 50 DAV
50 DAV is 40,700
|
$35.26
-14.49%
|
11/30/2018
|
$28.35
|
PP = $29.50
|
|
MB = $30.98
|
Most Recent Note - 5/17/2019 1:03:41 PM
G - Slumping further below its 50 DMA line and undercutting the prior low ($30.38 on 3/27/19) with today's 6th consecutive loss. Its 200 DMA line ($29.08) defines the next important support level to watch. Reported March '19 quarterly earnings +29% on +24% sales revenues versus the year ago period, above the +25% minimum earnings guideline (C criteria).
>>> FEATURED STOCK ARTICLE : Below 50-Day Average After Damaging Losses - 4/8/2019 |
View all notes |
Set NEW NOTE alert |
Company Profile |
SEC
News |
Chart |
Request a new note
C
A
S
I |
SPSC
-
NASDAQ
S P S Commerce Inc
COMPUTER SOFTWARE and SERVICES - Application Software
|
$102.76
|
+1.11
1.09% |
$103.04
|
138,334
94.10% of 50 DAV
50 DAV is 147,000
|
$115.00
-10.64%
|
3/26/2019
|
$107.12
|
PP = $113.41
|
|
MB = $119.08
|
Most Recent Note - 5/17/2019 7:09:47 PM
G - Slumped to end the week back below its 50 DMA line ($105) hurting its outlook. Recent low ($98.59 on 4/18/19) defines important near-term support to watch. Fundamentals remain strong.
>>> FEATURED STOCK ARTICLE : Sputtering Near 50-Day Average Line Building Base-On-Base - 5/1/2019 |
View all notes |
Set NEW NOTE alert |
Company Profile |
SEC
News |
Chart |
Request a new note
C
A
S
I |
EPAM
-
NYSE
Epam Systems Inc
COMPUTER SOFTWARE and SERVICES - Information Technology Service
|
$166.49
|
-3.03
-1.79% |
$169.40
|
493,840
136.04% of 50 DAV
50 DAV is 363,000
|
$180.55
-7.79%
|
5/9/2019
|
$169.25
|
PP = $180.55
|
|
MB = $189.58
|
 Most Recent Note - 5/20/2019 7:31:49 PM
G - Color code is changed to green after slumping back below its 50 DMA line ($171) again. Gains above its 50 DMA line are needed for its outlook to improve. Reported earnings +34% on +23% sales revenues for the Mar '19 quarter, continuing its strong earnings track record.
>>> FEATURED STOCK ARTICLE : Found Support and Closed in Upper Third of Day's Range - 5/9/2019 |
View all notes |
Set NEW NOTE alert |
Company Profile |
SEC
News |
Chart |
Request a new note
C
A
S
I |
ENV
-
NYSE
Envestnet Inc
FINANCIAL SERVICES - Diversified Investments
|
$67.13
|
+0.12
0.18% |
$68.06
|
182,482
58.68% of 50 DAV
50 DAV is 311,000
|
$72.67
-7.62%
|
3/15/2019
|
$66.05
|
PP = $64.90
|
|
MB = $68.15
|
Most Recent Note - 5/17/2019 7:13:14 PM
G - Lost ground after a gap down today and closed below its 50 DMA line ($67.55) which acted as support after a damaging gap down on 5/09/19. Weak action came after reporting earnings +5% on +1% sales revenues for the Mar '19 quarter, below the +25% minimum earnings guideline (C criteria). The prior high ($64.80 on 9/14/18) defines near-term support to watch.
>>> FEATURED STOCK ARTICLE : Negative Reversal After Another New High - 4/24/2019 |
View all notes |
Set NEW NOTE alert |
Company Profile |
SEC
News |
Chart |
Request a new note
C
A
S
I |
TPL
-
NYSE
Texas Pacific Land Trust
Real Estate Dvlpmt/Ops
|
$845.51
|
-20.90
-2.41% |
$873.00
|
8,949
59.66% of 50 DAV
50 DAV is 15,000
|
$915.66
-7.66%
|
5/15/2019
|
$850.01
|
PP = $915.76
|
|
MB = $961.55
|
Most Recent Note - 5/17/2019 7:04:03 PM
Y - Posted a 4th consecutive gain today with near average volume. Subsequent gains above the pivot point backed by at least +40% above average volume may trigger a technical buy signal. Keep in mind that the major averages (M criteria) need a follow-through day to confirm a new uptrend before any new buying efforts are justified under the fact-based investment system. Reported earnings +222% on +219% sales revenues for the Mar '19 quarter continuing its strong earnings track record. Found support near its 50 DMA line ($808) in recent weeks. See the latest FSU analysis for more details and a new annotated graph.
>>> FEATURED STOCK ARTICLE : Recently Found Support and Rose Toward All-Time High - 5/17/2019 |
View all notes |
Set NEW NOTE alert |
Company Profile |
SEC
News |
Chart |
Request a new note
C
A
S
I |
Symbol/Exchange
Company Name
Industry Group |
PRICE |
CHANGE
(%Change) |
Day High |
Volume
(% DAV)
(% 50 day avg vol) |
52 Wk Hi
% From Hi |
Featured
Date |
Price
Featured |
Pivot Featured |
|
Max Buy |
LHCG
-
NASDAQ
L H C Group Inc
HEALTH SERVICES - Home Health Care
|
$120.55
|
+2.30
1.95% |
$122.20
|
282,514
108.66% of 50 DAV
50 DAV is 260,000
|
$120.70
-0.12%
|
4/29/2019
|
$110.94
|
PP = $115.64
|
|
MB = $121.42
|
Most Recent Note - 5/20/2019 1:31:21 PM
G - Rose above its "max buy" level and its color code is changed to green. Recent gains above the pivot point were not backed the volume necessary to trigger a proper technical buy signal. Fundamentals remain strong.
>>> FEATURED STOCK ARTICLE : Long-Term Care Firm Hovering Near All-Time High - 5/14/2019 |
View all notes |
Set NEW NOTE alert |
Company Profile |
SEC
News |
Chart |
Request a new note
C
A
S
I |
ENSG
-
NASDAQ
Ensign Group Inc
HEALTH SERVICES - Long-Term Care Facilities
|
$56.10
|
-0.04
-0.07% |
$56.60
|
238,404
80.00% of 50 DAV
50 DAV is 298,000
|
$57.28
-2.06%
|
4/30/2019
|
$51.46
|
PP = $53.30
|
|
MB = $55.97
|
Most Recent Note - 5/17/2019 12:50:15 PM
G - Color code is changed to green while perched at its all-time high following volume-driven gains above the "max buy" level. Reported earnings +22% on +12% sales revenues for the Mar '19 quarter, below the +25% minimum earnings guideline (C criteria), raising fundamental concerns.
>>> FEATURED STOCK ARTICLE : Two Damaging Losses Hurt Outlook - 4/17/2019 |
View all notes |
Set NEW NOTE alert |
Company Profile |
SEC
News |
Chart |
Request a new note
C
A
S
I |
LULU
-
NASDAQ
Lululemon Athletica
MANUFACTURING - Textile Manufacturing
|
$174.15
|
+1.15
0.66% |
$174.86
|
1,077,031
47.09% of 50 DAV
50 DAV is 2,287,000
|
$179.50
-2.98%
|
3/28/2019
|
$169.20
|
PP = $164.89
|
|
MB = $173.13
|
Most Recent Note - 5/17/2019 7:15:06 PM
Y - Quietly ended the week consolidating just below its "max buy" level. Prior highs in the $164 area and its 50 DMA line ($164.56) coincide defining important near-term support.
>>> FEATURED STOCK ARTICLE : Volume Light While Hovering Near High - 5/10/2019 |
View all notes |
Set NEW NOTE alert |
Company Profile |
SEC
News |
Chart |
Request a new note
C
A
S
I |
NXST
-
NASDAQ
Nexstar Media Group Cl A
MEDIA - Broadcasting - TV
|
$105.21
|
-1.24
-1.16% |
$105.90
|
242,789
47.42% of 50 DAV
50 DAV is 512,000
|
$119.93
-12.27%
|
5/1/2019
|
$115.33
|
PP = $120.03
|
|
MB = $126.03
|
Most Recent Note - 5/15/2019 1:15:06 PM
G - A rebound above the 50 DMA line is needed for its outlook to improve. Slumped below its 50 DMA line ($110) recently raising greater concerns and triggering a technical sell signal. Reported earnings +14% on +2% sales revenues for the Mar '19 quarter, below the +25% minimum earnings guideline (C criteria).
>>> FEATURED STOCK ARTICLE : Hitting New High and Very Extended From Prior Base - 4/4/2019 |
View all notes |
Set NEW NOTE alert |
Company Profile |
SEC
News |
Chart |
Request a new note
C
A
S
I |
ULTA
-
NASDAQ
Ulta Beauty Inc
SPECIALTY RETAIL - Specialty Retail, Other
|
$347.89
|
+5.44
1.59% |
$348.31
|
829,220
109.40% of 50 DAV
50 DAV is 758,000
|
$359.69
-3.28%
|
3/15/2019
|
$341.27
|
PP = $322.59
|
|
MB = $338.72
|
Most Recent Note - 5/14/2019 5:16:52 PM
G - Managed a "positive reversal" today after slumping near the prior high ($322). A rebound above the 50 DMA line ($340) still is needed for its outlook to improve.
>>> FEATURED STOCK ARTICLE : Volume Totals Cooling in Recent Weeks While Hovering Near High - 4/26/2019 |
View all notes |
Set NEW NOTE alert |
Company Profile |
SEC
News |
Chart |
Request a new note
C
A
S
I |
Symbol/Exchange
Company Name
Industry Group |
PRICE |
CHANGE
(%Change) |
Day High |
Volume
(% DAV)
(% 50 day avg vol) |
52 Wk Hi
% From Hi |
Featured
Date |
Price
Featured |
Pivot Featured |
|
Max Buy |
ESNT
-
NYSE
Essent Group Ltd
Finance-MrtgandRel Svc
|
$47.73
|
+0.41
0.87% |
$48.00
|
598,441
93.51% of 50 DAV
50 DAV is 640,000
|
$48.88
-2.35%
|
3/18/2019
|
$45.84
|
PP = $45.06
|
|
MB = $47.31
|
Most Recent Note - 5/14/2019 5:13:39 PM
Y - Recently reported earnings +15% on +20% sales revenues for the Mar '19 quarter, below the +25% minimum earnings guideline (C criteria), raising fundamental concerns. Its 50 DMA line ($45.40 defines near term support to watch. Faces very little resistance due to overhead supply up to the $50 level.
>>> FEATURED STOCK ARTICLE : Perched Above Pivot Point With Earnings News Due May 3rd - 4/25/2019 |
View all notes |
Set NEW NOTE alert |
Company Profile |
SEC
News |
Chart |
Request a new note
C
A
S
I |
FIVE
-
NASDAQ
Five Below Inc
Retail-DiscountandVariety
|
$129.42
|
+3.77
3.00% |
$130.05
|
1,702,910
154.11% of 50 DAV
50 DAV is 1,105,000
|
$148.22
-12.68%
|
4/11/2019
|
$132.05
|
PP = $133.75
|
|
MB = $140.44
|
Most Recent Note - 5/20/2019 1:25:06 PM
G - A rebound above its 50 DMA line ($129.93) is needed for its outlook to improve. Recently slumped into the prior base raising concerns.
>>> FEATURED STOCK ARTICLE : Finished Strong After Featured Again in Mid-Day Report - 4/11/2019 |
View all notes |
Set NEW NOTE alert |
Company Profile |
SEC
News |
Chart |
Request a new note
C
A
S
I |
NOW
-
NYSE
Servicenow Inc
Computer Sftwr-Enterprse
|
$265.08
|
-7.91
-2.90% |
$270.50
|
2,414,029
130.63% of 50 DAV
50 DAV is 1,848,000
|
$281.74
-5.91%
|
4/22/2019
|
$242.64
|
PP = $251.75
|
|
MB = $264.34
|
Most Recent Note - 5/20/2019 7:27:23 PM
G - Pulled back today with higher volume indicative distributional pressure, retreating from its all-time high. Bullish action was noted after it reported earnings +20% on +34% sales revenues for the Mar '19 quarter, below the +25% minimum earnings guideline (C criteria), raising concerns, fundamentally. Prior high ($251.65 on 3/21/19) and its 50 DMA line ($251.80) coincide defining important near-term support to watch.
>>> FEATURED STOCK ARTICLE : Found Recent Support at 50-Day Moving Average - 4/15/2019 |
View all notes |
Set NEW NOTE alert |
Company Profile |
SEC
News |
Chart |
Request a new note
C
A
S
I |
PAYC
-
NYSE
Paycom Software Inc
COMPUTER SOFTWARE and SERVICES - Application Software
|
$207.29
|
-3.46
-1.64% |
$209.89
|
716,306
110.88% of 50 DAV
50 DAV is 646,000
|
$215.38
-3.76%
|
2/6/2019
|
$171.66
|
PP = $164.18
|
|
MB = $172.39
|
Most Recent Note - 5/14/2019 5:27:41 PM
G - Its 50 DMA line ($190) defines important near-term support to watch. Hovering near its all-time high, extended from any sound base. Reported earnings +25% on +30% sales revenues for the Mar '19 quarter.
>>> FEATURED STOCK ARTICLE : Paycom Software Quietly Hovering Near All-Time High - 4/16/2019 |
View all notes |
Set NEW NOTE alert |
Company Profile |
SEC
News |
Chart |
Request a new note
C
A
S
I |
PYPL
-
NASDAQ
Paypal Holdings Inc
Finance-CrdtCard/PmtPr
|
$112.15
|
-0.65
-0.58% |
$113.31
|
3,631,586
57.43% of 50 DAV
50 DAV is 6,323,000
|
$114.66
-2.19%
|
1/24/2019
|
$92.56
|
PP = $93.80
|
|
MB = $98.49
|
Most Recent Note - 5/15/2019 6:36:34 PM
G - Posted another gain today with light volume. Well above its 50 DMA line ($105.55) which defines near-term support to watch. Recently reported earnings +37% on +12% sales revenues for the Mar '19 quarter, continuing its strong earnings track record. See the latest FSU analysis for more details and a new annotated graph.
>>> FEATURED STOCK ARTICLE : Hovering Near All Time High Extended From Any Sound Base - 5/15/2019 |
View all notes |
Set NEW NOTE alert |
Company Profile |
SEC
News |
Chart |
Request a new note
C
A
S
I |
Symbol/Exchange
Company Name
Industry Group |
PRICE |
CHANGE
(%Change) |
Day High |
Volume
(% DAV)
(% 50 day avg vol) |
52 Wk Hi
% From Hi |
Featured
Date |
Price
Featured |
Pivot Featured |
|
Max Buy |
PLNT
-
NYSE
Planet Fitness Inc Cl A
Leisure-Services
|
$77.74
|
-2.28
-2.85% |
$79.67
|
1,632,180
116.67% of 50 DAV
50 DAV is 1,399,000
|
$81.76
-4.92%
|
11/7/2018
|
$57.10
|
PP = $55.45
|
|
MB = $58.22
|
Most Recent Note - 5/20/2019 7:29:54 PM
G - Pulled back for a 2nd consecutive loss after getting very extended from any sound base. Its 50 DMA line ($72.24) and prior low define near-term support. Reported earnings +30% on +23% sales revenues for its first quarter ended March 31, 2019.
>>> FEATURED STOCK ARTICLE : Perched Near High Very Extended From Prior Base - 4/5/2019 |
View all notes |
Set NEW NOTE alert |
Company Profile |
SEC
News |
Chart |
Request a new note
C
A
S
I |
BLD
-
NYSE
Topbuild Corp
Bldg-Constr Prds/Misc
|
$80.87
|
-1.18
-1.44% |
$83.21
|
409,269
130.34% of 50 DAV
50 DAV is 314,000
|
$87.21
-7.27%
|
5/17/2019
|
$82.19
|
PP = $87.31
|
|
MB = $91.68
|
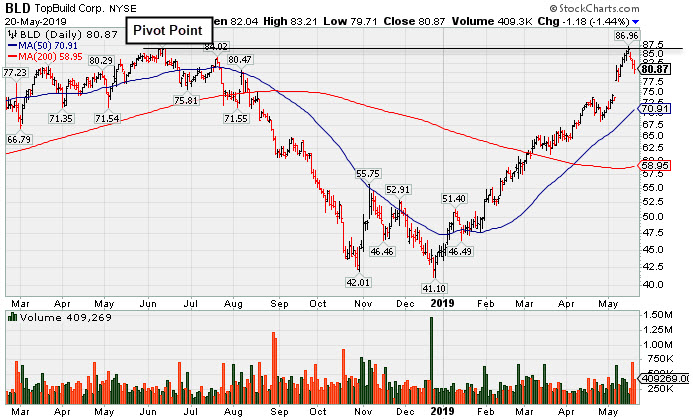
Most Recent Note - 5/20/2019 7:25:20 PM
Y - Suffered a 3rd consecutive loss today with above average volume. Encountered distributional pressure after highlighted in yellow with new pivot point cited based on its 8/12/18 high plus 10 cents in the 5/17/19 mid-day report. Subsequent gains above the pivot point backed by at least +40% above average volume may trigger a technical buy signal. Reported earnings +45% on +26% sales revenues for the Mar '19 quarter. Quarterly earnings increases have been above the +25% minimum guideline (C criteria). Annual earnings (A criteria) history has been strong and steady since turning profitable in FY '14. See the latest FSU analysis for more details and a new annotated graph.
>>> FEATURED STOCK ARTICLE : Encountered Distributional Pressure Near Prior High - 5/20/2019 |
View all notes |
Set NEW NOTE alert |
Company Profile |
SEC
News |
Chart |
Request a new note
C
A
S
I |
TEAM
-
NASDAQ
Atlassian Corp Plc Cl A
Comp Sftwr-Spec Enterprs
|
$124.55
|
-4.60
-3.56% |
$127.33
|
1,916,317
104.15% of 50 DAV
50 DAV is 1,840,000
|
$131.99
-5.64%
|
4/16/2019
|
$114.77
|
PP = $116.80
|
|
MB = $122.64
|
Most Recent Note - 5/20/2019 1:27:49 PM
G - Color code is changed to green while perched near its all-time high and above its "max buy" level. Reported earnings +133% on +38% sales revenues for the Mar '19 quarter, continuing its strong earnings track record.
>>> FEATURED STOCK ARTICLE : Perched Near High Enduring Distributional Pressure - 4/9/2019 |
View all notes |
Set NEW NOTE alert |
Company Profile |
SEC
News |
Chart |
Request a new note
C
A
S
I |
GLOB
-
NYSE
Globant SA
Computer-Tech Services
|
$84.62
|
+0.58
0.69% |
$86.14
|
192,339
86.64% of 50 DAV
50 DAV is 222,000
|
$86.97
-2.70%
|
2/15/2019
|
$69.35
|
PP = $70.00
|
|
MB = $73.50
|
Most Recent Note - 5/17/2019 7:06:01 PM
G - Pulled back today with lighter volume after 3 consecutive gains marked by above average volume. Its 50 DMA line ($77.18) defines important support above the prior high ($74). Violations would raise concerns and trigger technical sell signals. Reported earnings +32% on +22% sales revenues for the quarter ended March 31st, 2019 versus the year ago period, continuing its strong earning track record.
>>> FEATURED STOCK ARTICLE : Earnings News Due While Perched Near All-Time High - 5/7/2019 |
View all notes |
Set NEW NOTE alert |
Company Profile |
SEC
News |
Chart |
Request a new note
C
A
S
I |