You are not logged in.
This means you
CAN ONLY VIEW reports that were published prior to Friday, February 23, 2024.
You
MUST UPGRADE YOUR MEMBERSHIP if you want to see any current reports.
AFTER MARKET UPDATE - MONDAY, MAY 18TH, 2020
Previous After Market Report Next After Market Report >>>
|
|
|
|
DOW |
+911.95 |
24,597.37 |
+3.85% |
|
Volume |
1,198,530,156 |
-13% |
|
Volume |
4,288,793,300 |
+2% |
|
NASDAQ |
+220.27 |
9,234.83 |
+2.44% |
|
Advancers |
2,601 |
89% |
|
Advancers |
2,668 |
82% |
|
S&P 500 |
+90.21 |
2,953.91 |
+3.15% |
|
Decliners |
313 |
11% |
|
Decliners |
598 |
18% |
|
Russell 2000 |
+76.70 |
1,333.69 |
+6.10% |
|
52 Wk Highs |
45 |
|
|
52 Wk Highs |
107 |
|
|
S&P 600 |
+51.34 |
763.72 |
+7.21% |
|
52 Wk Lows |
8 |
|
|
52 Wk Lows |
11 |
|
|
 |
Breadth Positive as Major Indices Rally With More Leadership
Kenneth J. Gruneisen - Passed the CAN SLIM® Master's Exam
The S&P 500 rallied 3.2%, its best day since early April and rebounding from its worst weekly performance in almost two months. The benchmark index closed within 12.8% of its all-time high reached on February 19. The Dow climbed 911 points, while the Nasdaq Composite advanced 2.4%. Breadth was positive as advancers led decliners by an 8-1 margin on the NYSE and 4-1 on the Nasdaq exchange. The reported volume totals were mixed, lighter than the prior session on the NYSE and higher on the Nasdaq exchange. There were 60 high-ranked companies from the Leaders List that hit new 52-week highs and were listed on the BreakOuts Page, versus 31 on the prior session. New 52-week highs totals expanded and outnumbered shrinking new 52-week lows totals on the NYSE and on the Nasdaq exchange. The major indices are in a confirmed uptrend (M criteria). Any sustainable rally requires a healthy crop of new leaders, so the improvement in new highs totals of late is an encouraging sign. Charts used courtesy of www.stockcharts.com
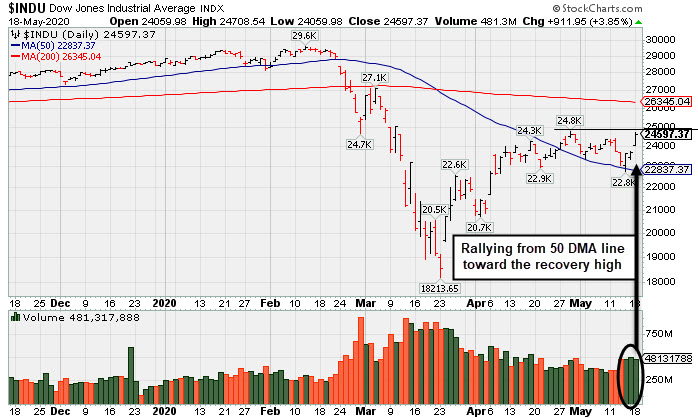
PICTURED: The Dow Jones Industrial Average posted a 3rd consecutive gain, rallying from support at its 50-day moving average (DMA) line toward its recovery high.
Stock finished firmly higher on Monday amid optimism surrounding a potential coronavirus vaccine. Shares of biotech company Moderna (MRNA +19.96%) rallied on news of positive early-stage trial results.
Investors focused on continued efforts to ease COVID-19 lockdowns and reopen businesses. Additionally, recent comments from Fed Chair Jerome Powell helped lift sentiment. Over the weekend, he reiterated that policymakers are “not out of ammunition” to help support the economy. Perceived safe haven assets declined, with the yield on the 10-year note up nine basis points to 0.72%. COMEX gold slipped from a seven-year high, while a gauge of the U.S. dollar slid 0.8%. On the data front, today’s lone economic release from the NAHB showed homebuilder sentiment improved more than anticipated in May.
All 11 S&P 500 sectors closed in positive territory, with Energy stocks pacing gains as oil prices jumped to the highest level in two months. WTI crude added more than 10% to end the day above $30.00/barrel for the first time since March. Industrials also outperformed, climbing 6.6%. Beleaguered travel-related companies were among the standouts, with United Airlines (UAL +21.13%) and Expedia Group (EXPE +18.62%) each climbing considerably. Several cruise line and hotel operators were also among the top performers. Health Care shares lagged on a relative basis, still advancing 0.9%. |
 Kenneth J. Gruneisen started out as a licensed stockbroker in August 1987, a couple of months prior to the historic stock market crash that took the Dow Jones Industrial Average down -22.6% in a single day. He has published daily fact-based fundamental and technical analysis on high-ranked stocks online for two decades. Through FACTBASEDINVESTING.COM, Kenneth provides educational articles, news, market commentary, and other information regarding proven investment systems that work in good times and bad.
Comments contained in the body of this report are technical opinions only and are not necessarily those of Gruneisen Growth Corp. The material herein has been obtained from sources believed to be reliable and accurate, however, its accuracy and completeness cannot be guaranteed. Our firm, employees, and customers may effect transactions, including transactions contrary to any recommendation herein, or have positions in the securities mentioned herein or options with respect thereto. Any recommendation contained in this report may not be suitable for all investors and it is not to be deemed an offer or solicitation on our part with respect to the purchase or sale of any securities. |
|
 |
Energy and Financial Groups Led Big Gainers
Kenneth J. Gruneisen - Passed the CAN SLIM® Master's Exam
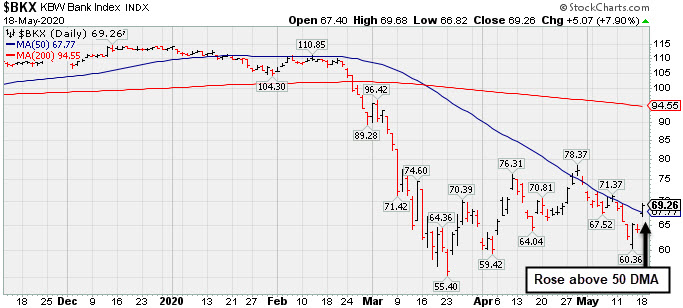
The Bank Index ($BKX +7.90%) and the Broker/Dealer Index ($XBD +6.13%) both gained considerable ground while the Retail Index ($RLX +2.13%) also helped lift the major indices. The tech sector had a positive bias as the Semiconductor Index ($SOX +4.80%) set a strong pace and the Networking Index ($NWX +4.15%) and Biotech Index ($BTK +1.55%) both rose. Energy-linked groups had a very positive bias as the Oil Services Index ($OSX +12.45%) and Integrated Oil Index ($XOI +8.51%) both rallied for big gains Meanwhile, the Gold & Silver Index ($XAU -1.48%) posted a standout loss. PICTURED: The Bank Index ($BKX +7.90%) posted a big gain on Monday rebounding above its downward sloping 50-day moving average (DMA) line. The technical improvement is encouraging news. It was just shown on Friday slumping toward the March low, and members were reminded that further deterioration could be an ominous sign. The financial indices are reliable "leading indicators" for the broader market outlook.
| Oil Services |
$OSX |
30.96 |
+3.43 |
+12.46% |
-60.45% |
| Integrated Oil |
$XOI |
794.81 |
+62.32 |
+8.51% |
-37.44% |
| Semiconductor |
$SOX |
1,782.06 |
+81.17 |
+4.77% |
-3.65% |
| Networking |
$NWX |
519.44 |
+20.69 |
+4.15% |
-10.96% |
| Broker/Dealer |
$XBD |
244.75 |
+14.14 |
+6.13% |
-15.71% |
| Retail |
$RLX |
2,736.26 |
+57.11 |
+2.13% |
+11.72% |
| Gold & Silver |
$XAU |
124.76 |
-1.85 |
-1.46% |
+16.69% |
| Bank |
$BKX |
69.29 |
+5.10 |
+7.95% |
-38.88% |
| Biotech |
$BTK |
5,581.40 |
+84.96 |
+1.55% |
+10.14% |
|
|
|
 |
Pullback on Lighter Volume After Gain For New High on Big Volume
Kenneth J. Gruneisen - Passed the CAN SLIM® Master's Exam
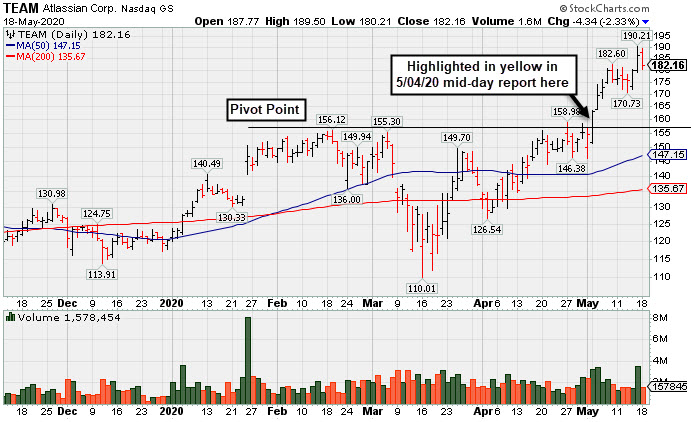
Atlassian Corp (TEAM -$4.34 or -2.33% to $182.16) pulled back today with lighter volume following a gain with above average volume for a new all-time high on the prior session. It has been repeatedly noted as "extended from the previously noted base." Prior highs in the $156 area define initial support to watch on pullbacks.
TEAM has a 98 Earnings Per Share rating, but fundamental concerns were raised after it recently reported earnings +19% on +33% sales revenues for the Mar '20 quarter, breaking a strong track record of +25% earnings increases (C criteria). This Australia - based software developer had shown 9 consecutive quarterly comparisons above the +25% minimum guideline (C criteria). Its annual earnings (A criteria) history has been strong since its $21 IPO on 12/10/15.
TEAM finished strong after highlighted in yellow with pivot point based on its 2/19/20 high plus 10 cents in the 5/04/20 mid-day report (read here). It hit a new all-time high with a big gain and strong close above the pivot point backed by +61% above average volume clinching a convincing technical buy signal.
TEAM was last shown in the FSU section on 5/04/20 with an annotated graph under the headline, "Volume-Driven Gain For New All-Time High". The number of top-rated funds owning its shares rose from 266 in Sep '17 to 725 in Mar '20, a reassuring sign concerning the I criteria. It has a Timeliness Rating of A and Sponsorship Rating of A. Its current Up/Down Volume Ratio of 1.3 is an unbiased indication its shares have been neutral concerning accumulation or distribution over the past 50 days. |
|
|
Color Codes Explained :
Y - Better candidates highlighted by our
staff of experts.
G - Previously featured
in past reports as yellow but may no longer be buyable under the
guidelines.
***Last / Change / Volume data in this table is the closing quote data***
Symbol/Exchange
Company Name
Industry Group |
PRICE |
CHANGE
(%Change) |
Day High |
Volume
(% DAV)
(% 50 day avg vol) |
52 Wk Hi
% From Hi |
Featured
Date |
Price
Featured |
Pivot Featured |
|
Max Buy |
 FTNT
-
NASDAQ
FTNT
-
NASDAQ
Fortinet Inc
Computer Sftwr-Security
|
$144.67
|
+1.24
0.86% |
$148.85
|
2,503,159
100.17% of 50 DAV
50 DAV is 2,499,000
|
$144.03
0.44%
|
5/7/2020
|
$134.40
|
PP = $121.92
|
|
MB = $128.02
|
Most Recent Note - 5/15/2020 5:16:11 PM
G - Hit another new all-time high today with light volume behind a big gain, getting more extended from the prior base. Prior highs in the $121 area define initial support to watch on pullbacks.
>>> FEATURED STOCK ARTICLE : Gap Up and Big Volume-Driven Gain for Computer Security Firm - 5/7/2020 |
View all notes |
Set NEW NOTE alert |
Company Profile |
SEC
News |
Chart |
Request a new note
C
A
S
I |
SPNS
-
NASDAQ
Sapiens Intl Corp
COMPUTER SOFTWARE and SERVICES - Technical and System Software
|
$25.49
|
+1.34
5.55% |
$26.14
|
195,223
125.95% of 50 DAV
50 DAV is 155,000
|
$29.24
-12.82%
|
5/11/2020
|
$27.80
|
PP = $26.96
|
|
MB = $28.31
|
 Most Recent Note - 5/18/2020 5:16:43 PM
G - Gapped up today for a gain with average volume. Last week it reported Mar '20 quarterly earnings +18% on +18% sales revenues versus the year ago period, below the +25% minimum guideline (C criteria), raising fundamental concerns. Encountered distributional pressure since highlighted in the 5/11/20 mid-day report with pivot point cited based on its 1/24/20 high plus 10 cents.
>>> FEATURED STOCK ARTICLE : Encountered Distributional Pressure After Hitting New High - 5/11/2020 |
View all notes |
Set NEW NOTE alert |
Company Profile |
SEC
News |
Chart |
Request a new note
C
A
S
I |
EBS
-
NYSE
Emergent Biosolutions
DRUGS - Biotechnology
|
$89.52
|
+6.17
7.40% |
$89.90
|
674,552
116.10% of 50 DAV
50 DAV is 581,000
|
$90.00
-0.53%
|
4/24/2020
|
$72.10
|
PP = $73.99
|
|
MB = $77.69
|
Most Recent Note - 5/15/2020 5:21:18 PM
G - Posted a gain today with light volume for the second-best ever close, capping an 8-week winning streak. It is extended from the previously noted base. Prior highs in the $71-73 area define initial support to watch on pullbacks. Fundamentals remain strong.
>>> FEATURED STOCK ARTICLE : Light Volume Gain for New High Close Caps 7th Straight Weekly Gain - 5/8/2020 |
View all notes |
Set NEW NOTE alert |
Company Profile |
SEC
News |
Chart |
Request a new note
C
A
S
I |
TREX
-
NYSE
Trex Company Inc
MATERIALS and CONSTRUCTION - General Building Materials
|
$122.76
|
+7.81
6.79% |
$123.61
|
750,441
69.29% of 50 DAV
50 DAV is 1,083,000
|
$118.72
3.40%
|
5/5/2020
|
$109.05
|
PP = $111.95
|
|
MB = $117.55
|
Most Recent Note - 5/18/2020 5:21:05 PM
G - Gapped up today and its color code is changed to green after rising above the "max buy" level, hitting a new all-time high with volume below average. Recent gains above the pivot point lacked the great volume conviction indicative of institutional demand. Prior highs in the $111 area define initial support to watch. Has a new CEO as of 4/29/20. Fundamentals remain strong.
>>> FEATURED STOCK ARTICLE : Gapped Up for Volume-Driven Gain and Hit a New All-Time High - 5/5/2020 |
View all notes |
Set NEW NOTE alert |
Company Profile |
SEC
News |
Chart |
Request a new note
C
A
S
I |
NFLX
-
NASDAQ
Netflix Inc
SPECIALTY RETAIL - Music and Video Stores
|
$452.58
|
-1.61
-0.35% |
$456.36
|
7,762,562
82.48% of 50 DAV
50 DAV is 9,412,000
|
$455.00
-0.53%
|
5/14/2020
|
$441.95
|
PP = $449.62
|
|
MB = $472.10
|
Most Recent Note - 5/15/2020 5:19:26 PM
Y - Hit a new all-time high and closed near the session high with today's 3rd consecutive gain backed by below average volume. Color code was changed to yellow with new pivot point cited based on its 4/16/20 high plus 10 cents. Recently formed an advanced "3-weeks tight" base or what may also be considered a 4-week "square box" base. Gains above the pivot point must be backed by at least +40% above average volume to trigger a proper new (or add-on) technical buy signal. Prior highs in the $393 area acted as support following the recent breakout. Fundamentals remain strong.
>>> FEATURED STOCK ARTICLE : Prior Highs Acted as Support Following Recent Breakout - 5/6/2020 |
View all notes |
Set NEW NOTE alert |
Company Profile |
SEC
News |
Chart |
Request a new note
C
A
S
I |
Symbol/Exchange
Company Name
Industry Group |
PRICE |
CHANGE
(%Change) |
Day High |
Volume
(% DAV)
(% 50 day avg vol) |
52 Wk Hi
% From Hi |
Featured
Date |
Price
Featured |
Pivot Featured |
|
Max Buy |
NOW
-
NYSE
Servicenow Inc
Computer Sftwr-Enterprse
|
$374.87
|
+4.41
1.19% |
$381.78
|
1,752,789
61.80% of 50 DAV
50 DAV is 2,836,000
|
$388.50
-3.51%
|
4/30/2020
|
$343.05
|
PP = $363.05
|
|
MB = $381.20
|
Most Recent Note - 5/14/2020 5:34:51 PM
Y - Posted a gain today after briefly undercutting the prior high. Subsequent gains above the pivot point should be backed by at least +40% above average volume to help clinch a proper technical buy signal. See the latest FSU analysis for more details and a new annotated graph.
>>> FEATURED STOCK ARTICLE : Consolidating Near Prior High After Wedging Into New High Ground - 5/14/2020 |
View all notes |
Set NEW NOTE alert |
Company Profile |
SEC
News |
Chart |
Request a new note
C
A
S
I |
QLYS
-
NASDAQ
Qualys Inc
Computer Sftwr-Security
|
$108.75
|
+2.94
2.78% |
$109.24
|
559,482
95.15% of 50 DAV
50 DAV is 588,000
|
$111.79
-2.72%
|
4/9/2020
|
$100.44
|
PP = $97.22
|
|
MB = $102.08
|
Most Recent Note - 5/14/2020 6:02:33 PM
G - Color code is changed to green again after a "positive reversal" today and gain back above its "max buy" level. Reported Mar '20 quarterly earnings +33% on +14% sales revenues versus the year ago period, its 12th consecutive quarterly earnings increase above the +25% minimum guideline (C criteria). Prior highs in the $97 area recently acted as support. See the latest FSU analysis for more details and an annotated graph.
>>> FEATURED STOCK ARTICLE : Quiet Pullback Just Below "Max Buy" Level - 5/13/2020 |
View all notes |
Set NEW NOTE alert |
Company Profile |
SEC
News |
Chart |
Request a new note
C
A
S
I |
TEAM
-
NASDAQ
Atlassian Corp Plc Cl A
Comp Sftwr-Spec Enterprs
|
$182.16
|
-4.34
-2.33% |
$189.50
|
1,578,243
75.70% of 50 DAV
50 DAV is 2,085,000
|
$190.21
-4.23%
|
5/4/2020
|
$159.70
|
PP = $156.22
|
|
MB = $164.03
|
Most Recent Note - 5/18/2020 5:19:12 PM
G - Pulled back with lighter volume today following a gain with above average volume for a new all-time high on the prior session. Extended from the previously noted base, and prior highs in the $156 area define initial support to watch on pullbacks. See the latest FSU analysis for more details and a new annotated graph.
>>> FEATURED STOCK ARTICLE : Pullback on Lighter Volume After Gain For New High on Big Volume - 5/18/2020 |
View all notes |
Set NEW NOTE alert |
Company Profile |
SEC
News |
Chart |
Request a new note
C
A
S
I |
AAXN
-
NASDAQ
Axon Enterprise Inc
Security/Sfty
|
$74.86
|
+0.95
1.29% |
$79.00
|
659,202
77.28% of 50 DAV
50 DAV is 853,000
|
$90.10
-16.91%
|
5/8/2020
|
$84.86
|
PP = $90.20
|
|
MB = $94.71
|
Most Recent Note - 5/15/2020 5:27:55 PM
Y - Pulled back for a 5th consecutive loss with ever decreasing volume. A rebound and subsequent volume-driven gains above the pivot point are needed to trigger a technical buy signal.
>>> FEATURED STOCK ARTICLE : Security/Safety Firm Perched Near 52-Week High After Gap Up - 5/12/2020 |
View all notes |
Set NEW NOTE alert |
Company Profile |
SEC
News |
Chart |
Request a new note
C
A
S
I |
|
|
|
THESE ARE NOT BUY RECOMMENDATIONS!
Comments contained in the body of this report are technical
opinions only. The material herein has been obtained
from sources believed to be reliable and accurate, however,
its accuracy and completeness cannot be guaranteed.
This site is not an investment advisor, hence it does
not endorse or recommend any securities or other investments.
Any recommendation contained in this report may not
be suitable for all investors and it is not to be deemed
an offer or solicitation on our part with respect to
the purchase or sale of any securities. All trademarks,
service marks and trade names appearing in this report
are the property of their respective owners, and are
likewise used for identification purposes only.
This report is a service available
only to active Paid Premium Members.
You may opt-out of receiving report notifications
at any time. Questions or comments may be submitted
by writing to Premium Membership Services 665 S.E. 10 Street, Suite 201 Deerfield Beach, FL 33441-5634 or by calling 1-800-965-8307
or 954-785-1121.
|
|
|