You are not logged in.
This means you
CAN ONLY VIEW reports that were published prior to Sunday, February 25, 2024.
You
MUST UPGRADE YOUR MEMBERSHIP if you want to see any current reports.
AFTER MARKET UPDATE - FRIDAY, MAY 15TH, 2020
Previous After Market Report Next After Market Report >>>
|
|
|
|
DOW |
+60.08 |
23,685.42 |
+0.25% |
|
Volume |
1,378,487,999 |
+30% |
|
Volume |
4,196,703,200 |
+7% |
|
NASDAQ |
+74.68 |
9,018.40 |
+0.83% |
|
Advancers |
1,634 |
57% |
|
Advancers |
1,994 |
62% |
|
S&P 500 |
+11.20 |
2,863.70 |
+0.39% |
|
Decliners |
1,233 |
43% |
|
Decliners |
1,236 |
38% |
|
Russell 2000 |
+19.44 |
1,256.99 |
+1.57% |
|
52 Wk Highs |
29 |
|
|
52 Wk Highs |
58 |
|
|
S&P 600 |
+9.21 |
712.38 |
+1.31% |
|
52 Wk Lows |
17 |
|
|
52 Wk Lows |
22 |
|
|
 |
Indices Ended Volatile Session Higher, Down for the Week
Kenneth J. Gruneisen - Passed the CAN SLIM® Master's Exam
The Dow added 60 points after swinging between a decline of more than 270 points and a gain of more than 100 points. The S&P 500 and Nasdaq Composite closed up 0.4% and 0.8%, respectively. For the week, the Dow fell 2.7% and the S&P 500 shed 2.3%, its worst week since mid-March. The Nasdaq Composite posted a weekly loss of 1.2%. Breadth was positive as advancers led decliners by a 4-3 margin on the NYSE and 3-2 on the Nasdaq exchange. The reported volume totals were higher than the prior session on the NYSE and on the Nasdaq exchange, indicative of increasing institutional buying demand. There were 31 high-ranked companies from the Leaders List that hit new 52-week highs and were listed on the BreakOuts Page, versus 9 on the prior session. New 52-week highs totals outnumbered new 52-week lows totals on the NYSE and on the Nasdaq exchange. The major indices are in a confirmed uptrend (M criteria). Any sustainable rally requires a healthy crop of new leaders, so the improvement in new highs totals on Friday was an encouraging sign. Charts used courtesy of www.stockcharts.com
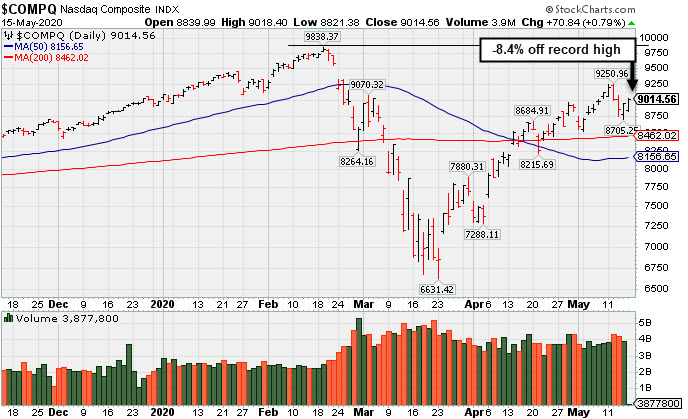
PICTURED: The Nasdaq Composite Index is consolidating -8.4% off its record high.
Stocks finished higher in volatile trading on Friday, despite escalating U.S.-China trade tensions and disappointing data updates. Reports indicated that the U.S. was essentially blocking shipments of semiconductors to Chinese telecom giant Huawei Technologies. Beijing responded by threatening to investigate or impose restrictions on major U.S. companies, such as Qualcomm, Cisco Systems, Apple, and Boeing.
On the data front, retail sales tumbled 16.4% in April, nearly doubling from the prior month’s 8.3% slump that had previously been the worst on record. Additionally, U.S. manufacturing output and industrial production figures also fell by unprecedented amounts. Separately, an update from the University of Michigan showed consumer sentiment improving slightly this month. Treasuries were little changed, with the yield on the 10-year note steady at 0.63%. In commodities, WTI crude climbed 7.3% to $29.56/barrel, capping its third-straight weekly advance.
Six of 11 S&P 500 sectors closed in positive territory, with the Consumer Discretionary and Communication Services groups pacing gains. Utilities lagged the most, while Financials also lost steam from Thursday’s rally. In earnings, Applied Materials declined 4.4% after missing estimates on both the top and bottom line. |
 Kenneth J. Gruneisen started out as a licensed stockbroker in August 1987, a couple of months prior to the historic stock market crash that took the Dow Jones Industrial Average down -22.6% in a single day. He has published daily fact-based fundamental and technical analysis on high-ranked stocks online for two decades. Through FACTBASEDINVESTING.COM, Kenneth provides educational articles, news, market commentary, and other information regarding proven investment systems that work in good times and bad.
Comments contained in the body of this report are technical opinions only and are not necessarily those of Gruneisen Growth Corp. The material herein has been obtained from sources believed to be reliable and accurate, however, its accuracy and completeness cannot be guaranteed. Our firm, employees, and customers may effect transactions, including transactions contrary to any recommendation herein, or have positions in the securities mentioned herein or options with respect thereto. Any recommendation contained in this report may not be suitable for all investors and it is not to be deemed an offer or solicitation on our part with respect to the purchase or sale of any securities. |
|
 |
Gold & Silver, Retail, Biotech, and Networking Indexes Rose
Kenneth J. Gruneisen - Passed the CAN SLIM® Master's Exam
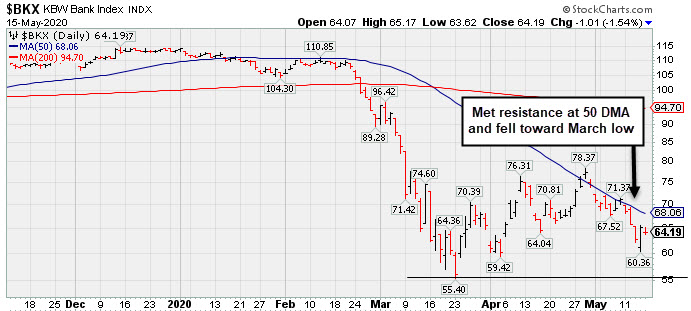
The Bank Index ($BKX -1.54%) and the Broker/Dealer Index ($XBD -0.43%) both lost ground while the Retail Index ($RLX +1.33%) helped lift the major indices. The tech sector was mixed as the Networking Index ($NWX +0.85%) and the Biotech Index ($BTK +2.72%) both rose, meanwhile the Semiconductor Index ($SOX -2.19%) pulled back. Energy-linked groups had a slightly negative bias as the Oil Services Index ($OSX -0.85%), Integrated Oil Index ($XOI -0.17%) both edged lower. The Gold & Silver Index ($XAU +4.42%) posted a standout gain. PICTURED: The Bank Index ($BKX -1.54%) met resistance and has been unable to rebound above its downward sloping 50-day moving average (DMA) line. As it is slumping toward the March low, any further deterioration could be an ominous sign, since the financial indices are reliable "leading indicators".
| Oil Services |
$OSX |
27.53 |
-0.23 |
-0.83% |
-64.84% |
| Integrated Oil |
$XOI |
732.50 |
-1.28 |
-0.17% |
-42.35% |
| Semiconductor |
$SOX |
1,701.31 |
-37.74 |
-2.17% |
-8.02% |
| Networking |
$NWX |
498.75 |
+4.18 |
+0.85% |
-14.51% |
| Broker/Dealer |
$XBD |
230.61 |
-1.00 |
-0.43% |
-20.58% |
| Retail |
$RLX |
2,679.15 |
+35.16 |
+1.33% |
+9.39% |
| Gold & Silver |
$XAU |
126.63 |
+5.38 |
+4.44% |
+18.43% |
| Bank |
$BKX |
64.19 |
-1.01 |
-1.55% |
-43.38% |
| Biotech |
$BTK |
5,496.44 |
+144.93 |
+2.71% |
+8.47% |
|
|
|
 |
Featured Stocks
Kenneth J. Gruneisen - Passed the CAN SLIM® Master's Exam
Below is the summary list of all currently Featured Stocks with the most recent notes. Click the FEATURED STOCK ARTICLE headline links for more detailed analysis and annotated graphs. As leadership improves the number of stocks covered in this area should be expected to increase gradually, as superior candidates are added to the Featured Stocks list on a case-by-case basis. Feel free to contact us if you have a need for any additional information. |
|
|
Color Codes Explained :
Y - Better candidates highlighted by our
staff of experts.
G - Previously featured
in past reports as yellow but may no longer be buyable under the
guidelines.
***Last / Change / Volume data in this table is the closing quote data***
Symbol/Exchange
Company Name
Industry Group |
PRICE |
CHANGE
(%Change) |
Day High |
Volume
(% DAV)
(% 50 day avg vol) |
52 Wk Hi
% From Hi |
Featured
Date |
Price
Featured |
Pivot Featured |
|
Max Buy |
 FTNT
-
NASDAQ
FTNT
-
NASDAQ
Fortinet Inc
Computer Sftwr-Security
|
$143.43
|
+5.37
3.89% |
$144.03
|
1,420,661
56.89% of 50 DAV
50 DAV is 2,497,000
|
$143.41
0.01%
|
5/7/2020
|
$134.40
|
PP = $121.92
|
|
MB = $128.02
|
 Most Recent Note - 5/15/2020 5:16:11 PM
G - Hit another new all-time high today with light volume behind a big gain, getting more extended from the prior base. Prior highs in the $121 area define initial support to watch on pullbacks.
>>> FEATURED STOCK ARTICLE : Gap Up and Big Volume-Driven Gain for Computer Security Firm - 5/7/2020 |
View all notes |
Set NEW NOTE alert |
Company Profile |
SEC
News |
Chart |
Request a new note
C
A
S
I |
SPNS
-
NASDAQ
Sapiens Intl Corp
COMPUTER SOFTWARE and SERVICES - Technical and System Software
|
$24.15
|
+0.08
0.33% |
$24.78
|
236,699
154.71% of 50 DAV
50 DAV is 153,000
|
$29.24
-17.41%
|
5/11/2020
|
$27.80
|
PP = $26.96
|
|
MB = $28.31
|
Most Recent Note - 5/14/2020 11:22:59 AM
G - Color code is changed to green after it reported Mar '20 quarterly earnings +18% on +18% sales revenues versus the year ago period, below the +25% minimum guideline (C criteria), raising fundamental concerns. Volume and volatility often increase near earnings news. Today's 3rd consecutive loss with above average volume raises more concerns, technically. Finished weak after highlighted in yellow in the 5/11/20 mid-day report with pivot point cited based on its 1/24/20 high plus 10 cents.
>>> FEATURED STOCK ARTICLE : Encountered Distributional Pressure After Hitting New High - 5/11/2020 |
View all notes |
Set NEW NOTE alert |
Company Profile |
SEC
News |
Chart |
Request a new note
C
A
S
I |
EBS
-
NYSE
Emergent Biosolutions
DRUGS - Biotechnology
|
$83.35
|
+2.51
3.10% |
$83.44
|
455,851
78.60% of 50 DAV
50 DAV is 580,000
|
$90.00
-7.39%
|
4/24/2020
|
$72.10
|
PP = $73.99
|
|
MB = $77.69
|
Most Recent Note - 5/15/2020 5:21:18 PM
G - Posted a gain today with light volume for the second-best ever close, capping an 8-week winning streak. It is extended from the previously noted base. Prior highs in the $71-73 area define initial support to watch on pullbacks. Fundamentals remain strong.
>>> FEATURED STOCK ARTICLE : Light Volume Gain for New High Close Caps 7th Straight Weekly Gain - 5/8/2020 |
View all notes |
Set NEW NOTE alert |
Company Profile |
SEC
News |
Chart |
Request a new note
C
A
S
I |
TREX
-
NYSE
Trex Company Inc
MATERIALS and CONSTRUCTION - General Building Materials
|
$114.95
|
+2.68
2.39% |
$116.40
|
518,899
47.74% of 50 DAV
50 DAV is 1,087,000
|
$118.72
-3.18%
|
5/5/2020
|
$109.05
|
PP = $111.95
|
|
MB = $117.55
|
Most Recent Note - 5/15/2020 5:26:37 PM
Y - Posted a gain today with below average volume, finishing -3.2% off the all-time high hit on Tuesday. Recent gains above the pivot point lacked the great volume conviction indicative of institutional demand. Prior highs in the $111 area define initial support to watch. Has a new CEO as of 4/29/20. Fundamentals remain strong.
>>> FEATURED STOCK ARTICLE : Gapped Up for Volume-Driven Gain and Hit a New All-Time High - 5/5/2020 |
View all notes |
Set NEW NOTE alert |
Company Profile |
SEC
News |
Chart |
Request a new note
C
A
S
I |
NFLX
-
NASDAQ
Netflix Inc
SPECIALTY RETAIL - Music and Video Stores
|
$454.19
|
+12.24
2.77% |
$455.00
|
7,181,548
76.06% of 50 DAV
50 DAV is 9,442,000
|
$452.38
0.40%
|
5/14/2020
|
$441.95
|
PP = $449.62
|
|
MB = $472.10
|
Most Recent Note - 5/15/2020 5:19:26 PM
Y - Hit a new all-time high and closed near the session high with today's 3rd consecutive gain backed by below average volume. Color code was changed to yellow with new pivot point cited based on its 4/16/20 high plus 10 cents. Recently formed an advanced "3-weeks tight" base or what may also be considered a 4-week "square box" base. Gains above the pivot point must be backed by at least +40% above average volume to trigger a proper new (or add-on) technical buy signal. Prior highs in the $393 area acted as support following the recent breakout. Fundamentals remain strong.
>>> FEATURED STOCK ARTICLE : Prior Highs Acted as Support Following Recent Breakout - 5/6/2020 |
View all notes |
Set NEW NOTE alert |
Company Profile |
SEC
News |
Chart |
Request a new note
C
A
S
I |
Symbol/Exchange
Company Name
Industry Group |
PRICE |
CHANGE
(%Change) |
Day High |
Volume
(% DAV)
(% 50 day avg vol) |
52 Wk Hi
% From Hi |
Featured
Date |
Price
Featured |
Pivot Featured |
|
Max Buy |
NOW
-
NYSE
Servicenow Inc
Computer Sftwr-Enterprse
|
$370.46
|
+2.63
0.72% |
$372.45
|
2,479,596
87.77% of 50 DAV
50 DAV is 2,825,000
|
$388.50
-4.64%
|
4/30/2020
|
$343.05
|
PP = $363.05
|
|
MB = $381.20
|
Most Recent Note - 5/14/2020 5:34:51 PM
Y - Posted a gain today after briefly undercutting the prior high. Subsequent gains above the pivot point should be backed by at least +40% above average volume to help clinch a proper technical buy signal. See the latest FSU analysis for more details and a new annotated graph.
>>> FEATURED STOCK ARTICLE : Consolidating Near Prior High After Wedging Into New High Ground - 5/14/2020 |
View all notes |
Set NEW NOTE alert |
Company Profile |
SEC
News |
Chart |
Request a new note
C
A
S
I |
QLYS
-
NASDAQ
Qualys Inc
Computer Sftwr-Security
|
$105.81
|
+1.22
1.17% |
$106.16
|
583,376
100.24% of 50 DAV
50 DAV is 582,000
|
$111.79
-5.35%
|
4/9/2020
|
$100.44
|
PP = $97.22
|
|
MB = $102.08
|
Most Recent Note - 5/14/2020 6:02:33 PM
G - Color code is changed to green again after a "positive reversal" today and gain back above its "max buy" level. Reported Mar '20 quarterly earnings +33% on +14% sales revenues versus the year ago period, its 12th consecutive quarterly earnings increase above the +25% minimum guideline (C criteria). Prior highs in the $97 area recently acted as support. See the latest FSU analysis for more details and an annotated graph.
>>> FEATURED STOCK ARTICLE : Quiet Pullback Just Below "Max Buy" Level - 5/13/2020 |
View all notes |
Set NEW NOTE alert |
Company Profile |
SEC
News |
Chart |
Request a new note
C
A
S
I |
TEAM
-
NASDAQ
Atlassian Corp Plc Cl A
Comp Sftwr-Spec Enterprs
|
$186.50
|
+6.71
3.73% |
$190.21
|
3,503,099
171.47% of 50 DAV
50 DAV is 2,043,000
|
$182.60
2.14%
|
5/4/2020
|
$159.70
|
PP = $156.22
|
|
MB = $164.03
|
Most Recent Note - 5/15/2020 5:22:57 PM
G - Posted a big gain today with above average volume for a new all-time high, getting more extended from the previously noted base. Prior highs in the $156 area define initial support to watch on pullbacks.
>>> FEATURED STOCK ARTICLE : Volume-Driven Gain For New All-Time High - 5/4/2020 |
View all notes |
Set NEW NOTE alert |
Company Profile |
SEC
News |
Chart |
Request a new note
C
A
S
I |
AAXN
-
NASDAQ
Axon Enterprise Inc
Security/Sfty
|
$73.91
|
-1.69
-2.24% |
$77.75
|
569,443
66.37% of 50 DAV
50 DAV is 858,000
|
$90.10
-17.97%
|
5/8/2020
|
$84.86
|
PP = $90.20
|
|
MB = $94.71
|
Most Recent Note - 5/15/2020 5:27:55 PM
Y - Pulled back for a 5th consecutive loss with ever decreasing volume. A rebound and subsequent volume-driven gains above the pivot point are needed to trigger a technical buy signal.
>>> FEATURED STOCK ARTICLE : Security/Safety Firm Perched Near 52-Week High After Gap Up - 5/12/2020 |
View all notes |
Set NEW NOTE alert |
Company Profile |
SEC
News |
Chart |
Request a new note
C
A
S
I |
|
|
|
THESE ARE NOT BUY RECOMMENDATIONS!
Comments contained in the body of this report are technical
opinions only. The material herein has been obtained
from sources believed to be reliable and accurate, however,
its accuracy and completeness cannot be guaranteed.
This site is not an investment advisor, hence it does
not endorse or recommend any securities or other investments.
Any recommendation contained in this report may not
be suitable for all investors and it is not to be deemed
an offer or solicitation on our part with respect to
the purchase or sale of any securities. All trademarks,
service marks and trade names appearing in this report
are the property of their respective owners, and are
likewise used for identification purposes only.
This report is a service available
only to active Paid Premium Members.
You may opt-out of receiving report notifications
at any time. Questions or comments may be submitted
by writing to Premium Membership Services 665 S.E. 10 Street, Suite 201 Deerfield Beach, FL 33441-5634 or by calling 1-800-965-8307
or 954-785-1121.
|
|
|