You are not logged in.
This means you
CAN ONLY VIEW reports that were published prior to Friday, February 16, 2024.
You
MUST UPGRADE YOUR MEMBERSHIP if you want to see any current reports.
AFTER MARKET UPDATE - WEDNESDAY, MAY 15TH, 2019
Previous After Market Report Next After Market Report >>>
|
|
|
|
DOW |
+115.97 |
25,648.02 |
+0.45% |
|
Volume |
723,718,710 |
-6% |
|
Volume |
1,985,449,240 |
-4% |
|
NASDAQ |
+87.66 |
7,822.15 |
+1.13% |
|
Advancers |
1,904 |
67% |
|
Advancers |
1,732 |
57% |
|
S&P 500 |
+16.55 |
2,850.96 |
+0.58% |
|
Decliners |
946 |
33% |
|
Decliners |
1,297 |
43% |
|
Russell 2000 |
+5.21 |
1,548.27 |
+0.34% |
|
52 Wk Highs |
106 |
|
|
52 Wk Highs |
83 |
|
|
S&P 600 |
+1.29 |
946.06 |
+0.14% |
|
52 Wk Lows |
63 |
|
|
52 Wk Lows |
69 |
|
|
 |
Major Indices Rose With Lighter Volume Totals
Kenneth J. Gruneisen - Passed the CAN SLIM® Master's Exam
Stocks finished higher Wednesday, reversing early session declines amid easing trade tensions. The Dow rose 115 points, while the S&P 500 added 0.6%. The Nasdaq Composite advanced 1.1%. The volume totals reported were lighter on the NYSE and on the Nasdaq exchange, indicative of lackluster institutional buying demand. Breadth was clearly positive as advancers led decliners by almost a 2-1 margin on the NYSE and 4-3 on the Nasdaq exchange. There were 27 high-ranked companies from the Leaders List that hit new 52-week highs and were listed on the BreakOuts Page, versus the total of 22 on the prior session. New 52-week highs outnumbered new 52-week lows on the NYSE and on the Nasdaq exchange. The major indices (M criteria) came under greater pressure on Monday and were noted for action indicative of a more worrisome "correction" while leadership (stocks hitting new highs) thinned. The Featured Stocks Page provides the most timely analysis on high-ranked leaders. Charts used courtesy of www.stockcharts.com
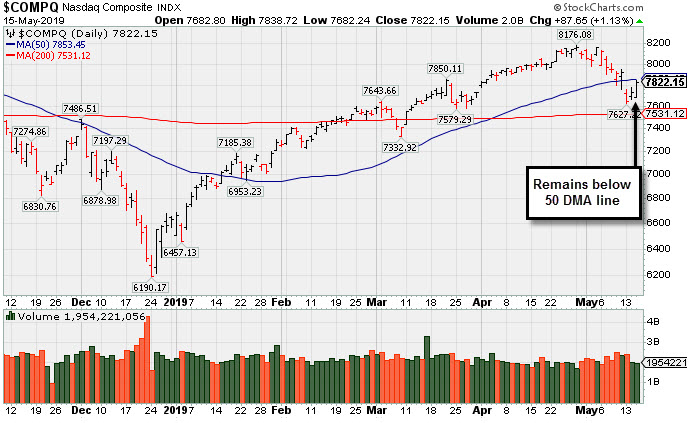
PICTURED: The Nasdaq Composite Index posted a gain with lighter volume and remains below its 50-day moving average (DMA) line after higher volume was behind damaging losses.
Investor sentiment was boosted after the Trump administration announced the proposed tariffs on European auto imports will be delayed by up to six months. Also providing a tailwind to markets were comments from Treasury Secretary Steven Mnuchin that U.S. officials will likely travel to Beijing soon to continue trade negotiations. On the data front, U.S. retail sales dipped 0.2% in April, missing expectations of a slight increase due to weak automobile sales. A separate report showed U.S. industrial production slipped 0.5% in April. The soft economic updates inspired a rally in Treasuries and inverted the yield curve between the 3-month bill and 10-year note. The yield on the benchmark note fell four basis points to 2.37% while the yield on the 3-month bill was unchanged at 2.41%.
The Communication Services sector paced the gains with Google parent Alphabet (GOOGL +4.1%) rose. Technology stocks also outperformed with semiconductor equipment maker Applied Materials (AMAT +3.7%) rising after being the subject of an analyst upgrade. Meanwhile, Financials lagged as treasury yields continued to fall. In earnings, Macy’s (M -0.5%) fell despite reporting quarterly profit and same-store sales that exceeded analyst estimates.
|
 Kenneth J. Gruneisen started out as a licensed stockbroker in August 1987, a couple of months prior to the historic stock market crash that took the Dow Jones Industrial Average down -22.6% in a single day. He has published daily fact-based fundamental and technical analysis on high-ranked stocks online for two decades. Through FACTBASEDINVESTING.COM, Kenneth provides educational articles, news, market commentary, and other information regarding proven investment systems that work in good times and bad.
Comments contained in the body of this report are technical opinions only and are not necessarily those of Gruneisen Growth Corp. The material herein has been obtained from sources believed to be reliable and accurate, however, its accuracy and completeness cannot be guaranteed. Our firm, employees, and customers may effect transactions, including transactions contrary to any recommendation herein, or have positions in the securities mentioned herein or options with respect thereto. Any recommendation contained in this report may not be suitable for all investors and it is not to be deemed an offer or solicitation on our part with respect to the purchase or sale of any securities. |
|
 |
Financials Fell as Retail and Tech Indexes Rose
Kenneth J. Gruneisen - Passed the CAN SLIM® Master's Exam
The Retail Index ($RLX +0.86%) posted a gain but the Bank Index ($BKX -1.12%) and Broker/Dealer Index ($XBD -1.02%) both ended lower. The tech sector had a positive bias as the Semiconductor Index ($SOX +0.81%), Biotech Index ($BTK +0.76%), and the Networking Index ($NWX +0.19%) each rose. Commodity-linked groups were mixed as the Gold & Silver Index ($XAU -0.13%) fell slightly while the Oil Services Index ($OSX +1.19%) and the Integrated Oil Index ($XOI +0.25%) both finished higher.
Charts courtesy of www.stockcharts.com
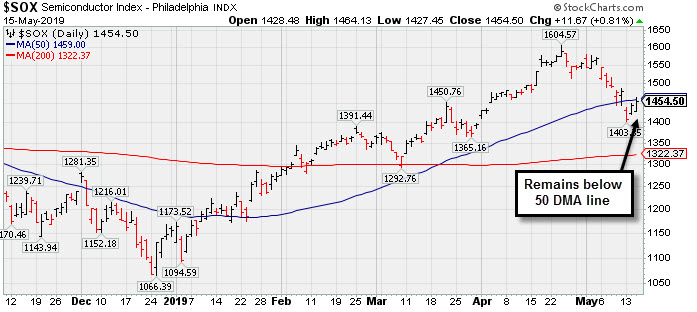
PICTURED: The Semiconductor Index ($SOX +0.81%) remains below its 50-day moving average (DMA) line.
| Oil Services |
$OSX |
88.01 |
+1.04 |
+1.20% |
+9.19% |
| Integrated Oil |
$XOI |
1,273.18 |
+3.21 |
+0.25% |
+9.84% |
| Semiconductor |
$SOX |
1,454.50 |
+11.67 |
+0.81% |
+25.91% |
| Networking |
$NWX |
569.26 |
+1.09 |
+0.19% |
+16.49% |
| Broker/Dealer |
$XBD |
263.52 |
-2.72 |
-1.02% |
+11.03% |
| Retail |
$RLX |
2,289.94 |
+19.59 |
+0.86% |
+17.35% |
| Gold & Silver |
$XAU |
68.30 |
-0.09 |
-0.13% |
-3.34% |
| Bank |
$BKX |
95.81 |
-1.09 |
-1.12% |
+11.68% |
| Biotech |
$BTK |
4,484.84 |
+33.66 |
+0.76% |
+6.25% |
|
|
|
 |
Hovering Near All Time High Extended From Any Sound Base
Kenneth J. Gruneisen - Passed the CAN SLIM® Master's Exam
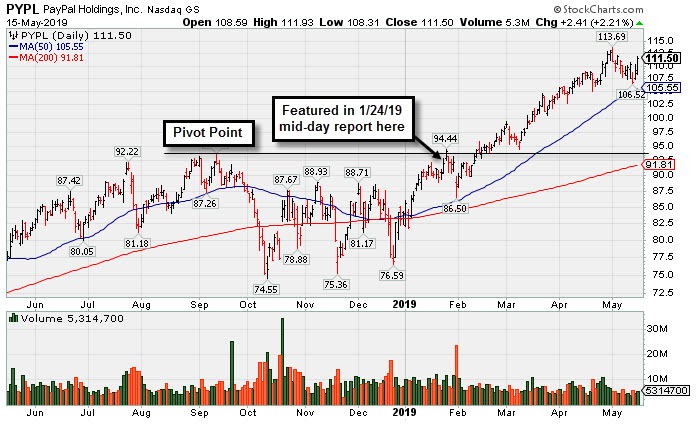
Paypal Holdings Inc (PYPL $2.41 or + 2.21% to $111.50) is consolidating above its 50-day moving average (DMA) line ($105.55) which defines near-term support to watch. Recently it reported earnings +37% on +12% sales revenues for the Mar '19 quarter, and it has now tallied 9 consecutive quarterly earnings increases above the +25% minimum guideline (C criteria).
Patient investors may watch for a new base or secondary bu point to possibly develop and be noted in the weeks ahead. PYPL was last shown in this FSU section on 4/02/19 with an annotated graph under the headline, "Extended From Base After Gains in Recent Weeks Lacking Volume." PYPL was highlighted in yellow with new pivot point cited based on its 9/13/18 high plus 10 cents in the 1/24/19 mid-day report (read here).
The high-ranked Finance - Credit Card/Payment Processing firm saw the number of top-rated funds owning its shares rise from 2,054 in Mar '17 to 2,770 in Mar '19, a reassuring sign concerning the I criteria. Its current Up/Down Volume Ratio of 1.5 is an unbiased indication its shares have been under accumulation over the past 50 days. It has a Timeliness Rating of A and Sponsorship Rating of B. |
|
|
Color Codes Explained :
Y - Better candidates highlighted by our
staff of experts.
G - Previously featured
in past reports as yellow but may no longer be buyable under the
guidelines.
***Last / Change / Volume data in this table is the closing quote data***
Symbol/Exchange
Company Name
Industry Group |
PRICE |
CHANGE
(%Change) |
Day High |
Volume
(% DAV)
(% 50 day avg vol) |
52 Wk Hi
% From Hi |
Featured
Date |
Price
Featured |
Pivot Featured |
|
Max Buy |
MLR
-
NYSE
Miller Industries Inc
AUTOMOTIVE - Auto Parts
|
$31.52
|
-0.31
-0.97% |
$31.69
|
31,313
76.37% of 50 DAV
50 DAV is 41,000
|
$35.26
-10.61%
|
11/30/2018
|
$28.35
|
PP = $29.50
|
|
MB = $30.98
|
Most Recent Note - 5/13/2019 12:39:20 PM
G - Slumping below its 50 DMA line ($32.77). Prior low ($30.38 on 3/27/19) defines the next near-term support to watch. Reported March '19 quarterly earnings +29% on +24% sales revenues versus the year ago period, above the +25% minimum earnings guideline (C criteria).
>>> FEATURED STOCK ARTICLE : Below 50-Day Average After Damaging Losses - 4/8/2019 |
View all notes |
Set NEW NOTE alert |
Company Profile |
SEC
News |
Chart |
Request a new note
C
A
S
I |
SPSC
-
NASDAQ
S P S Commerce Inc
COMPUTER SOFTWARE and SERVICES - Application Software
|
$103.74
|
+0.14
0.14% |
$104.69
|
70,012
47.95% of 50 DAV
50 DAV is 146,000
|
$115.00
-9.79%
|
3/26/2019
|
$107.12
|
PP = $113.41
|
|
MB = $119.08
|
Most Recent Note - 5/14/2019 5:12:13 PM
G - Still needs a rebound above its 50 DMA line ($105.17) for its outlook to improve. Recent low ($98.59 on 4/18/19) defines important near-term support to watch. Reported earnings +54% on +13% sales revenues for the quarter ended March 31, 2019 versus the year ago period.
>>> FEATURED STOCK ARTICLE : Sputtering Near 50-Day Average Line Building Base-On-Base - 5/1/2019 |
View all notes |
Set NEW NOTE alert |
Company Profile |
SEC
News |
Chart |
Request a new note
C
A
S
I |
EPAM
-
NYSE
Epam Systems Inc
COMPUTER SOFTWARE and SERVICES - Information Technology Service
|
$171.04
|
+2.74
1.63% |
$172.02
|
473,458
134.89% of 50 DAV
50 DAV is 351,000
|
$180.55
-5.27%
|
5/9/2019
|
$169.25
|
PP = $180.55
|
|
MB = $189.58
|
Most Recent Note - 5/14/2019 5:22:56 PM
Y - Posted a solid gain with higher volume today. A rebound above its 50 DMA line ($170) is needed for its outlook to improve. Reported earnings +34% on +23% sales revenues for the Mar '19 quarter, continuing its strong earnings track record.
>>> FEATURED STOCK ARTICLE : Found Support and Closed in Upper Third of Day's Range - 5/9/2019 |
View all notes |
Set NEW NOTE alert |
Company Profile |
SEC
News |
Chart |
Request a new note
C
A
S
I |
ENV
-
NYSE
Envestnet Inc
FINANCIAL SERVICES - Diversified Investments
|
$67.70
|
+0.38
0.56% |
$67.98
|
185,989
58.12% of 50 DAV
50 DAV is 320,000
|
$72.67
-6.84%
|
3/15/2019
|
$66.05
|
PP = $64.90
|
|
MB = $68.15
|
Most Recent Note - 5/14/2019 5:30:21 PM
G - Holding its ground near its 50 DMA line ($67.13) since a damaging gap down on on 5/09/19. Weak action came after reporting earnings +5% on +1% sales revenues for the Mar '19 quarter, below the +25% minimum earnings guideline (C criteria). The prior high ($64.80 on 9/14/18) defines near-term support to watch on pullbacks.
>>> FEATURED STOCK ARTICLE : Negative Reversal After Another New High - 4/24/2019 |
View all notes |
Set NEW NOTE alert |
Company Profile |
SEC
News |
Chart |
Request a new note
C
A
S
I |
TPL
-
NYSE
Texas Pacific Land Trust
Real Estate Dvlpmt/Ops
|
$842.35
|
+18.29
2.22% |
$854.58
|
15,657
104.38% of 50 DAV
50 DAV is 15,000
|
$915.66
-8.01%
|
5/15/2019
|
$850.01
|
PP = $915.76
|
|
MB = $961.55
|
 Most Recent Note - 5/15/2019 1:27:16 PM
Y - Color code is changed to yellow with new pivot point cited based on its 4/11/19 high plus 10 cents. Subsequent gains above the pivot point backed by at least +40% above average volume may trigger a technical buy signal. Reported earnings +222% on +219% sales revenues for the Mar '19 quarter continuing its strong earnings track record. Abruptly retreated from its all-time high yet found support near its 50 DMA line ($803) in recent weeks. Went through a deep consolidation below its 200 DMA line and rebounded impressively since 10/22/18 when dropped from the Featured Stocks list.
>>> FEATURED STOCK ARTICLE : Slump Below 50-Day Moving Average Hurt Technical Stance - 10/12/2018 |
View all notes |
Set NEW NOTE alert |
Company Profile |
SEC
News |
Chart |
Request a new note
C
A
S
I |
Symbol/Exchange
Company Name
Industry Group |
PRICE |
CHANGE
(%Change) |
Day High |
Volume
(% DAV)
(% 50 day avg vol) |
52 Wk Hi
% From Hi |
Featured
Date |
Price
Featured |
Pivot Featured |
|
Max Buy |
LHCG
-
NASDAQ
L H C Group Inc
HEALTH SERVICES - Home Health Care
|
$117.25
|
+1.86
1.61% |
$117.70
|
242,977
94.91% of 50 DAV
50 DAV is 256,000
|
$116.74
0.44%
|
4/29/2019
|
$110.94
|
PP = $115.64
|
|
MB = $121.42
|
Most Recent Note - 5/14/2019 5:20:19 PM
Y - Found support near its 50 DMA line and it remains perched near its all-time high. Subsequent gains above the pivot point backed by at least +40% above average volume may trigger a new (or add-on) technical buy signal. Reported earnings +56% on +73% sales revenues for the Mar '19 quarter, continuing its strong earnings track record. See the latest FSU analysis for more details and a new annotated graph.
>>> FEATURED STOCK ARTICLE : Long-Term Care Firm Hovering Near All-Time High - 5/14/2019 |
View all notes |
Set NEW NOTE alert |
Company Profile |
SEC
News |
Chart |
Request a new note
C
A
S
I |
ENSG
-
NASDAQ
Ensign Group Inc
HEALTH SERVICES - Long-Term Care Facilities
|
$55.96
|
+0.33
0.59% |
$56.36
|
327,713
113.40% of 50 DAV
50 DAV is 289,000
|
$56.99
-1.81%
|
4/30/2019
|
$51.46
|
PP = $53.30
|
|
MB = $55.97
|
Most Recent Note - 5/14/2019 5:26:10 PM
Y - There was a "negative reversal" today after hitting new all-time highs. Gain above the pivot on the prior session was backed by +131% above average volume triggering a technical buy signal. Reported earnings +22% on +12% sales revenues for the Mar '19 quarter, below the +25% minimum earnings guideline (C criteria), raising fundamental concerns.
>>> FEATURED STOCK ARTICLE : Two Damaging Losses Hurt Outlook - 4/17/2019 |
View all notes |
Set NEW NOTE alert |
Company Profile |
SEC
News |
Chart |
Request a new note
C
A
S
I |
LULU
-
NASDAQ
Lululemon Athletica
MANUFACTURING - Textile Manufacturing
|
$172.88
|
+2.20
1.29% |
$173.75
|
1,218,069
53.66% of 50 DAV
50 DAV is 2,270,000
|
$179.50
-3.69%
|
3/28/2019
|
$169.20
|
PP = $164.89
|
|
MB = $173.13
|
Most Recent Note - 5/14/2019 5:33:02 PM
Y - Color code is changed to yellow while consolidating below its "max buy" level. Near-term support is defined by prior highs in the $164 area and its 50 DMA line ($163).
>>> FEATURED STOCK ARTICLE : Volume Light While Hovering Near High - 5/10/2019 |
View all notes |
Set NEW NOTE alert |
Company Profile |
SEC
News |
Chart |
Request a new note
C
A
S
I |
NXST
-
NASDAQ
Nexstar Media Group Cl A
MEDIA - Broadcasting - TV
|
$105.12
|
+0.11
0.10% |
$106.10
|
675,016
129.07% of 50 DAV
50 DAV is 523,000
|
$119.93
-12.35%
|
5/1/2019
|
$115.33
|
PP = $120.03
|
|
MB = $126.03
|
Most Recent Note - 5/15/2019 1:15:06 PM
G - A rebound above the 50 DMA line is needed for its outlook to improve. Slumped below its 50 DMA line ($110) recently raising greater concerns and triggering a technical sell signal. Reported earnings +14% on +2% sales revenues for the Mar '19 quarter, below the +25% minimum earnings guideline (C criteria).
>>> FEATURED STOCK ARTICLE : Hitting New High and Very Extended From Prior Base - 4/4/2019 |
View all notes |
Set NEW NOTE alert |
Company Profile |
SEC
News |
Chart |
Request a new note
C
A
S
I |
ULTA
-
NASDAQ
Ulta Beauty Inc
SPECIALTY RETAIL - Specialty Retail, Other
|
$340.70
|
+5.38
1.60% |
$340.95
|
677,828
87.57% of 50 DAV
50 DAV is 774,000
|
$359.69
-5.28%
|
3/15/2019
|
$341.27
|
PP = $322.59
|
|
MB = $338.72
|
Most Recent Note - 5/14/2019 5:16:52 PM
G - Managed a "positive reversal" today after slumping near the prior high ($322). A rebound above the 50 DMA line ($340) still is needed for its outlook to improve.
>>> FEATURED STOCK ARTICLE : Volume Totals Cooling in Recent Weeks While Hovering Near High - 4/26/2019 |
View all notes |
Set NEW NOTE alert |
Company Profile |
SEC
News |
Chart |
Request a new note
C
A
S
I |
Symbol/Exchange
Company Name
Industry Group |
PRICE |
CHANGE
(%Change) |
Day High |
Volume
(% DAV)
(% 50 day avg vol) |
52 Wk Hi
% From Hi |
Featured
Date |
Price
Featured |
Pivot Featured |
|
Max Buy |
ESNT
-
NYSE
Essent Group Ltd
Finance-MrtgandRel Svc
|
$47.01
|
+0.25
0.53% |
$47.06
|
428,005
66.77% of 50 DAV
50 DAV is 641,000
|
$48.88
-3.83%
|
3/18/2019
|
$45.84
|
PP = $45.06
|
|
MB = $47.31
|
Most Recent Note - 5/14/2019 5:13:39 PM
Y - Recently reported earnings +15% on +20% sales revenues for the Mar '19 quarter, below the +25% minimum earnings guideline (C criteria), raising fundamental concerns. Its 50 DMA line ($45.40 defines near term support to watch. Faces very little resistance due to overhead supply up to the $50 level.
>>> FEATURED STOCK ARTICLE : Perched Above Pivot Point With Earnings News Due May 3rd - 4/25/2019 |
View all notes |
Set NEW NOTE alert |
Company Profile |
SEC
News |
Chart |
Request a new note
C
A
S
I |
FIVE
-
NASDAQ
Five Below Inc
Retail-DiscountandVariety
|
$127.76
|
+0.22
0.17% |
$128.17
|
718,193
63.84% of 50 DAV
50 DAV is 1,125,000
|
$148.22
-13.80%
|
4/11/2019
|
$132.05
|
PP = $133.75
|
|
MB = $140.44
|
Most Recent Note - 5/13/2019 5:37:52 PM
G - Pulled back today for a 6th consecutive loss and closed below its 50 DMA line ($128.83) raising greater concerns while also undercutting prior highs in the $133-136 area.
>>> FEATURED STOCK ARTICLE : Finished Strong After Featured Again in Mid-Day Report - 4/11/2019 |
View all notes |
Set NEW NOTE alert |
Company Profile |
SEC
News |
Chart |
Request a new note
C
A
S
I |
NOW
-
NYSE
Servicenow Inc
Computer Sftwr-Enterprse
|
$273.96
|
+1.89
0.69% |
$276.43
|
1,280,884
71.24% of 50 DAV
50 DAV is 1,798,000
|
$275.20
-0.45%
|
4/22/2019
|
$242.64
|
PP = $251.75
|
|
MB = $264.34
|
Most Recent Note - 5/14/2019 5:18:28 PM
G - Posted a gain today for its second best ever close. Bullish action was noted after it reported earnings +20% on +34% sales revenues for the Mar '19 quarter, below the +25% minimum earnings guideline (C criteria), raising concerns, fundamentally. Prior high ($251.65 on 3/21/19) and its 50 DMA line ($248.73) define near-term support to watch.
>>> FEATURED STOCK ARTICLE : Found Recent Support at 50-Day Moving Average - 4/15/2019 |
View all notes |
Set NEW NOTE alert |
Company Profile |
SEC
News |
Chart |
Request a new note
C
A
S
I |
PAYC
-
NYSE
Paycom Software Inc
COMPUTER SOFTWARE and SERVICES - Application Software
|
$204.39
|
+1.11
0.55% |
$205.67
|
668,973
105.68% of 50 DAV
50 DAV is 633,000
|
$210.55
-2.93%
|
2/6/2019
|
$171.66
|
PP = $164.18
|
|
MB = $172.39
|
Most Recent Note - 5/14/2019 5:27:41 PM
G - Its 50 DMA line ($190) defines important near-term support to watch. Hovering near its all-time high, extended from any sound base. Reported earnings +25% on +30% sales revenues for the Mar '19 quarter.
>>> FEATURED STOCK ARTICLE : Paycom Software Quietly Hovering Near All-Time High - 4/16/2019 |
View all notes |
Set NEW NOTE alert |
Company Profile |
SEC
News |
Chart |
Request a new note
C
A
S
I |
PYPL
-
NASDAQ
Paypal Holdings Inc
Finance-CrdtCard/PmtPr
|
$111.50
|
+2.41
2.21% |
$111.93
|
5,310,641
84.03% of 50 DAV
50 DAV is 6,320,000
|
$113.69
-1.93%
|
1/24/2019
|
$92.56
|
PP = $93.80
|
|
MB = $98.49
|
Most Recent Note - 5/15/2019 6:36:34 PM
G - Posted another gain today with light volume. Well above its 50 DMA line ($105.55) which defines near-term support to watch. Recently reported earnings +37% on +12% sales revenues for the Mar '19 quarter, continuing its strong earnings track record. See the latest FSU analysis for more details and a new annotated graph.
>>> FEATURED STOCK ARTICLE : Hovering Near All Time High Extended From Any Sound Base - 5/15/2019 |
View all notes |
Set NEW NOTE alert |
Company Profile |
SEC
News |
Chart |
Request a new note
C
A
S
I |
Symbol/Exchange
Company Name
Industry Group |
PRICE |
CHANGE
(%Change) |
Day High |
Volume
(% DAV)
(% 50 day avg vol) |
52 Wk Hi
% From Hi |
Featured
Date |
Price
Featured |
Pivot Featured |
|
Max Buy |
PLNT
-
NYSE
Planet Fitness Inc Cl A
Leisure-Services
|
$78.76
|
+0.31
0.40% |
$79.42
|
1,329,981
92.23% of 50 DAV
50 DAV is 1,442,000
|
$78.99
-0.29%
|
11/7/2018
|
$57.10
|
PP = $55.45
|
|
MB = $58.22
|
Most Recent Note - 5/14/2019 5:07:34 PM
G - Posted a gain today with below average volume for its second best close. It remains very extended from any sound base. Found prompt support at its 50 DMA line ($71) when a big volume-driven loss came after reporting earnings +30% on +23% sales revenues for its first quarter ended March 31, 2019.
>>> FEATURED STOCK ARTICLE : Perched Near High Very Extended From Prior Base - 4/5/2019 |
View all notes |
Set NEW NOTE alert |
Company Profile |
SEC
News |
Chart |
Request a new note
C
A
S
I |
TEAM
-
NASDAQ
Atlassian Corp Plc Cl A
Comp Sftwr-Spec Enterprs
|
$126.08
|
+2.31
1.87% |
$127.37
|
1,196,798
65.29% of 50 DAV
50 DAV is 1,833,000
|
$129.97
-2.99%
|
4/16/2019
|
$114.77
|
PP = $116.80
|
|
MB = $122.64
|
Most Recent Note - 5/13/2019 5:46:08 PM
Y - Today's big loss broke a streak of 7 consecutive gains into new all-time high territory and its color code is changed to yellow after closing below its "max buy" level. Reported earnings +133% on +38% sales revenues for the Mar '19 quarter, continuing its strong earnings track record.
>>> FEATURED STOCK ARTICLE : Perched Near High Enduring Distributional Pressure - 4/9/2019 |
View all notes |
Set NEW NOTE alert |
Company Profile |
SEC
News |
Chart |
Request a new note
C
A
S
I |
GLOB
-
NYSE
Globant SA
Computer-Tech Services
|
$83.21
|
+2.05
2.53% |
$83.54
|
273,493
127.80% of 50 DAV
50 DAV is 214,000
|
$85.70
-2.91%
|
2/15/2019
|
$69.35
|
PP = $70.00
|
|
MB = $73.50
|
Most Recent Note - 5/15/2019 12:41:59 PM
G - Its 50 DMA line ($76.52) defines important support above the prior high ($74). Violations would raise concerns and trigger technical sell signals. Reported earnings +32% on +22% sales revenues for the quarter ended March 31st, 2019 versus the year ago period, continuing its strong earning track record.
>>> FEATURED STOCK ARTICLE : Earnings News Due While Perched Near All-Time High - 5/7/2019 |
View all notes |
Set NEW NOTE alert |
Company Profile |
SEC
News |
Chart |
Request a new note
C
A
S
I |
|
|
|
THESE ARE NOT BUY RECOMMENDATIONS!
Comments contained in the body of this report are technical
opinions only. The material herein has been obtained
from sources believed to be reliable and accurate, however,
its accuracy and completeness cannot be guaranteed.
This site is not an investment advisor, hence it does
not endorse or recommend any securities or other investments.
Any recommendation contained in this report may not
be suitable for all investors and it is not to be deemed
an offer or solicitation on our part with respect to
the purchase or sale of any securities. All trademarks,
service marks and trade names appearing in this report
are the property of their respective owners, and are
likewise used for identification purposes only.
This report is a service available
only to active Paid Premium Members.
You may opt-out of receiving report notifications
at any time. Questions or comments may be submitted
by writing to Premium Membership Services 665 S.E. 10 Street, Suite 201 Deerfield Beach, FL 33441-5634 or by calling 1-800-965-8307
or 954-785-1121.
|
|
|