You are not logged in.
This means you
CAN ONLY VIEW reports that were published prior to Sunday, February 25, 2024.
You
MUST UPGRADE YOUR MEMBERSHIP if you want to see any current reports.
AFTER MARKET UPDATE - WEDNESDAY, MAY 13TH, 2020
Previous After Market Report Next After Market Report >>>
|
|
|
|
DOW |
-516.81 |
23,247.97 |
-2.17% |
|
Volume |
1,123,812,256 |
+20% |
|
Volume |
4,234,055,000 |
-2% |
|
NASDAQ |
-139.38 |
8,863.17 |
-1.55% |
|
Advancers |
325 |
11% |
|
Advancers |
627 |
19% |
|
S&P 500 |
-50.12 |
2,820.00 |
-1.75% |
|
Decliners |
2,594 |
89% |
|
Decliners |
2,615 |
81% |
|
Russell 2000 |
-42.29 |
1,233.25 |
-3.32% |
|
52 Wk Highs |
16 |
|
|
52 Wk Highs |
42 |
|
|
S&P 600 |
-28.15 |
700.59 |
-3.86% |
|
52 Wk Lows |
72 |
|
|
52 Wk Lows |
95 |
|
|
 |
Leadership Thin as Indices Fell; Dow Hits "Bear Market" Territory Again
Kenneth J. Gruneisen - Passed the CAN SLIM® Master's Exam
The Dow dropped 516 points, while the S&P 500 slumped 1.8% and is on pace for its worst week since March 20th. The Nasdaq Composite lost 1.6%. Breadth was negative as decliners led advancers by an 8-1 margin on the NYSE and 4-1 on the Nasdaq exchange. The reported volume totals were mixed, higher than the prior session on the NYSE and lighter on the Nasdaq exchange. There were 14 high-ranked companies from the Leaders List that hit new 52-week highs and were listed on the BreakOuts Page, versus 39 on the prior session. New 52-week highs outnumbered new lows totals on the NYSE and on the Nasdaq exchange. The major indices are in a confirmed uptrend (M criteria). Any sustainable rally requires a healthy crop of new leaders, so shrinking new highs totals this week are a worrisome sign. Charts used courtesy of www.stockcharts.com
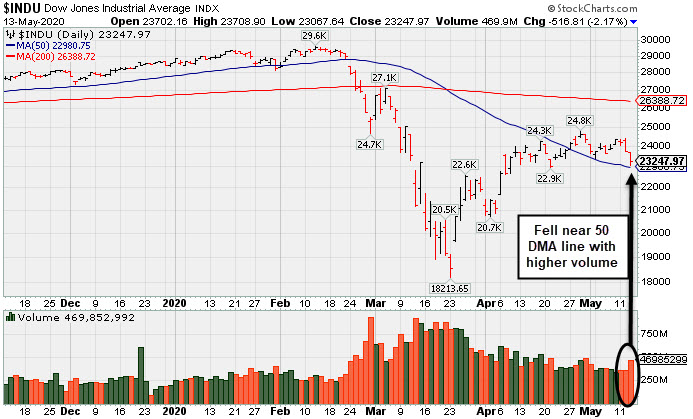
PICTURED: The Dow Jones Industrial Average fell near its 50-day moving average (DMA) line with a loss with higher volume indicative of distributional pressure or increased selling from institutional investors. The pullback leaves it -21.4% off its record high hit on 2/12/20, technically sinking back into "Bear Market" territory.
Stocks finished lower Wednesday as investors digested remarks from Fed Chair Jerome Powell along with concerns over equity market valuations. The central bank chief warned that the COVID-19 pandemic continues to pose unprecedented downside risks, with liquidity issues potentially converting to solvency concerns over time. Furthermore, Powell noted that additional fiscal stimulus may be worthwhile to help limit long-term economic harm, while also pushing back against the idea of negative interest rates. In geopolitical news, tension between the U.S. and China remain elevated as the two countries grapple over the coronavirus pandemic.
Treasuries advanced with the yield on the 10-year note slipping two basis points to 0.65%. On the data front, producer price inflation fell 1.3% in April, more than expectations of a 0.5% decline. In commodities, WTI crude fell 1.1% to $25.52/barrel, despite official government data showing a surprise drop in U.S. crude stockpiles in the most recent week.
All 11 S&P 500 sectors ended the session in negative territory, with Energy and Financials leading the declines. The Industrials group also underperformed, with airline stocks tumbling to their lowest since 2013 on weak demand forecasts. Shares of United Airlines (UAL -9.01%) and Delta Airlines (DAL -7.70%) both lost a lot of altitude. In corporate news, Gilead Sciences (GILD -1.14%) fell after agreeing to license the production of its coronavirus treatment drug to five generic drugmakers. |
 Kenneth J. Gruneisen started out as a licensed stockbroker in August 1987, a couple of months prior to the historic stock market crash that took the Dow Jones Industrial Average down -22.6% in a single day. He has published daily fact-based fundamental and technical analysis on high-ranked stocks online for two decades. Through FACTBASEDINVESTING.COM, Kenneth provides educational articles, news, market commentary, and other information regarding proven investment systems that work in good times and bad.
Comments contained in the body of this report are technical opinions only and are not necessarily those of Gruneisen Growth Corp. The material herein has been obtained from sources believed to be reliable and accurate, however, its accuracy and completeness cannot be guaranteed. Our firm, employees, and customers may effect transactions, including transactions contrary to any recommendation herein, or have positions in the securities mentioned herein or options with respect thereto. Any recommendation contained in this report may not be suitable for all investors and it is not to be deemed an offer or solicitation on our part with respect to the purchase or sale of any securities. |
|
 |
Energy and Financial Groups Suffered Big Losses
Kenneth J. Gruneisen - Passed the CAN SLIM® Master's Exam
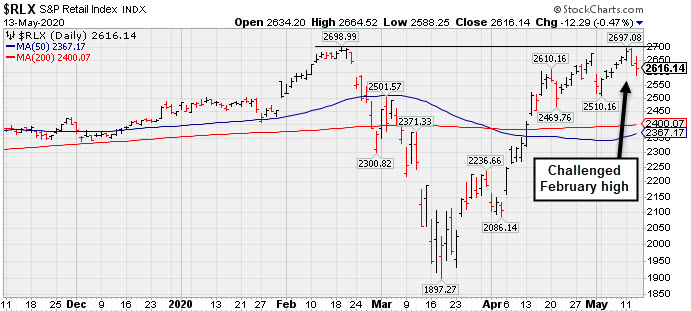
The Bank Index ($BKX -4.69%) and the Broker/Dealer Index ($XBD -3.06%) both lost ground and weighed on the major indices. The tech sector had a negative bias as the Networking Index ($NWX -4.76%) outpaced the Biotech Index ($BTK -1.30%) and the Semiconductor Index ($SOX -1.95%) to the downside. The Oil Services Index ($OSX -8.65%) was a standout decliner and the Integrated Oil Index ($XOI -4.37%) also suffered a big loss. The Gold & Silver Index ($XAU +0.21%) eked out a small gain, bucking the widely negative market. PICTURED: The Retail Index ($RLX -0.47%) edged lower. It recently challenged its February high after rebounding impressively from the March low.
| Oil Services |
$OSX |
27.40 |
-2.51 |
-8.39% |
-65.00% |
| Integrated Oil |
$XOI |
730.77 |
-33.38 |
-4.37% |
-42.48% |
| Semiconductor |
$SOX |
1,691.57 |
-33.67 |
-1.95% |
-8.54% |
| Networking |
$NWX |
496.93 |
-24.83 |
-4.76% |
-14.82% |
| Broker/Dealer |
$XBD |
226.62 |
-7.16 |
-3.06% |
-21.96% |
| Retail |
$RLX |
2,616.14 |
-12.29 |
-0.47% |
+6.81% |
| Gold & Silver |
$XAU |
117.98 |
+0.24 |
+0.20% |
+10.34% |
| Bank |
$BKX |
62.74 |
-3.09 |
-4.69% |
-44.65% |
| Biotech |
$BTK |
5,404.33 |
-71.13 |
-1.30% |
+6.65% |
|
|
|
 |
Quiet Pullback Just Below "Max Buy" Level
Kenneth J. Gruneisen - Passed the CAN SLIM® Master's Exam
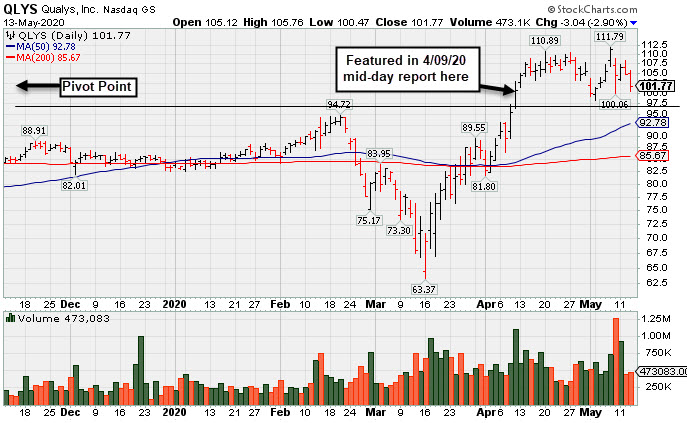
Qualys Inc (QLYS -$3.04 or -2.90% to $101.77) pulled back today with below average volume and its color code was changed to yellow after dipping back below its "max buy" level again. Prior highs in the $97 area recently acted as support. More damaging losses would raise concerns and trigger a technical sell signal.
It has a 98 earnings Per Share Rating and recently reported Mar '20 quarterly earnings +33% on +14% sales revenues versus the year ago period, continuing its strong earnings track record with its 12th consecutive quarter above the +25% minimum earnings guideline (C criteria). Its annual earnings history (A criteria) has also been very strong an steady. The Computer Software - Security group has a 92 Group Relative Strength Rating, and leadership (L criteria) in the industry group is another favorable factor with respect to the fact-based investment system.
QLYS has traded up as much as +11.3% since highlighted in yellow with new pivot point cited based on its 2/12/19 high plus 10 cents in the 4/09/20 mid-day report (read here). It powered to a new all-time highs with big volume-driven gains. It was noted, "The volume-driven gains above the pivot point for a new high (N criteria) may be an indication of fresh institutional buying demand that can lead to a meaningful and sustained advance in price."
Currently it has a Timeliness Rating of A and Sponsorship Rating of D. Its Accumulation/Distribution rating is A while its Up/Down Volume Ratio of 1.5 is an unbiased indication its shares have been under accumulation over the past 50 days. The number of top-rated funds owning its shares rose from 294 in Jun '17 to 490 in Mar '20, a reassuring sign concerning the I criteria. Its small supply of only 32.4 million shares (S criteria) in the public float can contribute to greater volatility in the event of institutional buying or selling.
|
|
|
Color Codes Explained :
Y - Better candidates highlighted by our
staff of experts.
G - Previously featured
in past reports as yellow but may no longer be buyable under the
guidelines.
***Last / Change / Volume data in this table is the closing quote data***
Symbol/Exchange
Company Name
Industry Group |
PRICE |
CHANGE
(%Change) |
Day High |
Volume
(% DAV)
(% 50 day avg vol) |
52 Wk Hi
% From Hi |
Featured
Date |
Price
Featured |
Pivot Featured |
|
Max Buy |
 FTNT
-
NASDAQ
FTNT
-
NASDAQ
Fortinet Inc
Computer Sftwr-Security
|
$137.16
|
-1.23
-0.89% |
$139.86
|
1,523,992
60.64% of 50 DAV
50 DAV is 2,513,000
|
$143.41
-4.36%
|
5/7/2020
|
$134.40
|
PP = $121.92
|
|
MB = $128.02
|
Most Recent Note - 5/11/2020 5:28:24 PM
G - Color code was changed to green after quickly rallying well above its "max buy" level and getting extended from the prior base. Prior highs in the $121 area define initial support to watch on pullbacks. Finished strong after highlighted in yellow in the 5/07/20 mid-day report. Fundamentals remain strong. See the latest FSU analysis for more details and an annotated graph.
>>> FEATURED STOCK ARTICLE : Gap Up and Big Volume-Driven Gain for Computer Security Firm - 5/7/2020 |
View all notes |
Set NEW NOTE alert |
Company Profile |
SEC
News |
Chart |
Request a new note
C
A
S
I |
SPNS
-
NASDAQ
Sapiens Intl Corp
COMPUTER SOFTWARE and SERVICES - Technical and System Software
|
$24.43
|
-1.37
-5.31% |
$26.85
|
365,501
257.40% of 50 DAV
50 DAV is 142,000
|
$29.24
-16.45%
|
5/11/2020
|
$27.80
|
PP = $26.96
|
|
MB = $28.31
|
 Most Recent Note - 5/13/2020 6:07:36 PM
Y - Due to report Mar '20 quarterly earnings news before the open tomorrow (5/14/20). Volume and volatility often increase near earnings news. Suffered 2 consecutive losses with above average volume raising concerns. Finished weak after highlighted in yellow in the 5/11/20 mid-day report with pivot point cited based on its 1/24/20 high plus 10 cents. See the latest FSU analysis for more details and an annotated graph.
>>> FEATURED STOCK ARTICLE : Encountered Distributional Pressure After Hitting New High - 5/11/2020 |
View all notes |
Set NEW NOTE alert |
Company Profile |
SEC
News |
Chart |
Request a new note
C
A
S
I |
EBS
-
NYSE
Emergent Biosolutions
DRUGS - Biotechnology
|
$81.14
|
-0.33
-0.41% |
$84.86
|
635,951
109.27% of 50 DAV
50 DAV is 582,000
|
$90.00
-9.84%
|
4/24/2020
|
$72.10
|
PP = $73.99
|
|
MB = $77.69
|
Most Recent Note - 5/12/2020 6:26:57 PM
G - There was a "negative reversal" after early gains today for a new all-time high, ending with a loss on above average volume indicative of distributional pressure. It is extended from the previously noted base. Prior highs in the $71-73 area define initial support to watch on pullbacks. Fundamentals remain strong.
>>> FEATURED STOCK ARTICLE : Light Volume Gain for New High Close Caps 7th Straight Weekly Gain - 5/8/2020 |
View all notes |
Set NEW NOTE alert |
Company Profile |
SEC
News |
Chart |
Request a new note
C
A
S
I |
TREX
-
NYSE
Trex Company Inc
MATERIALS and CONSTRUCTION - General Building Materials
|
$113.92
|
+0.52
0.46% |
$117.16
|
939,562
86.44% of 50 DAV
50 DAV is 1,087,000
|
$118.72
-4.04%
|
5/5/2020
|
$109.05
|
PP = $111.95
|
|
MB = $117.55
|
Most Recent Note - 5/12/2020 6:30:01 PM
Y - Pulled back today for a loss with below average volume after touching a new all-time high. Prior highs in the $111 area define initial support to watch. Has a new CEO as of 4/29/20. Fundamentals remain strong.
>>> FEATURED STOCK ARTICLE : Gapped Up for Volume-Driven Gain and Hit a New All-Time High - 5/5/2020 |
View all notes |
Set NEW NOTE alert |
Company Profile |
SEC
News |
Chart |
Request a new note
C
A
S
I |
NFLX
-
NASDAQ
Netflix Inc
SPECIALTY RETAIL - Music and Video Stores
|
$438.27
|
+6.45
1.49% |
$447.00
|
6,997,549
74.46% of 50 DAV
50 DAV is 9,398,000
|
$449.52
-2.50%
|
4/13/2020
|
$393.60
|
PP = $393.62
|
|
MB = $413.30
|
Most Recent Note - 5/11/2020 5:23:59 PM
G - Posted another small gain today with light volume for a best-ever close. Prior highs in the $393 area acted as support following the recent breakout. Fundamentals remain strong after it reported earnings +107% on +28% sales revenues for the Mar '20 quarter versus the year ago period.
>>> FEATURED STOCK ARTICLE : Prior Highs Acted as Support Following Recent Breakout - 5/6/2020 |
View all notes |
Set NEW NOTE alert |
Company Profile |
SEC
News |
Chart |
Request a new note
C
A
S
I |
Symbol/Exchange
Company Name
Industry Group |
PRICE |
CHANGE
(%Change) |
Day High |
Volume
(% DAV)
(% 50 day avg vol) |
52 Wk Hi
% From Hi |
Featured
Date |
Price
Featured |
Pivot Featured |
|
Max Buy |
NOW
-
NYSE
Servicenow Inc
Computer Sftwr-Enterprse
|
$361.29
|
-4.31
-1.18% |
$370.46
|
2,888,360
102.72% of 50 DAV
50 DAV is 2,812,000
|
$388.50
-7.00%
|
4/30/2020
|
$343.05
|
PP = $363.05
|
|
MB = $381.20
|
Most Recent Note - 5/12/2020 6:24:24 PM
Y - Pulled back from near its all-time high with higher volume behind today's big loss following gains backed by near average volume. Gains above the pivot point should be backed by at least +40% above average volume to clinch a proper technical buy signal.
>>> FEATURED STOCK ARTICLE : Fundamental Strength Continues; Volume Heavy Behind Big Gain - 4/30/2020 |
View all notes |
Set NEW NOTE alert |
Company Profile |
SEC
News |
Chart |
Request a new note
C
A
S
I |
QLYS
-
NASDAQ
Qualys Inc
Computer Sftwr-Security
|
$101.77
|
-3.04
-2.90% |
$105.76
|
471,258
82.24% of 50 DAV
50 DAV is 573,000
|
$111.79
-8.96%
|
4/9/2020
|
$100.44
|
PP = $97.22
|
|
MB = $102.08
|
Most Recent Note - 5/13/2020 6:03:35 PM
Y - Color code was changed to yellow again after a pullback on light volume to just below its "max buy" level. Reported Mar '20 quarterly earnings +33% on +14% sales revenues versus the year ago period, its 12th consecutive quarterly earnings increase above the +25% minimum guideline (C criteria). Prior highs in the $97 area recently acted as support. See the latest FSU analysis for more details and a new annotated graph.
>>> FEATURED STOCK ARTICLE : Quiet Pullback Just Below "Max Buy" Level - 5/13/2020 |
View all notes |
Set NEW NOTE alert |
Company Profile |
SEC
News |
Chart |
Request a new note
C
A
S
I |
TEAM
-
NASDAQ
Atlassian Corp Plc Cl A
Comp Sftwr-Spec Enterprs
|
$175.76
|
-0.24
-0.14% |
$178.38
|
1,498,316
72.31% of 50 DAV
50 DAV is 2,072,000
|
$182.60
-3.75%
|
5/4/2020
|
$159.70
|
PP = $156.22
|
|
MB = $164.03
|
Most Recent Note - 5/7/2020 6:45:57 PM
G - Posted a 4th consecutive gain today, getting more extended from the previously noted base. Prior highs in the $156 area define initial support to watch on pullbacks.
>>> FEATURED STOCK ARTICLE : Volume-Driven Gain For New All-Time High - 5/4/2020 |
View all notes |
Set NEW NOTE alert |
Company Profile |
SEC
News |
Chart |
Request a new note
C
A
S
I |
AAXN
-
NASDAQ
Axon Enterprise Inc
Security/Sfty
|
$80.17
|
-3.31
-3.97% |
$84.91
|
877,939
102.44% of 50 DAV
50 DAV is 857,000
|
$90.10
-11.02%
|
5/8/2020
|
$84.86
|
PP = $90.20
|
|
MB = $94.71
|
Most Recent Note - 5/13/2020 6:09:43 PM
Y - Pulled back for a 3rd consecutive loss with near average volume. Finished strong after highlighted in yellow in the 5/08/20 mid-day report with pivot point cited based upon its 2/19/20 high plus 10 cents. Subsequent volume-driven gains above the pivot point may trigger a technical buy signal.
>>> FEATURED STOCK ARTICLE : Security/Safety Firm Perched Near 52-Week High After Gap Up - 5/12/2020 |
View all notes |
Set NEW NOTE alert |
Company Profile |
SEC
News |
Chart |
Request a new note
C
A
S
I |
|
|
|
THESE ARE NOT BUY RECOMMENDATIONS!
Comments contained in the body of this report are technical
opinions only. The material herein has been obtained
from sources believed to be reliable and accurate, however,
its accuracy and completeness cannot be guaranteed.
This site is not an investment advisor, hence it does
not endorse or recommend any securities or other investments.
Any recommendation contained in this report may not
be suitable for all investors and it is not to be deemed
an offer or solicitation on our part with respect to
the purchase or sale of any securities. All trademarks,
service marks and trade names appearing in this report
are the property of their respective owners, and are
likewise used for identification purposes only.
This report is a service available
only to active Paid Premium Members.
You may opt-out of receiving report notifications
at any time. Questions or comments may be submitted
by writing to Premium Membership Services 665 S.E. 10 Street, Suite 201 Deerfield Beach, FL 33441-5634 or by calling 1-800-965-8307
or 954-785-1121.
|
|
|