You are not logged in.
This means you
CAN ONLY VIEW reports that were published prior to Monday, February 19, 2024.
You
MUST UPGRADE YOUR MEMBERSHIP if you want to see any current reports.
AFTER MARKET UPDATE - WEDNESDAY, MAY 11TH, 2022
Previous After Market Report Next After Market Report >>>
|
|
|
|
DOW |
-326.63 |
31,834.11 |
-1.02% |
|
Volume |
1,205,544,757 |
-2% |
|
Volume |
6,130,735,100 |
-1% |
|
NASDAQ |
-373.44 |
11,364.24 |
-3.18% |
|
Advancers |
925 |
29% |
|
Advancers |
929 |
22% |
|
S&P 500 |
-65.87 |
3,935.18 |
-1.65% |
|
Decliners |
2,275 |
71% |
|
Decliners |
3,247 |
78% |
|
Russell 2000 |
-43.65 |
1,718.14 |
-2.48% |
|
52 Wk Highs |
13 |
|
|
52 Wk Highs |
16 |
|
|
S&P 600 |
-19.60 |
1,147.42 |
-1.68% |
|
52 Wk Lows |
784 |
|
|
52 Wk Lows |
1,588 |
|
|
The market remains in a correction (M criteria). Reducing market exposure and raising cash is prudent until a new confirmed rally is noted.
|
 |
Major Indices Fall Again as Market Correction Brings More Damage
Kenneth J. Gruneisen - Passed the CAN SLIM® Master's Exam
The Dow fell 326 points, extending its losing stretch to five sessions. The S&P 500 erased an earlier gain to end down 1.7%. The broad benchmark retreated back below the 4,000 level to its lowest point since March 2021. The Nasdaq Composite slumped 3.2% as growth-related shares fared the worst, while the mega-cap Nasdaq 100 dropped 3.1% to a November 2020 trough. The small-cap Russell 2000 wiped out an advance of nearly 2% to close 2.5% lower. Volume totals reported were lower than the prior session on the NYSE and on the Nasdaq exchange. Breadth was negative as decliners led advancers by more than a 2-1 margin on the NYSE and by more than a 3-1 margin on the Nasdaq exchange. There were 2 high-ranked companies from the Leaders List that hit new 52-week highs and were listed on the BreakOuts Page, versus 3 on the prior session. New 52-week lows totals solidly outnumbered short lists of new 52-week highs on both the NYSE and the Nasdaq exchange. The major indices are still in a market correction (M criteria). Followers of the fact-based investment system know to watch for a follow-through day on Day 4-7 of a new rally attempt which could signal a new confirmed uptrend.
Chart courtesy of www.stockcharts.com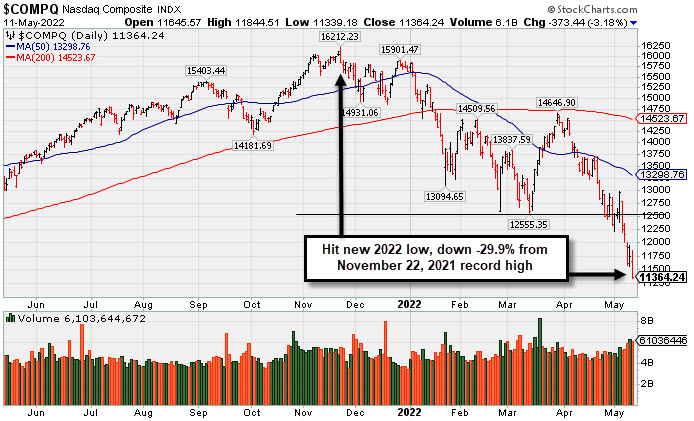 PICTURED: The Nasdaq Composite Index slumped to a new 2022 low. It is down -29.9% from the November 10, 2022 record high.
U.S. stocks finished lower in volatile trading Wednesday as Wall Street assessed a key update on inflation. The Consumer Price Index (CPI) climbed a bigger-than-anticipated 8.3% year-over-year in April, but cooled somewhat from the prior 8.5% annual reading that had been the highest since December 1981. However, core CPI (excluding food and energy) increased a larger-than-expected 0.6% on a monthly basis, twice the prior 0.3% pace. The figure highlighted the persistence of a broad array of underlying price pressures, bolstering expectations for a more aggressive path of Federal Reserve rate hikes. Longer-dated Treasuries strengthened, with the yield on the 10-year note slipping eight basis points (0.08%) to 2.91%, helped by strong demand metrics in the maturity’s $36 billion auction.
Eight of 11 S&P 500 sectors closed in negative territory, with Consumer Discretionary and Technology leading the downturn. Mega-cap names Tesla Inc. (TSLA -8.25%) and Apple Inc. (AAPL -5.18%) both slumped for large losses. Elsewhere, video game maker Electronic Arts Inc. (EA +7.97%) bucked the downtrend following an analyst upgrade on upbeat earnings. In other corporate news, Swedish Match AB agreed to be purchased by Philip Morris International Inc. (PM +4.79%) for $16 billion.
|
 Kenneth J. Gruneisen started out as a licensed stockbroker in August 1987, a couple of months prior to the historic stock market crash that took the Dow Jones Industrial Average down -22.6% in a single day. He has published daily fact-based fundamental and technical analysis on high-ranked stocks online for two decades. Through FACTBASEDINVESTING.COM, Kenneth provides educational articles, news, market commentary, and other information regarding proven investment systems that work in good times and bad.
Comments contained in the body of this report are technical opinions only and are not necessarily those of Gruneisen Growth Corp. The material herein has been obtained from sources believed to be reliable and accurate, however, its accuracy and completeness cannot be guaranteed. Our firm, employees, and customers may effect transactions, including transactions contrary to any recommendation herein, or have positions in the securities mentioned herein or options with respect thereto. Any recommendation contained in this report may not be suitable for all investors and it is not to be deemed an offer or solicitation on our part with respect to the purchase or sale of any securities. |
|
 |
Retail, Financial, and Tech Indexes Fell
Kenneth J. Gruneisen - Passed the CAN SLIM® Master's Exam
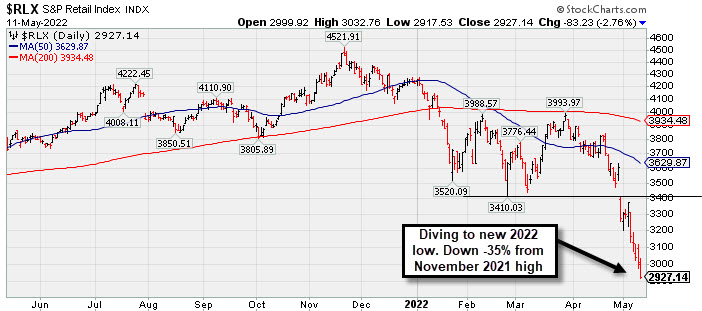
Losses from the Retail Index ($RLX -2.76%), Bank Index ($BKX -1.78%), and Broker/Dealer Index ($XBD -1.79%) weighed on the major averages. The tech sector saw unanimous losses from the Semiconductor Index ($SOX -3.04%), Networking Index ($NWX -2.38%), and the Biotech Index ($BTK -2.56%). Commodity-linked groups were mixed as the Oil Services Index ($OSX +0.57%) and Integrated Oil Index ($XOI +1.17%) both notched gains while the Gold & Silver Index ($XAU -0.29%) lost a little ground.
PICTURED: The Retail Index ($RLX -2.76%) slumped to a new 2022 low. It is down -35% from its November 2021 record high.
| Oil Services |
$OSX |
70.37 |
+0.40 |
+0.57% |
+33.47% |
| Integrated Oil |
$XOI |
1,602.55 |
+18.58 |
+1.17% |
+36.02% |
| Semiconductor |
$SOX |
2,811.94 |
-88.19 |
-3.04% |
-28.74% |
| Networking |
$NWX |
723.51 |
-17.65 |
-2.38% |
-25.49% |
| Broker/Dealer |
$XBD |
383.56 |
-7.00 |
-1.79% |
-21.22% |
| Retail |
$RLX |
2,927.14 |
-83.23 |
-2.76% |
-30.74% |
| Gold & Silver |
$XAU |
128.01 |
-0.37 |
-0.29% |
-3.36% |
| Bank |
$BKX |
106.79 |
-1.93 |
-1.78% |
-19.23% |
| Biotech |
$BTK |
4,291.78 |
-112.55 |
-2.56% |
-22.23% |
|
|
|
 |
Featured Stocks
Kenneth J. Gruneisen - Passed the CAN SLIM® Master's Exam
|
|
|
Color Codes Explained :
Y - Better candidates highlighted by our
staff of experts.
G - Previously featured
in past reports as yellow but may no longer be buyable under the
guidelines.
***Last / Change / Volume data in this table is the closing quote data***
Symbol/Exchange
Company Name
Industry Group |
PRICE |
CHANGE
(%Change) |
Day High |
Volume
(% DAV)
(% 50 day avg vol) |
52 Wk Hi
% From Hi |
Featured
Date |
Price
Featured |
Pivot Featured |
|
Max Buy |
 CI
-
NYSE
CI
-
NYSE
Cigna Corp
Medical-Managed Care
|
$260.20
|
-0.45
-0.17% |
$267.53
|
1,410,683
93.36% of 50 DAV
50 DAV is 1,511,000
|
$272.81
-4.62%
|
5/6/2022
|
$263.52
|
PP = $269.97
|
|
MB = $283.47
|
 Most Recent Note - 5/11/2022 6:18:36 PM
Y - Pulled back today for a 3rd consecutive small loss on lighter volume while perched within close striking distance of its all-time high. Subsequent gains above the pivot point backed by at least +40% above average volume may trigger a technical buy signal. Reported a strong +27% earnings increase on +7% sales revenues for the Mar '22 quarter versus the year ago period, its 3rd strong quarterly comparison above the +25% minimum guideline (C criteria). Annual earnings growth (A criteria) has been strong.
>>> FEATURED STOCK ARTICLE : Cigna Rises Near All-Time High - 5/6/2022 |
View all notes |
Set NEW NOTE alert |
Company Profile |
SEC
News |
Chart |
Request a new note
C
A
S
I |
IMKTA
-
NASDAQ
Ingles Markets Inc Cl A
RETAIL - Grocery Stores
|
$94.30
|
-2.06
-2.14% |
$97.92
|
112,019
94.13% of 50 DAV
50 DAV is 119,000
|
$101.98
-7.53%
|
4/11/2022
|
$96.25
|
PP = $95.75
|
|
MB = $100.54
|
Most Recent Note - 5/11/2022 6:19:58 PM
Y - Reversed an early gain today and closed near the session low. Its 50 DMA line ($92.73) and prior lows define important near-term support. More damaging losses would raise concerns and trigger a technical sell signal. Reported Mar '22 quarterly earnings +40% on +16% sales revenues versus the year ago period.
>>> FEATURED STOCK ARTICLE : Ingles Markets Perched Near High With Earnings News Due - 5/4/2022 |
View all notes |
Set NEW NOTE alert |
Company Profile |
SEC
News |
Chart |
Request a new note
C
A
S
I |
WCC
-
NYSE
Wesco International Inc
WHOLESALE - Electronics Wholesale
|
$120.53
|
-7.73
-6.03% |
$129.40
|
919,719
196.94% of 50 DAV
50 DAV is 467,000
|
$144.43
-16.55%
|
4/21/2022
|
$135.54
|
PP = $139.10
|
|
MB = $146.06
|
Most Recent Note - 5/11/2022 6:17:30 PM
G - Color code is changed to green after slumping below its 50 and 200 DMA lines raising concerns with today's 3rd consecutive volume-driven loss. Prior lows in the $115 define near-term support, meanwhile a rebound above the 50 DMA line is needed for its outlook to improve. Members were cautioned - "New buying efforts may only be considered after a solid follow-through day confirms a new market uptrend (M criteria)." Reported Mar '22 quarterly earnings +154% on +22% sales revenues versus the year ago period. Volume and volatility often increase near earnings news.
>>> FEATURED STOCK ARTICLE : Approaching Prior Highs Where it Met Resistance - 4/21/2022 |
View all notes |
Set NEW NOTE alert |
Company Profile |
SEC
News |
Chart |
Request a new note
C
A
S
I |
IMXI
-
NASDAQ
International Money Exp
Financial Svcs-Specialty
|
$19.80
|
+0.07
0.35% |
$20.27
|
318,866
75.03% of 50 DAV
50 DAV is 425,000
|
$22.86
-13.39%
|
3/8/2022
|
$18.64
|
PP = $19.06
|
|
MB = $20.01
|
Most Recent Note - 5/11/2022 6:20:44 PM
G - Recently testing near its 50 DMA line ($19.92) and prior lows in the $19 area which define important near term support to watch. More damaging losses would raise concerns and trigger a technical sell signal. Reported Mar '22 quarterly earnings +26% on +21% sales revenues versus the year ago period.
>>> FEATURED STOCK ARTICLE : Consolidating After Rally From Previously Noted Base - 4/18/2022 |
View all notes |
Set NEW NOTE alert |
Company Profile |
SEC
News |
Chart |
Request a new note
C
A
S
I |
|
|
|
THESE ARE NOT BUY RECOMMENDATIONS!
Comments contained in the body of this report are technical
opinions only. The material herein has been obtained
from sources believed to be reliable and accurate, however,
its accuracy and completeness cannot be guaranteed.
This site is not an investment advisor, hence it does
not endorse or recommend any securities or other investments.
Any recommendation contained in this report may not
be suitable for all investors and it is not to be deemed
an offer or solicitation on our part with respect to
the purchase or sale of any securities. All trademarks,
service marks and trade names appearing in this report
are the property of their respective owners, and are
likewise used for identification purposes only.
This report is a service available
only to active Paid Premium Members.
You may opt-out of receiving report notifications
at any time. Questions or comments may be submitted
by writing to Premium Membership Services 665 S.E. 10 Street, Suite 201 Deerfield Beach, FL 33441-5634 or by calling 1-800-965-8307
or 954-785-1121.
|
|
|