***Last / Change / Volume data in this table is the closing quote data***
Symbol/Exchange
Company Name
Industry Group |
PRICE |
CHANGE
(%Change) |
Day High |
Volume
(% DAV)
(% 50 day avg vol) |
52 Wk Hi
% From Hi |
Featured
Date |
Price
Featured |
Pivot Featured |
|
Max Buy |
MLR
-
NYSE
Miller Industries Inc
AUTOMOTIVE - Auto Parts
|
$32.80
|
-0.82
-2.44% |
$33.78
|
47,660
113.48% of 50 DAV
50 DAV is 42,000
|
$35.26
-6.98%
|
11/30/2018
|
$28.35
|
PP = $29.50
|
|
MB = $30.98
|
Most Recent Note - 5/9/2019 4:00:40 PM
G - Rebounded above its 50 DMA line ($32.84) with today's volume-driven gain. Prior low ($30.38 on 3/27/19) defines the next near-term support to watch. Reported March '19 quarterly earnings +29% on +24% sales revenues versus the year ago period, above the +25% minimum earnings guideline (C criteria).
>>> FEATURED STOCK ARTICLE : Below 50-Day Average After Damaging Losses - 4/8/2019 |
View all notes |
Set NEW NOTE alert |
Company Profile |
SEC
News |
Chart |
Request a new note
C
A
S
I |
NSP
-
NYSE
Insperity Inc
Comml Svcs-Outsourcing
|
$116.38
|
-0.58
-0.50% |
$116.85
|
290,786
86.80% of 50 DAV
50 DAV is 335,000
|
$132.50
-12.17%
|
4/16/2019
|
$129.59
|
PP = $132.60
|
|
MB = $139.23
|
Most Recent Note - 5/7/2019 11:46:34 AM
G - Still sputtering in a tight range after it violated the prior low ($118) and tested its 200 DMA line ($111) with a damaging volume-driven loss last week following earnings news. Reported earnings +40% on +14% sales revenues for the Mar '19 quarter. A rebound above the 50 DMA line ($124) is needed for its outlook to improve. Subsequent gains above the pivot point backed by at least +40% above average volume are needed to trigger a new (or add-on) technical buy signal.
>>> FEATURED STOCK ARTICLE : Rebound Above 50-Day Moving Average Line Needed - 4/23/2019 |
View all notes |
Set NEW NOTE alert |
Company Profile |
SEC
News |
Chart |
Request a new note
C
A
S
I |
FTNT
-
NASDAQ
Fortinet Inc
Computer Sftwr-Security
|
$82.90
|
+1.09
1.33% |
$83.22
|
1,729,832
97.18% of 50 DAV
50 DAV is 1,780,000
|
$96.96
-14.50%
|
4/10/2019
|
$89.76
|
PP = $88.70
|
|
MB = $93.14
|
Most Recent Note - 5/7/2019 6:17:53 PM
G - Suffered a 5th consecutive loss today with above average volume, slumping toward its 200 DMA line ($79.75). A rebound above the 50 DMA line ($87.07) is needed for its outlook to improve. Weak action came after it reported earnings +39% on +18% sales revenues for the Mar '19 quarter versus the year ago period.
>>> FEATURED STOCK ARTICLE : Volume-Driven Gain Cleared Flat Base and Little Resistance Remains - 4/10/2019 |
View all notes |
Set NEW NOTE alert |
Company Profile |
SEC
News |
Chart |
Request a new note
C
A
S
I |
SPSC
-
NASDAQ
S P S Commerce Inc
COMPUTER SOFTWARE and SERVICES - Application Software
|
$104.36
|
+1.10
1.07% |
$104.48
|
180,528
122.81% of 50 DAV
50 DAV is 147,000
|
$115.00
-9.25%
|
3/26/2019
|
$107.12
|
PP = $113.41
|
|
MB = $119.08
|
Most Recent Note - 5/8/2019 1:37:07 PM
G - Consolidating near its 50 DMA line ($105.49). Prior highs in the $98-100 area define important near-term support to watch. Reported earnings +54% on +13% sales revenues for the quarter ended March 31, 2019 versus the year ago period.
>>> FEATURED STOCK ARTICLE : Sputtering Near 50-Day Average Line Building Base-On-Base - 5/1/2019 |
View all notes |
Set NEW NOTE alert |
Company Profile |
SEC
News |
Chart |
Request a new note
C
A
S
I |
SSNC
-
NASDAQ
S S & C Technologies
COMPUTER SOFTWARE and SERVICES - Application Software
|
$58.86
|
+0.56
0.96% |
$59.02
|
1,306,196
82.93% of 50 DAV
50 DAV is 1,575,000
|
$67.73
-13.10%
|
2/15/2019
|
$59.73
|
PP = $61.07
|
|
MB = $64.12
|
Most Recent Note - 5/8/2019 6:25:33 PM
G - A rebound above its 50 DMA line ($63.12) still is needed for its outlook to improve. Halted its slide after a damaging gap down violated its 50 DMA line triggering a technical sell signal noted on 5/01/19. Reported earnings +72% on +170% sales revenues for the Mar '19 quarter and fundamentals remain strong. See the latest FSU analysis for more details and a new annotated graph.
>>> FEATURED STOCK ARTICLE : Needs Rebound Above 50-Day Average for Outlook to Improve - 5/8/2019 |
View all notes |
Set NEW NOTE alert |
Company Profile |
SEC
News |
Chart |
Request a new note
C
A
S
I |
Symbol/Exchange
Company Name
Industry Group |
PRICE |
CHANGE
(%Change) |
Day High |
Volume
(% DAV)
(% 50 day avg vol) |
52 Wk Hi
% From Hi |
Featured
Date |
Price
Featured |
Pivot Featured |
|
Max Buy |
EPAM
-
NYSE
Epam Systems Inc
COMPUTER SOFTWARE and SERVICES - Information Technology Service
|
$171.14
|
+1.35
0.80% |
$172.58
|
501,624
147.10% of 50 DAV
50 DAV is 341,000
|
$180.55
-5.21%
|
5/9/2019
|
$169.25
|
PP = $180.55
|
|
MB = $189.58
|
Most Recent Note - 5/9/2019 5:27:48 PM
Y - Showed resilience after gapping down today violating its 50 DMA line ($170). Highlighted in yellow in the earlier mid-day report, although it is extended from any recent base, after finding support at the 10 WMA it is considered a valid "secondary buy point" up to +5% above the latest high. Reported earnings +34% on +23% sales revenues for the Mar '19 quarter, continuing its strong earnings track record. Showed resilience and strength after slumping below its 200 DMA line when dropped from the Featured Stocks list on 10/10/18. See the latest FSU analysis for more details and a new annotated graph.
>>> FEATURED STOCK ARTICLE : Found Support and Closed in Upper Third of Day's Range - 5/9/2019 |
View all notes |
Set NEW NOTE alert |
Company Profile |
SEC
News |
Chart |
Request a new note
C
A
S
I |
AUDC
-
NASDAQ
Audiocodes Ltd
ELECTRONICS - Scientific and Technical Instrum
|
$14.35
|
+0.18
1.27% |
$14.39
|
133,367
60.90% of 50 DAV
50 DAV is 219,000
|
$17.44
-17.72%
|
3/20/2019
|
$13.66
|
PP = $15.06
|
|
MB = $15.81
|
Most Recent Note - 5/7/2019 11:30:48 AM
G - Slumping below its 50 DMA line ($14.52) with today's loss. Found prompt support near that important short-term average after abruptly retreating on 4/30/19. Weak action came after reporting earnings +38% on +10% sales revenues for the Mar '19 quarter, still above the +25% minimum earnings guideline (C criteria).
>>> FEATURED STOCK ARTICLE : Earnings News Due for Israel-Based VOIP Firm - 4/29/2019 |
View all notes |
Set NEW NOTE alert |
Company Profile |
SEC
News |
Chart |
Request a new note
C
A
S
I |
ENV
-
NYSE
Envestnet Inc
FINANCIAL SERVICES - Diversified Investments
|
$68.27
|
+0.89
1.32% |
$68.36
|
342,826
106.80% of 50 DAV
50 DAV is 321,000
|
$72.67
-6.05%
|
3/15/2019
|
$66.05
|
PP = $64.90
|
|
MB = $68.15
|
Most Recent Note - 5/9/2019 12:32:52 PM
G - Gapped down today and undercut its 50 DMA line ($66.77) after reporting earnings +5% on +1% sales revenues for the Mar '19 quarter, below the +25% minimum earnings guideline (C criteria). The prior high ($64.80 on 9/14/18) define near-term support to watch on pullbacks.
>>> FEATURED STOCK ARTICLE : Negative Reversal After Another New High - 4/24/2019 |
View all notes |
Set NEW NOTE alert |
Company Profile |
SEC
News |
Chart |
Request a new note
C
A
S
I |
LHCG
-
NASDAQ
L H C Group Inc
HEALTH SERVICES - Home Health Care
|
$116.13
|
+1.07
0.93% |
$116.68
|
217,272
80.17% of 50 DAV
50 DAV is 271,000
|
$116.74
-0.52%
|
4/29/2019
|
$110.94
|
PP = $115.64
|
|
MB = $121.42
|
Most Recent Note - 5/9/2019 3:58:09 PM
Y - Reported earnings +56% on +73% sales revenues for the Mar '19 quarter, continuing its strong earnings track record. Found support near its 50 DMA line today, now challenging its all-time high and near the new pivot point cited based on its 3/22/19 high plus 10 cents. Subsequent gains above the pivot point backed by at least +40% above average volume may trigger a new (or add-on) technical buy signal. Found prompt support at its 200 DMA line.
>>> FEATURED STOCK ARTICLE : Sputtering Near 50-Day Moving Average Line - 4/1/2019 |
View all notes |
Set NEW NOTE alert |
Company Profile |
SEC
News |
Chart |
Request a new note
C
A
S
I |
ENSG
-
NASDAQ
Ensign Group Inc
HEALTH SERVICES - Long-Term Care Facilities
|
$53.97
|
+1.86
3.57% |
$53.98
|
329,035
119.22% of 50 DAV
50 DAV is 276,000
|
$54.56
-1.08%
|
4/30/2019
|
$51.46
|
PP = $53.30
|
|
MB = $55.97
|
Most Recent Note - 5/7/2019 12:41:48 PM
Y - Consolidating above its 50 DMA line ($50.32) and still perched within close striking distance of its pivot point. Color code was changed to yellow with new pivot point cited based on its 4/05/19 high while building on a double bottom base. Reported earnings +22% on +12% sales revenues for the Mar '19 quarter, bellow the +25% minimum earnings guideline (C criteria), raising fundamental concerns. Volume and volatility often increase near earnings news.
>>> FEATURED STOCK ARTICLE : Two Damaging Losses Hurt Outlook - 4/17/2019 |
View all notes |
Set NEW NOTE alert |
Company Profile |
SEC
News |
Chart |
Request a new note
C
A
S
I |
Symbol/Exchange
Company Name
Industry Group |
PRICE |
CHANGE
(%Change) |
Day High |
Volume
(% DAV)
(% 50 day avg vol) |
52 Wk Hi
% From Hi |
Featured
Date |
Price
Featured |
Pivot Featured |
|
Max Buy |
LULU
-
NASDAQ
Lululemon Athletica
MANUFACTURING - Textile Manufacturing
|
$173.68
|
-0.03
-0.02% |
$175.11
|
1,106,902
48.96% of 50 DAV
50 DAV is 2,261,000
|
$179.50
-3.24%
|
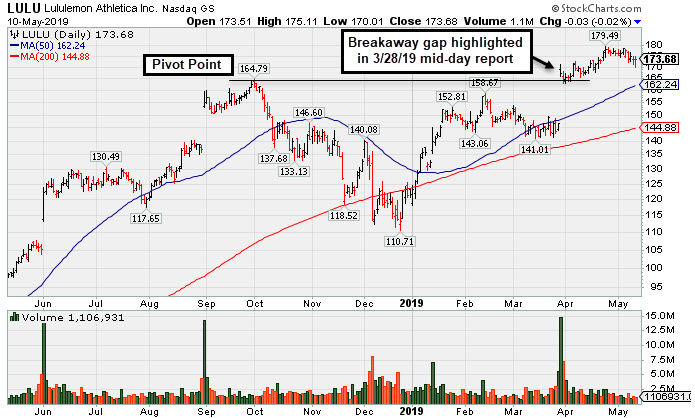
3/28/2019
|
$169.20
|
PP = $164.89
|
|
MB = $173.13
|
 Most Recent Note - 5/10/2019 6:02:57 PM
G - Volume totals have been cooling while hovering near its high. Prior highs in the $164 area define initial support to watch above its 50 DMA line ($162.24). See the latest FSU analysis for more details and a new annotated graph.
>>> FEATURED STOCK ARTICLE : Volume Light While Hovering Near High - 5/10/2019 |
View all notes |
Set NEW NOTE alert |
Company Profile |
SEC
News |
Chart |
Request a new note
C
A
S
I |
NXST
-
NASDAQ
Nexstar Media Group Cl A
MEDIA - Broadcasting - TV
|
$111.65
|
+1.24
1.12% |
$111.88
|
357,090
63.88% of 50 DAV
50 DAV is 559,000
|
$119.93
-6.90%
|
5/1/2019
|
$115.33
|
PP = $120.03
|
|
MB = $126.03
|
Most Recent Note - 5/6/2019 6:39:22 PM
Y - Posted a gain today with above average volume after slumping near its 50 DMA line ($109) which defines near-term support to watch. More damaging losses would raise greater concerns. Due to report earnings results before the market opens on Wednesday, May 8, 2019. Subsequent gains above the pivot point backed by at least +40% above average volume may trigger a new (or add-on) technical buy signal.
>>> FEATURED STOCK ARTICLE : Hitting New High and Very Extended From Prior Base - 4/4/2019 |
View all notes |
Set NEW NOTE alert |
Company Profile |
SEC
News |
Chart |
Request a new note
C
A
S
I |
ULTA
-
NASDAQ
Ulta Beauty Inc
SPECIALTY RETAIL - Specialty Retail, Other
|
$343.24
|
-4.81
-1.38% |
$347.01
|
683,155
88.95% of 50 DAV
50 DAV is 768,000
|
$359.69
-4.57%
|
3/15/2019
|
$341.27
|
PP = $322.59
|
|
MB = $338.72
|
Most Recent Note - 5/8/2019 1:43:04 PM
G - Found support at its 50 DMA line ($338) which defines important near term support above prior highs. A violation of the 50 DMA line and recent low ($334.94) would raise concerns and trigger a technical sell signal
>>> FEATURED STOCK ARTICLE : Volume Totals Cooling in Recent Weeks While Hovering Near High - 4/26/2019 |
View all notes |
Set NEW NOTE alert |
Company Profile |
SEC
News |
Chart |
Request a new note
C
A
S
I |
UBNT
-
NASDAQ
Ubiquiti Networks
TELECOMMUNICATIONS - Diversified Communication Serv
|
$139.39
|
-17.03
-10.89% |
$151.40
|
1,897,217
551.52% of 50 DAV
50 DAV is 344,000
|
$174.95
-20.33%
|
2/8/2019
|
$121.97
|
PP = $115.54
|
|
MB = $121.32
|
Most Recent Note - 5/10/2019 10:20:06 AM
G - Reported earnings +29% on +14% sales revenues for the Mar '19 quarter. Gapped down for a 2nd consecutive session today violating its 50 DMA line ($156) and abruptly undercutting the prior high ($148.68 on 2/27/19) triggering technical sell signals. A rebound above the 50 DMA line is needed for its outlook to improve.
>>> FEATURED STOCK ARTICLE : Extended From Any Sound Bass and Wedging to New Highs - 4/12/2019 |
View all notes |
Set NEW NOTE alert |
Company Profile |
SEC
News |
Chart |
Request a new note
C
A
S
I |
ESNT
-
NYSE
Essent Group Ltd
Finance-MrtgandRel Svc
|
$47.31
|
+0.50
1.07% |
$47.75
|
956,651
151.85% of 50 DAV
50 DAV is 630,000
|
$48.88
-3.21%
|
3/18/2019
|
$45.84
|
PP = $45.06
|
|
MB = $47.31
|
Most Recent Note - 5/8/2019 12:33:03 PM
Y - Sputtering since it recently reported earnings +15% on +20% sales revenues for the Mar '19 quarter, below the +25% minimum earnings guideline (C criteria), raising fundamental concerns. Found support above its 50 DMA line ($45) reassuringly during the recent consolidation. Faces very little resistance due to overhead supply up to the $50 level.
>>> FEATURED STOCK ARTICLE : Perched Above Pivot Point With Earnings News Due May 3rd - 4/25/2019 |
View all notes |
Set NEW NOTE alert |
Company Profile |
SEC
News |
Chart |
Request a new note
C
A
S
I |
Symbol/Exchange
Company Name
Industry Group |
PRICE |
CHANGE
(%Change) |
Day High |
Volume
(% DAV)
(% 50 day avg vol) |
52 Wk Hi
% From Hi |
Featured
Date |
Price
Featured |
Pivot Featured |
|
Max Buy |
FIVE
-
NASDAQ
Five Below Inc
Retail-DiscountandVariety
|
$135.38
|
-1.20
-0.88% |
$137.76
|
898,998
80.48% of 50 DAV
50 DAV is 1,117,000
|
$148.22
-8.66%
|
4/11/2019
|
$132.05
|
PP = $133.75
|
|
MB = $140.44
|
Most Recent Note - 5/6/2019 6:34:25 PM
G - Pulled back today for a loss with near average volume. Recent gains lacked great volume conviction. Prior highs in the $133-136 area define initial support to watch.
>>> FEATURED STOCK ARTICLE : Finished Strong After Featured Again in Mid-Day Report - 4/11/2019 |
View all notes |
Set NEW NOTE alert |
Company Profile |
SEC
News |
Chart |
Request a new note
C
A
S
I |
NOW
-
NYSE
Servicenow Inc
Computer Sftwr-Enterprse
|
$274.90
|
+4.41
1.63% |
$275.20
|
1,747,583
95.29% of 50 DAV
50 DAV is 1,834,000
|
$273.82
0.39%
|
4/22/2019
|
$242.64
|
PP = $251.75
|
|
MB = $264.34
|
Most Recent Note - 5/9/2019 3:50:58 PM
G - Quietly rising near its all-time high with today's gain. Bullish action was noted after it reported earnings +20% on +34% sales revenues for the Mar '19 quarter, below the +25% minimum earnings guideline (C criteria), raising concerns, fundamentally. Prior high ($251.65 on 3/21/19) and its 50 DMA line ($247) define near-term support to watch.
>>> FEATURED STOCK ARTICLE : Found Recent Support at 50-Day Moving Average - 4/15/2019 |
View all notes |
Set NEW NOTE alert |
Company Profile |
SEC
News |
Chart |
Request a new note
C
A
S
I |
PANW
-
NYSE
Palo Alto Networks
Computer Sftwr-Security
|
$234.95
|
-2.88
-1.21% |
$238.48
|
1,421,537
125.47% of 50 DAV
50 DAV is 1,133,000
|
$260.63
-9.85%
|
2/25/2019
|
$233.54
|
PP = $239.60
|
|
MB = $251.58
|
Most Recent Note - 5/10/2019 1:07:57 PM
G - Weakness today had it briefly undercut prior lows in the $230-231 area noted as the next important support to watch. Color code was changed to green after violating its 50 DMA line ($241.84) with a big loss raising concerns on Tuesday. A prompt rebound above the 50 DMA line is needed for its outlook to improve. Fundamentals remain strong.
>>> FEATURED STOCK ARTICLE : Consolidating Above Prior High and 50-Day Average - 4/3/2019 |
View all notes |
Set NEW NOTE alert |
Company Profile |
SEC
News |
Chart |
Request a new note
C
A
S
I |
QLYS
-
NASDAQ
Qualys Inc
Computer Sftwr-Security
|
$87.49
|
+1.10
1.27% |
$87.71
|
302,063
92.77% of 50 DAV
50 DAV is 325,600
|
$98.30
-11.00%
|
5/2/2019
|
$91.25
|
PP = $98.40
|
|
MB = $103.32
|
Most Recent Note - 5/9/2019 3:48:45 PM
G - Testing its 50 DMA line ($84.44) today which defines near term support. Encountered distributional pressure in the past week after challenging previously stubborn resistance in the $97-98 area. Its Relative Strength Rating has slumped to 67, below the 80+ minimum guideline for buy candidates and its color code is changed to green. Improvement and subsequent volume-driven gains above the pivot point are needed to trigger a technical buy signal. Reported earnings +36% on +16% sales revenues for the Mar '19 quarter, continuing its strong earnings history.
>>> FEATURED STOCK ARTICLE : Rallying to Challenge Previously Stubborn Resistance - 5/2/2019 |
View all notes |
Set NEW NOTE alert |
Company Profile |
SEC
News |
Chart |
Request a new note
C
A
S
I |
PAYC
-
NYSE
Paycom Software Inc
COMPUTER SOFTWARE and SERVICES - Application Software
|
$208.39
|
+0.50
0.24% |
$210.55
|
684,143
111.24% of 50 DAV
50 DAV is 615,000
|
$209.92
-0.73%
|
2/6/2019
|
$171.66
|
PP = $164.18
|
|
MB = $172.39
|
Most Recent Note - 5/9/2019 3:54:05 PM
G - Hitting another new all-time high with today's gain backed by above average volume. It is extended from any sound base. Reported earnings +25% on +30% sales revenues for the Mar '19 quarter. Its 50 DMA line ($188.76) defines important near-term support to watch.
>>> FEATURED STOCK ARTICLE : Paycom Software Quietly Hovering Near All-Time High - 4/16/2019 |
View all notes |
Set NEW NOTE alert |
Company Profile |
SEC
News |
Chart |
Request a new note
C
A
S
I |
Symbol/Exchange
Company Name
Industry Group |
PRICE |
CHANGE
(%Change) |
Day High |
Volume
(% DAV)
(% 50 day avg vol) |
52 Wk Hi
% From Hi |
Featured
Date |
Price
Featured |
Pivot Featured |
|
Max Buy |
PYPL
-
NASDAQ
Paypal Holdings Inc
Finance-CrdtCard/PmtPr
|
$110.41
|
+0.68
0.62% |
$110.68
|
3,729,009
57.99% of 50 DAV
50 DAV is 6,430,000
|
$113.69
-2.89%
|
1/24/2019
|
$92.56
|
PP = $93.80
|
|
MB = $98.49
|
Most Recent Note - 5/8/2019 1:34:46 PM
G - Hovering near its all-time high, extended from any sound base. Still well above its 50 DMA line ($104.36) which defines support to watch. Recently reported earnings +37% on +12% sales revenues for the Mar '19 quarter, continuing its strong earnings track record.
>>> FEATURED STOCK ARTICLE : Extended From Base After Gains in Recent Weeks Lacking Volume - 4/2/2019 |
View all notes |
Set NEW NOTE alert |
Company Profile |
SEC
News |
Chart |
Request a new note
C
A
S
I |
ALRM
-
NASDAQ
Alarm.com Holdings Inc
Security/Sfty
|
$63.95
|
-5.73
-8.22% |
$65.88
|
1,622,880
373.94% of 50 DAV
50 DAV is 434,000
|
$71.50
-10.57%
|
1/22/2019
|
$60.52
|
PP = $60.30
|
|
MB = $63.32
|
Most Recent Note - 5/10/2019 12:15:42 PM
G - Gapped down today and violated its 50 DMA line ($65) with a damaging volume-driven loss triggering a technical sell signal. Weak action came after it reported earnings +0% on +21% sales revenues for the Mar '19 quarter, marking its 2nd consecutive quarterly comparison below the +25% minimum earnings guideline (C criteria).
>>> FEATURED STOCK ARTICLE : Consolidating Near 50-Day Average Following Sub Par Report - 3/29/2019 |
View all notes |
Set NEW NOTE alert |
Company Profile |
SEC
News |
Chart |
Request a new note
C
A
S
I |
PLNT
-
NYSE
Planet Fitness Inc Cl A
Leisure-Services
|
$78.60
|
+0.43
0.55% |
$78.99
|
1,413,667
94.88% of 50 DAV
50 DAV is 1,490,000
|
$78.17
0.55%
|
11/7/2018
|
$57.10
|
PP = $55.45
|
|
MB = $58.22
|
Most Recent Note - 5/8/2019 6:28:34 PM
G - Posted a third consecutive gain with near average volume for a new best-ever close. It remains very extended from any sound base. Found prompt support at its 50 DMA line ($69.59) when a big volume-driven loss came after reporting earnings +30% on +23% sales revenues for its first quarter ended March 31, 2019.
>>> FEATURED STOCK ARTICLE : Perched Near High Very Extended From Prior Base - 4/5/2019 |
View all notes |
Set NEW NOTE alert |
Company Profile |
SEC
News |
Chart |
Request a new note
C
A
S
I |
TEAM
-
NASDAQ
Atlassian Corp Plc Cl A
Comp Sftwr-Spec Enterprs
|
$128.87
|
+3.74
2.99% |
$129.97
|
3,707,417
202.81% of 50 DAV
50 DAV is 1,828,000
|
$125.31
2.84%
|
4/16/2019
|
$114.77
|
PP = $116.80
|
|
MB = $122.64
|
Most Recent Note - 5/10/2019 1:21:37 PM
G - Today's 7th consecutive gain has it powering further into new all-time high territory, quickly getting extended from any sound base. Repaired technical damage after violating its 50 DMA line with a big gap down on 4/18/19. Reported earnings +133% on +38% sales revenues for the Mar '19 quarter, continuing its strong earnings track record.
>>> FEATURED STOCK ARTICLE : Perched Near High Enduring Distributional Pressure - 4/9/2019 |
View all notes |
Set NEW NOTE alert |
Company Profile |
SEC
News |
Chart |
Request a new note
C
A
S
I |
GLOB
-
NYSE
Globant SA
Computer-Tech Services
|
$85.49
|
+5.49
6.86% |
$85.70
|
651,901
324.33% of 50 DAV
50 DAV is 201,000
|
$85.00
0.58%
|
2/15/2019
|
$69.35
|
PP = $70.00
|
|
MB = $73.50
|
Most Recent Note - 5/10/2019 12:39:52 PM
G - Reported earnings +32% on +22% sales revenues for the quarter ended March 31st, 2019 versus the year ago period, continuing its strong earning track record. Pulled back and tested support at its 50 DMA line ($75.91) then manged a "positive reversal" and rebounded to touch a new all-time high today. Extended from any sound base. Near-term support is at its 50 DMA line and the prior high ($74). Violations would raise concerns and trigger technical sell signals.
>>> FEATURED STOCK ARTICLE : Earnings News Due While Perched Near All-Time High - 5/7/2019 |
View all notes |
Set NEW NOTE alert |
Company Profile |
SEC
News |
Chart |
Request a new note
C
A
S
I |
Symbol/Exchange
Company Name
Industry Group |
PRICE |
CHANGE
(%Change) |
Day High |
Volume
(% DAV)
(% 50 day avg vol) |
52 Wk Hi
% From Hi |
Featured
Date |
Price
Featured |
Pivot Featured |
|
Max Buy |
TTD
-
NASDAQ
The Trade Desk Inc Cl A
Comml Svcs-Advertising
|
$183.51
|
-6.41
-3.38% |
$192.67
|
3,713,082
243.00% of 50 DAV
50 DAV is 1,528,000
|
$232.70
-21.14%
|
4/22/2019
|
$211.03
|
PP = $214.80
|
|
MB = $225.54
|
Most Recent Note - 5/9/2019 3:35:13 PM
G - Color code is changed to green after violating its 50 DMA line with a big volume-driven loss today triggering a technical sell signal. Reported earnings +44% on +41% sales revenues for the Mar '19 quarter, continuing its strong earnings track record. Disciplined investors will note that gains above the pivot point did not have the volume necessary to trigger a proper new (or add-on) technical buy signal. The next important support to watch is the prior low ($178.30 on 3/27/19).
>>> FEATURED STOCK ARTICLE : Pulled Back Below "Max Buy" Level After Wedging Higher - 4/30/2019 |
View all notes |
Set NEW NOTE alert |
Company Profile |
SEC
News |
Chart |
Request a new note
C
A
S
I |