You are not logged in.
This means you
CAN ONLY VIEW reports that were published prior to Friday, February 23, 2024.
You
MUST UPGRADE YOUR MEMBERSHIP if you want to see any current reports.
AFTER MARKET UPDATE - THURSDAY, MAY 7TH, 2020
Previous After Market Report Next After Market Report >>>
|
|
|
|
DOW |
+211.25 |
23,875.89 |
+0.89% |
|
Volume |
955,307,767 |
+6% |
|
Volume |
3,687,667,500 |
+1% |
|
NASDAQ |
+125.27 |
8,979.66 |
+1.41% |
|
Advancers |
2,090 |
73% |
|
Advancers |
2,227 |
70% |
|
S&P 500 |
+32.77 |
2,881.19 |
+1.15% |
|
Decliners |
767 |
27% |
|
Decliners |
965 |
30% |
|
Russell 2000 |
+19.92 |
1,282.93 |
+1.58% |
|
52 Wk Highs |
27 |
|
|
52 Wk Highs |
66 |
|
|
S&P 600 |
+11.05 |
740.46 |
+1.51% |
|
52 Wk Lows |
15 |
|
|
52 Wk Lows |
14 |
|
|
 |
Breadth Positive and Leadership Improved as Major Indices Rose
Kenneth J. Gruneisen - Passed the CAN SLIM® Master's Exam
The Dow advanced 211 points, while the S&P 500 climbed 1.2%. The Nasdaq Composite gained 1.4%, with the Tech-heavy index pushing into positive territory for the year. Breadth was positive as advancers led decliners by almost a 3-1 margin on the NYSE and more than 2-1 on the Nasdaq exchange. The reported volume totals were higher than the prior session on the NYSE and on the Nasdaq exchange. There were 33 high-ranked companies from the Leaders List that hit new 52-week highs and were listed on the BreakOuts Page, versus the 25 on the prior session. New 52-week highs outnumbered new lows on the NYSE and on the Nasdaq exchange. The major indices are in a confirmed uptrend (M criteria). Any sustainable rally requires a healthy crop of new leaders, so the latest improvement is a reassuring sign. Charts used courtesy of www.stockcharts.com
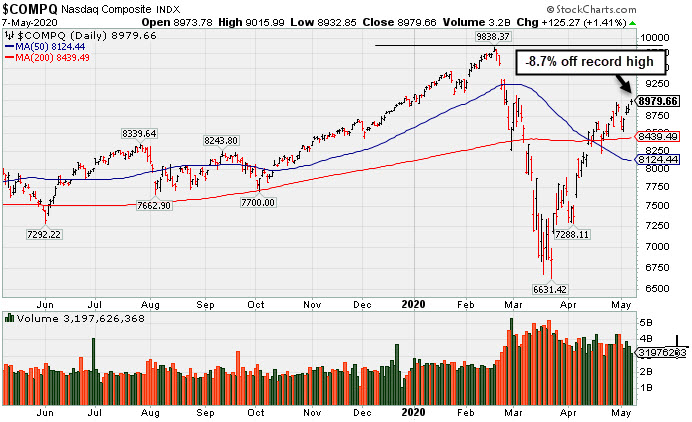
PICTURED: The Nasdaq Composite Index recently rebounded above its 50-day and 200-day moving average (DMA) lines and has made it back into positive territory for 2020 year-to-date.
Stocks finished higher Thursday as investors weighed geopolitical, economic, and corporate earnings updates. Helping boost investor sentiment was news that top U.S. and Chinese trade negotiators plan to meet as early as next week.
On the data front, initial jobless claims came in at 3.1 million in the week ending May 2, easing slightly from the prior 3.8 million figure. The seven week tally now totals roughly 33.5 million. Overseas, Chinese exports rose at an annualized 3.5% pace in April, sharply contrasting consensus expectations for a 15.7% drop. Treasuries advanced, with the yield on the two-year note hitting a record low after falling five basis points to 0.13%. The yield on the benchmark 10-year note slipped seven basis point to 0.63%. In commodities, WTI crude lost 3.1% to $23.25/barrel, paring early gains of more than 8.0%.
Nine of 11 S&P 500 sectors finished the session in positive territory, with Health Care and Consumer Staples bucking the uptrend. In earnings, Lyft (LYFT +21.67%) rose as a 23% spike in revenue from a year earlier appears to be overshadowing a worse than expected quarterly loss. Meanwhile, PayPal (PYPL +14.01%) gapped up to a new all-time high after projecting a solid recovery this quarter following a disappointing profit tally. Shares of Twilio (TWLO +39.62) blasted higher after easily beating earnings estimates and offering better than expected guidance. In other corporate news, stocks that would benefit from a reopened economy gained with MGM Resorts Intl (MGM +7.33%) rising. |
 Kenneth J. Gruneisen started out as a licensed stockbroker in August 1987, a couple of months prior to the historic stock market crash that took the Dow Jones Industrial Average down -22.6% in a single day. He has published daily fact-based fundamental and technical analysis on high-ranked stocks online for two decades. Through FACTBASEDINVESTING.COM, Kenneth provides educational articles, news, market commentary, and other information regarding proven investment systems that work in good times and bad.
Comments contained in the body of this report are technical opinions only and are not necessarily those of Gruneisen Growth Corp. The material herein has been obtained from sources believed to be reliable and accurate, however, its accuracy and completeness cannot be guaranteed. Our firm, employees, and customers may effect transactions, including transactions contrary to any recommendation herein, or have positions in the securities mentioned herein or options with respect thereto. Any recommendation contained in this report may not be suitable for all investors and it is not to be deemed an offer or solicitation on our part with respect to the purchase or sale of any securities. |
|
 |
Financial, Tech, Retail, and Commodity-Linked Groups Rose
Kenneth J. Gruneisen - Passed the CAN SLIM® Master's Exam
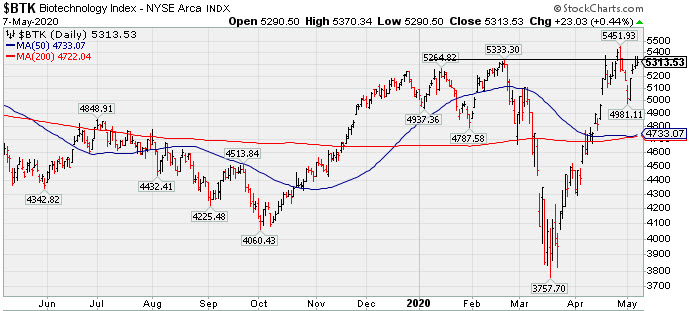
The Bank Index ($BKX +2.06%) and the Broker/Dealer Index ($XBD +3.79%) both posted solid gains. The tech sector had a positive bias as the Networking Index ($NWX +2.25%) outpaced the Semiconductor Index ($SOX +1.01%) and Biotech Index ($BTK +0.44%). The Retail Index ($RLX +1.10%) also rose. Commodity-linked groups also had a positive bias as the Oil Services Index ($OSX +4.29%), Integrated Oil Index ($XOI +2.45%), and the Gold & Silver Index ($XAU +3.75%) each gained ground. PICTURED: The Biotech Index ($BTK +0.44%) stalled after recently rebounding and rallying to a new 2020 high.
| Oil Services |
$OSX |
28.32 |
+1.16 |
+4.27% |
-63.83% |
| Integrated Oil |
$XOI |
761.18 |
+18.36 |
+2.47% |
-40.09% |
| Semiconductor |
$SOX |
1,724.93 |
+17.18 |
+1.01% |
-6.74% |
| Networking |
$NWX |
517.13 |
+11.41 |
+2.26% |
-11.36% |
| Broker/Dealer |
$XBD |
239.80 |
+8.77 |
+3.79% |
-17.42% |
| Retail |
$RLX |
2,630.13 |
+28.63 |
+1.10% |
+7.38% |
| Gold & Silver |
$XAU |
122.30 |
+4.41 |
+3.74% |
+14.38% |
| Bank |
$BKX |
69.16 |
+1.39 |
+2.05% |
-38.99% |
| Biotech |
$BTK |
5,313.53 |
+23.03 |
+0.44% |
+4.86% |
|
|
|
 |
Gap Up and Big Volume-Driven Gain for Computer Security Firm
Kenneth J. Gruneisen - Passed the CAN SLIM® Master's Exam
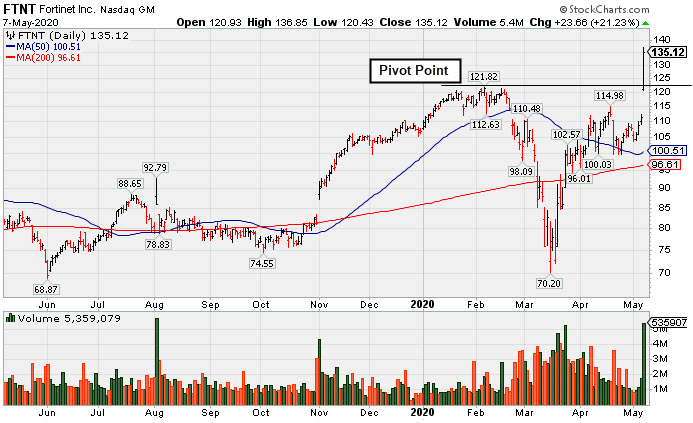
Fortinet Inc (FTNT +$23.66 or +21.23% to $135.12) finished strong after highlighted in yellow with new pivot point cited based on its 2/06/20 high plus 10 cents in the earlier mid-day report (read here). Fundamentals remain strong. Bullish action came after reporting earnings +30% on +22% sales revenues for the Mar '20 quarter, its 9th consecutive quarterly comparison with earnings above the +25% minimum guideline (C criteria). Annual earnings (A criteria) have been improving since FY '14, also helping it match with the fact-based investment system's guidelines.
It hit a new all-time high with today's big "breakaway gap" and considerable gain backed by above average volume triggering a technical buy signal. A "breakaway gap" is the one exception to the rule where a stock may be bought more than +5% above the prior high, however, the further above the prior high any stock is purchased the greater the risk increases of being stopped out on an ordinary pullback. Disciplined investors always limit losses by selling any stocks that fall more than -7-8% from their purchase price. FTNT was last shown in this FSU section on 2/26/20 with an annotated graph under the headline, "Volume Driven Losses Violated 50-Day Moving Average". It rebounded impressively after slumping well below its 200 DMA line since dropped from the Featured Stocks list on 3/09/20.
The number of top-rated funds owning its shares rose from 960 in Jun '18 to 1,574 in Mar '20, a reassuring sign concerning the I criteria. Its current Up/Down Volume ratio of 1.0 is an unbiased indication its shares have been neutral concerning accumulation/distribution over the past 50 days. It has a Timeliness rating of A and Sponsorship rating of B.
Charts courtesy of www.stockcharts.com
 |
|
|
Color Codes Explained :
Y - Better candidates highlighted by our
staff of experts.
G - Previously featured
in past reports as yellow but may no longer be buyable under the
guidelines.
***Last / Change / Volume data in this table is the closing quote data***
Symbol/Exchange
Company Name
Industry Group |
PRICE |
CHANGE
(%Change) |
Day High |
Volume
(% DAV)
(% 50 day avg vol) |
52 Wk Hi
% From Hi |
Featured
Date |
Price
Featured |
Pivot Featured |
|
Max Buy |
 FTNT
-
NASDAQ
FTNT
-
NASDAQ
Fortinet Inc
Computer Sftwr-Security
|
$135.12
|
+23.66
21.23% |
$136.85
|
5,326,785
213.16% of 50 DAV
50 DAV is 2,499,000
|
$121.82
10.92%
|
5/7/2020
|
$134.40
|
PP = $121.92
|
|
MB = $128.02
|
 Most Recent Note - 5/7/2020 6:39:40 PM
Y - Finished strong today after highlighted in yellow with new pivot point cited based on its 2/06/20 high plus 10 cents. Fundamentals remain strong. Bullish action came after it reported earnings +30% on +22% sales revenues for the Mar '20 quarter. Hit a new all-time high with a big "breakaway gap" backed by +114% above average volume triggering a technical buy signal. Rebounded impressively after slumping well below its 200 DMA line since dropped from the Featured Stocks list on 3/09/20. See the latest FSU analysis for more details and a new annotated graph.
>>> FEATURED STOCK ARTICLE : Gap Up and Big Volume-Driven Gain for Computer Security Firm - 5/7/2020 |
View all notes |
Set NEW NOTE alert |
Company Profile |
SEC
News |
Chart |
Request a new note
C
A
S
I |
EBS
-
NYSE
Emergent Biosolutions
DRUGS - Biotechnology
|
$79.25
|
-0.23
-0.29% |
$80.42
|
398,059
68.51% of 50 DAV
50 DAV is 581,000
|
$83.01
-4.53%
|
4/24/2020
|
$72.10
|
PP = $73.99
|
|
MB = $77.69
|
Most Recent Note - 5/5/2020 5:17:10 PM
G - Perched near its all-time high today after its best ever close. Prior highs in the $71-73 area define initial support to watch on pullbacks.
>>> FEATURED STOCK ARTICLE : Volume-Driven Gain for Vaccine Maker With Great Earnings History - 4/24/2020 |
View all notes |
Set NEW NOTE alert |
Company Profile |
SEC
News |
Chart |
Request a new note
C
A
S
I |
TREX
-
NYSE
Trex Company Inc
MATERIALS and CONSTRUCTION - General Building Materials
|
$110.33
|
-1.62
-1.45% |
$114.38
|
859,715
78.44% of 50 DAV
50 DAV is 1,096,000
|
$114.48
-3.63%
|
5/5/2020
|
$109.05
|
PP = $111.95
|
|
MB = $117.55
|
Most Recent Note - 5/6/2020 7:24:56 PM
Y - Posted a gain today with average volume closing at its pivot point. Subsequent gains and strong close above the pivot point backed by at least +40% above average volume may clinch a convincing technical buy signal. See the latest FSU analysis for more details and an annotated graph.
>>> FEATURED STOCK ARTICLE : Gapped Up for Volume-Driven Gain and Hit a New All-Time High - 5/5/2020 |
View all notes |
Set NEW NOTE alert |
Company Profile |
SEC
News |
Chart |
Request a new note
C
A
S
I |
NFLX
-
NASDAQ
Netflix Inc
SPECIALTY RETAIL - Music and Video Stores
|
$436.53
|
+2.27
0.52% |
$438.88
|
5,499,851
56.44% of 50 DAV
50 DAV is 9,745,000
|
$449.52
-2.89%
|
4/13/2020
|
$393.60
|
PP = $393.62
|
|
MB = $413.30
|
Most Recent Note - 5/6/2020 7:16:52 PM
G - Posted another gain today with light volume. Prior highs in the $393 area acted as support following the recent breakout. Fundamentals remain strong after it reported earnings +107% on +28% sales revenues for the Mar '20 quarter versus the year ago period. See the latest FSU analysis for more details and a new annotated graph.
>>> FEATURED STOCK ARTICLE : Prior Highs Acted as Support Following Recent Breakout - 5/6/2020 |
View all notes |
Set NEW NOTE alert |
Company Profile |
SEC
News |
Chart |
Request a new note
C
A
S
I |
NOW
-
NYSE
Servicenow Inc
Computer Sftwr-Enterprse
|
$381.83
|
+16.44
4.50% |
$386.57
|
2,741,995
97.55% of 50 DAV
50 DAV is 2,811,000
|
$379.80
0.53%
|
4/30/2020
|
$343.05
|
PP = $363.05
|
|
MB = $381.20
|
Most Recent Note - 5/7/2020 6:41:21 PM
Y - Hit another new high challenging its "max buy" level with today's big gain backed by near average volume. Gains above the pivot point should be backed by at least +40% above average volume to clinch a proper technical buy signal.
>>> FEATURED STOCK ARTICLE : Fundamental Strength Continues; Volume Heavy Behind Big Gain - 4/30/2020 |
View all notes |
Set NEW NOTE alert |
Company Profile |
SEC
News |
Chart |
Request a new note
C
A
S
I |
Symbol/Exchange
Company Name
Industry Group |
PRICE |
CHANGE
(%Change) |
Day High |
Volume
(% DAV)
(% 50 day avg vol) |
52 Wk Hi
% From Hi |
Featured
Date |
Price
Featured |
Pivot Featured |
|
Max Buy |
QLYS
-
NASDAQ
Qualys Inc
Computer Sftwr-Security
|
$111.25
|
+5.84
5.54% |
$111.79
|
716,168
130.69% of 50 DAV
50 DAV is 548,000
|
$110.89
0.32%
|
4/9/2020
|
$100.44
|
PP = $97.22
|
|
MB = $102.08
|
Most Recent Note - 5/7/2020 6:44:49 PM
G - Hit a new all-time high with above average volume behind today's 4th consecutive gain after testing prior highs in the $97 area which acted as support. Reported Mar '20 quarterly earnings +33% on +14% sales revenues versus the year ago period, continuing its strong earnings track record. Volume and volatility often increase near earnings news.
>>> FEATURED STOCK ARTICLE : Volume Totals Cooling While Stubbornly Holding Ground Near High - 4/27/2020 |
View all notes |
Set NEW NOTE alert |
Company Profile |
SEC
News |
Chart |
Request a new note
C
A
S
I |
TEAM
-
NASDAQ
Atlassian Corp Plc Cl A
Comp Sftwr-Spec Enterprs
|
$179.78
|
+6.86
3.97% |
$180.64
|
2,258,705
107.81% of 50 DAV
50 DAV is 2,095,000
|
$176.15
2.06%
|
5/4/2020
|
$159.70
|
PP = $156.22
|
|
MB = $164.03
|
Most Recent Note - 5/7/2020 6:45:57 PM
G - Posted a 4th consecutive gain today, getting more extended from the previously noted base. Prior highs in the $156 area define initial support to watch on pullbacks.
>>> FEATURED STOCK ARTICLE : Volume-Driven Gain For New All-Time High - 5/4/2020 |
View all notes |
Set NEW NOTE alert |
Company Profile |
SEC
News |
Chart |
Request a new note
C
A
S
I |
|
|
|
THESE ARE NOT BUY RECOMMENDATIONS!
Comments contained in the body of this report are technical
opinions only. The material herein has been obtained
from sources believed to be reliable and accurate, however,
its accuracy and completeness cannot be guaranteed.
This site is not an investment advisor, hence it does
not endorse or recommend any securities or other investments.
Any recommendation contained in this report may not
be suitable for all investors and it is not to be deemed
an offer or solicitation on our part with respect to
the purchase or sale of any securities. All trademarks,
service marks and trade names appearing in this report
are the property of their respective owners, and are
likewise used for identification purposes only.
This report is a service available
only to active Paid Premium Members.
You may opt-out of receiving report notifications
at any time. Questions or comments may be submitted
by writing to Premium Membership Services 665 S.E. 10 Street, Suite 201 Deerfield Beach, FL 33441-5634 or by calling 1-800-965-8307
or 954-785-1121.
|
|
|