You are not logged in.
This means you
CAN ONLY VIEW reports that were published prior to Monday, February 19, 2024.
You
MUST UPGRADE YOUR MEMBERSHIP if you want to see any current reports.
AFTER MARKET UPDATE - WEDNESDAY, MAY 6TH, 2020
Previous After Market Report Next After Market Report >>>
|
|
|
|
DOW |
-218.45 |
23,664.64 |
-0.91% |
|
Volume |
904,468,317 |
-2% |
|
Volume |
3,643,933,800 |
-6% |
|
NASDAQ |
+45.27 |
8,854.39 |
+0.51% |
|
Advancers |
901 |
31% |
|
Advancers |
1,332 |
42% |
|
S&P 500 |
-20.02 |
2,848.42 |
-0.70% |
|
Decliners |
1,983 |
69% |
|
Decliners |
1,862 |
58% |
|
Russell 2000 |
-10.50 |
1,263.01 |
-0.82% |
|
52 Wk Highs |
24 |
|
|
52 Wk Highs |
61 |
|
|
S&P 600 |
-9.30 |
729.41 |
-1.26% |
|
52 Wk Lows |
19 |
|
|
52 Wk Lows |
32 |
|
|
 |
Nasdaq Rose While Dow and S&P 500 Index Reversed to Close Lower
Kenneth J. Gruneisen - Passed the CAN SLIM® Master's Exam
Both the Dow and S&P 500 reversed early session gains to close lower, down 218 points and 0.7%, respectively. The Nasdaq Composite bucked the downtrend, adding 0.5%. Breadth was negative as decliners led advancers by an 2-1 margin on the NYSE and 3-2 on the Nasdaq exchange. The reported volume totals were lighter than the prior session on the NYSE and on the Nasdaq exchange. There were 25 high-ranked companies from the Leaders List that hit new 52-week highs and were listed on the BreakOuts Page, matching the 25 on the prior session. New 52-week highs outnumbered new lows on the NYSE and on the Nasdaq exchange. The major indices are in a confirmed uptrend (M criteria). Any sustainable rally requires a healthy crop of new leaders, so the latest improvement is a reassuring sign. Charts used courtesy of www.stockcharts.com
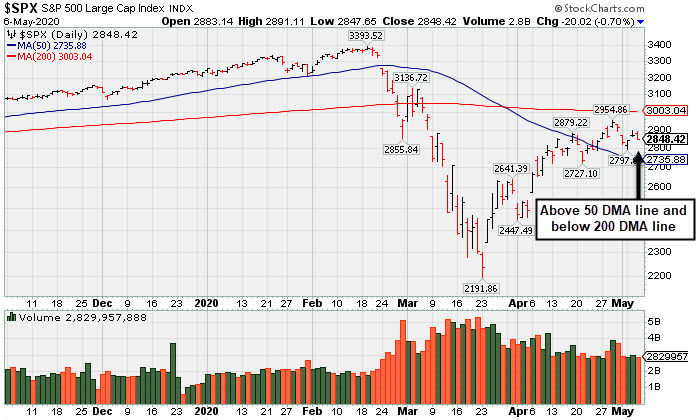
PICTURED: The S&P 500 Index has been consolidating after recently rebounding above its 50-day moving average (DMA) line, still below its 200 DMA line.
Stocks finished mixed on Wednesday as investors weighed bleak employment data against optimism that U.S. business activity would start to pick up as more states eased lockdown restrictions. President Trump noted that the coronavirus task force would continue operating, though its focus would shift to reopening efforts and developing a vaccine.
Nine of 11 S&P 500 sectors ended in negative territory, with Utilities leading decliners, sliding 3.5%. The Technology group continued its recent outperformance, adding 0.7%. In earnings, shares of Disney (DIS -0.18%) edged lower on mixed results that included eliminating its July dividend, though the entertainment conglomerate mentioned plans to reopen its Shanghai Disneyland park next week to a limited number of guests. Elsewhere, General Motors (GM +2.98%) rose after its quarterly profit more than doubled consensus expectations, while CVS Health (CVS -1.31%) fell despite reiterating its full-year guidance.
Treasuries declined, with the yield on the 10-year note up five basis points to 0.70%, near its highest level in three weeks. Government bonds were pressured after the U.S. Treasury Department announced plans to significantly increase its quarterly long-term debt issuance, including a 20-year bond sale, to help fund a swelling federal deficit. On the data front, the ADP revealed private sector employment fell by a record 20.2 million in April. In commodities, WTI crude was down more than 2%, snapping a five-day winning streak. Meanwhile, a gauge of the U.S. dollar climbed the most in three weeks, rising 0.5%. |
 Kenneth J. Gruneisen started out as a licensed stockbroker in August 1987, a couple of months prior to the historic stock market crash that took the Dow Jones Industrial Average down -22.6% in a single day. He has published daily fact-based fundamental and technical analysis on high-ranked stocks online for two decades. Through FACTBASEDINVESTING.COM, Kenneth provides educational articles, news, market commentary, and other information regarding proven investment systems that work in good times and bad.
Comments contained in the body of this report are technical opinions only and are not necessarily those of Gruneisen Growth Corp. The material herein has been obtained from sources believed to be reliable and accurate, however, its accuracy and completeness cannot be guaranteed. Our firm, employees, and customers may effect transactions, including transactions contrary to any recommendation herein, or have positions in the securities mentioned herein or options with respect thereto. Any recommendation contained in this report may not be suitable for all investors and it is not to be deemed an offer or solicitation on our part with respect to the purchase or sale of any securities. |
|
 |
Retail, Semiconductor, and Biotech Indexes Rose
Kenneth J. Gruneisen - Passed the CAN SLIM® Master's Exam
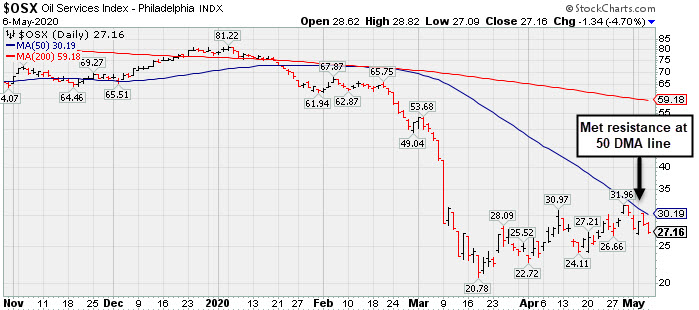
The tech sector was mixed as the Semiconductor Index ($SOX +1.08%) and Biotech Index ($BTK +0.66%) rose but the Networking Index ($NWX -1.71%) fell. The Retail Index ($RLX +0.64%) notched a modest gain. The Bank Index ($BKX -1.97%) and the Broker/Dealer Index ($XBD -1.97%) both lost ground. Commodity-linked groups had a negative bias as the Oil Services Index ($OSX -4.70%), Integrated Oil Index ($XOI -2.85%), and the Gold & Silver Index ($XAU -2.87%) each lost ground. PICTURED: The Oil Services Index ($OSX -4.70%) recently met resistance near its 50-day moving average (DMA) line.
| Oil Services |
$OSX |
27.16 |
-1.34 |
-4.70% |
-65.31% |
| Integrated Oil |
$XOI |
742.82 |
-21.80 |
-2.85% |
-41.54% |
| Semiconductor |
$SOX |
1,707.75 |
+18.25 |
+1.08% |
-7.67% |
| Networking |
$NWX |
505.72 |
-8.80 |
-1.71% |
-13.32% |
| Broker/Dealer |
$XBD |
231.03 |
-4.65 |
-1.97% |
-20.44% |
| Retail |
$RLX |
2,601.50 |
+16.46 |
+0.64% |
+6.22% |
| Gold & Silver |
$XAU |
117.89 |
-3.48 |
-2.87% |
+10.26% |
| Bank |
$BKX |
67.77 |
-1.36 |
-1.97% |
-40.22% |
| Biotech |
$BTK |
5,290.50 |
+34.47 |
+0.66% |
+4.40% |
|
|
|
 |
Prior Highs Acted as Support Following Recent Breakout
Kenneth J. Gruneisen - Passed the CAN SLIM® Master's Exam
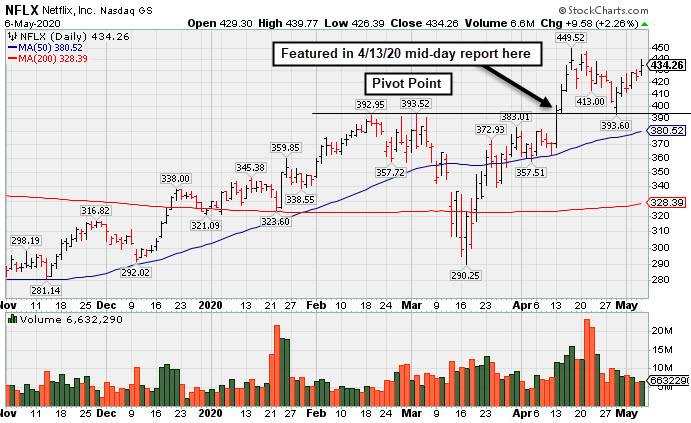
Netflix Inc (NFLX +$9.58 or +2.26% to $434.26) posted a gain with light volume today. It is trading above the "max buy" level with recent gains lacking great volume conviction. Prior highs in the $393 area acted as support during the consolidation following its recent breakout. Disciplined investors avoid chasing stocks more than +5% above the prior high or pivot point. Fundamentals remain strong after it reported earnings +107% on +28% sales revenues for the Mar '20 quarter versus the year ago period, its 3rd consecutive quarterly comparison well above the +25% minimum guideline (C criteria). NFLX finished strong after it was highlighted in yellow with pivot point cited based on its 3/03/20 high plus 10 cents in the 4/13/20 mid-day report (read here). The gain above the pivot point was backed by +55% above average volume and triggered a technical buy signal. NFLX was last shown in this FSU section on 4/21/20 with an annotated graph under the headline, "Netflix Reported Another Strong Quarter After Rally From Base". A previously noted downturn in FY '15 earnings (A criteria) has been followed by very strong growth. The number of top-rated funds owning its shares (I criteria) rose from 1,534 in Mar '17 to 2,373 in Mar '20, a reassuring sign concerning the I criteria. The company has 422.2 million shares in the public float (S criteria) which can make it a less likely sprinter. It has a Timeliness rating of A, a Sponsorship rating of B, and an Accumulation/Distribution Rating of B+. Charts courtesy of www.stockcharts.com
 |
|
|
Color Codes Explained :
Y - Better candidates highlighted by our
staff of experts.
G - Previously featured
in past reports as yellow but may no longer be buyable under the
guidelines.
***Last / Change / Volume data in this table is the closing quote data***
Symbol/Exchange
Company Name
Industry Group |
PRICE |
CHANGE
(%Change) |
Day High |
Volume
(% DAV)
(% 50 day avg vol) |
52 Wk Hi
% From Hi |
Featured
Date |
Price
Featured |
Pivot Featured |
|
Max Buy |
 EBS
-
NYSE
EBS
-
NYSE
Emergent Biosolutions
DRUGS - Biotechnology
|
$79.48
|
-0.03
-0.04% |
$81.57
|
374,951
64.42% of 50 DAV
50 DAV is 582,000
|
$83.01
-4.25%
|
4/24/2020
|
$72.10
|
PP = $73.99
|
|
MB = $77.69
|
Most Recent Note - 5/5/2020 5:17:10 PM
G - Perched near its all-time high today after its best ever close. Prior highs in the $71-73 area define initial support to watch on pullbacks.
>>> FEATURED STOCK ARTICLE : Volume-Driven Gain for Vaccine Maker With Great Earnings History - 4/24/2020 |
View all notes |
Set NEW NOTE alert |
Company Profile |
SEC
News |
Chart |
Request a new note
C
A
S
I |
TREX
-
NYSE
Trex Company Inc
MATERIALS and CONSTRUCTION - General Building Materials
|
$111.95
|
+2.74
2.51% |
$113.69
|
1,057,759
95.55% of 50 DAV
50 DAV is 1,107,000
|
$114.48
-2.21%
|
5/5/2020
|
$109.05
|
PP = $111.95
|
|
MB = $117.55
|
 Most Recent Note - 5/6/2020 7:24:56 PM
Y - Posted a gain today with average volume closing at its pivot point. Subsequent gains and strong close above the pivot point backed by at least +40% above average volume may clinch a convincing technical buy signal. See the latest FSU analysis for more details and an annotated graph.
>>> FEATURED STOCK ARTICLE : Gapped Up for Volume-Driven Gain and Hit a New All-Time High - 5/5/2020 |
View all notes |
Set NEW NOTE alert |
Company Profile |
SEC
News |
Chart |
Request a new note
C
A
S
I |
NFLX
-
NASDAQ
Netflix Inc
SPECIALTY RETAIL - Music and Video Stores
|
$434.26
|
+9.58
2.26% |
$439.77
|
6,644,036
68.21% of 50 DAV
50 DAV is 9,741,000
|
$449.52
-3.39%
|
4/13/2020
|
$393.60
|
PP = $393.62
|
|
MB = $413.30
|
Most Recent Note - 5/6/2020 7:16:52 PM
G - Posted another gain today with light volume. Prior highs in the $393 area acted as support following the recent breakout. Fundamentals remain strong after it reported earnings +107% on +28% sales revenues for the Mar '20 quarter versus the year ago period. See the latest FSU analysis for more details and a new annotated graph.
>>> FEATURED STOCK ARTICLE : Prior Highs Acted as Support Following Recent Breakout - 5/6/2020 |
View all notes |
Set NEW NOTE alert |
Company Profile |
SEC
News |
Chart |
Request a new note
C
A
S
I |
NOW
-
NYSE
Servicenow Inc
Computer Sftwr-Enterprse
|
$365.39
|
-5.25
-1.42% |
$379.80
|
2,375,997
84.86% of 50 DAV
50 DAV is 2,800,000
|
$376.18
-2.87%
|
4/30/2020
|
$343.05
|
PP = $363.05
|
|
MB = $381.20
|
Most Recent Note - 5/5/2020 5:12:30 PM
Y - Hit a new high with today's big gain backed by near average volume. Subsequent gains above the pivot point backed by at least +40% above average volume are needed to clinch a proper technical buy signal.
>>> FEATURED STOCK ARTICLE : Fundamental Strength Continues; Volume Heavy Behind Big Gain - 4/30/2020 |
View all notes |
Set NEW NOTE alert |
Company Profile |
SEC
News |
Chart |
Request a new note
C
A
S
I |
QLYS
-
NASDAQ
Qualys Inc
Computer Sftwr-Security
|
$105.41
|
+2.83
2.76% |
$107.24
|
489,107
89.58% of 50 DAV
50 DAV is 546,000
|
$110.89
-4.94%
|
4/9/2020
|
$100.44
|
PP = $97.22
|
|
MB = $102.08
|
Most Recent Note - 5/6/2020 7:19:53 PM
G - Color code is changed to green after rebounding above its "max buy" level with today's 3rd consecutive gain. During its consolidation it stayed above prior highs in the $97 area noted as support to watch on pullbacks. Due to report earnings news after the close on 5/07/20. Volume and volatility often increase near earnings news.
>>> FEATURED STOCK ARTICLE : Volume Totals Cooling While Stubbornly Holding Ground Near High - 4/27/2020 |
View all notes |
Set NEW NOTE alert |
Company Profile |
SEC
News |
Chart |
Request a new note
C
A
S
I |
Symbol/Exchange
Company Name
Industry Group |
PRICE |
CHANGE
(%Change) |
Day High |
Volume
(% DAV)
(% 50 day avg vol) |
52 Wk Hi
% From Hi |
Featured
Date |
Price
Featured |
Pivot Featured |
|
Max Buy |
TEAM
-
NASDAQ
Atlassian Corp Plc Cl A
Comp Sftwr-Spec Enterprs
|
$172.92
|
+3.34
1.97% |
$176.15
|
2,008,324
95.77% of 50 DAV
50 DAV is 2,097,000
|
$173.87
-0.55%
|
5/4/2020
|
$159.70
|
PP = $156.22
|
|
MB = $164.03
|
Most Recent Note - 5/6/2020 7:22:33 PM
G - Rallied further above its "max buy" level with today's 3rd consecutive gain, getting more extended from the previously noted base. Prior highs in the $156 area define initial support to watch on pullbacks. See the latest FSU analysis for more details and an annotated graph.
>>> FEATURED STOCK ARTICLE : Volume-Driven Gain For New All-Time High - 5/4/2020 |
View all notes |
Set NEW NOTE alert |
Company Profile |
SEC
News |
Chart |
Request a new note
C
A
S
I |
|
|
|
THESE ARE NOT BUY RECOMMENDATIONS!
Comments contained in the body of this report are technical
opinions only. The material herein has been obtained
from sources believed to be reliable and accurate, however,
its accuracy and completeness cannot be guaranteed.
This site is not an investment advisor, hence it does
not endorse or recommend any securities or other investments.
Any recommendation contained in this report may not
be suitable for all investors and it is not to be deemed
an offer or solicitation on our part with respect to
the purchase or sale of any securities. All trademarks,
service marks and trade names appearing in this report
are the property of their respective owners, and are
likewise used for identification purposes only.
This report is a service available
only to active Paid Premium Members.
You may opt-out of receiving report notifications
at any time. Questions or comments may be submitted
by writing to Premium Membership Services 665 S.E. 10 Street, Suite 201 Deerfield Beach, FL 33441-5634 or by calling 1-800-965-8307
or 954-785-1121.
|
|
|