***Last / Change / Volume data in this table is the closing quote data***
Symbol/Exchange
Company Name
Industry Group |
PRICE |
CHANGE
(%Change) |
Day High |
Volume
(% DAV)
(% 50 day avg vol) |
52 Wk Hi
% From Hi |
Featured
Date |
Price
Featured |
Pivot Featured |
|
Max Buy |
MLR
-
NYSE
Miller Industries Inc
AUTOMOTIVE - Auto Parts
|
$33.59
|
-0.15
-0.44% |
$34.21
|
38,251
91.07% of 50 DAV
50 DAV is 42,000
|
$35.26
-4.74%
|
11/30/2018
|
$28.35
|
PP = $29.50
|
|
MB = $30.98
|
Most Recent Note - 4/30/2019 6:09:53 PM
G - Retreated near its 50 DMA line ($32.88) with today's big volume-driven loss. Prior low ($30.38 on 3/27/19) defines the next near-term support to watch. Reported earnings +17% on +13% sales revenues for the Dec '18 quarter, below the +25% minimum guideline (C criteria), raising fundamental concerns.
>>> FEATURED STOCK ARTICLE : Below 50-Day Average After Damaging Losses - 4/8/2019 |
View all notes |
Set NEW NOTE alert |
Company Profile |
SEC
News |
Chart |
Request a new note
C
A
S
I |
NSP
-
NYSE
Insperity Inc
Comml Svcs-Outsourcing
|
$121.01
|
-0.22
-0.18% |
$121.59
|
224,934
65.20% of 50 DAV
50 DAV is 345,000
|
$132.50
-8.67%
|
4/16/2019
|
$129.59
|
PP = $132.60
|
|
MB = $139.23
|
Most Recent Note - 4/30/2019 10:16:05 AM
G - Gapped up today. Violated the prior low ($118) and tested its 200 DMA line ($111) with a damaging volume-driven loss on the prior session following earnings news. Reported earnings +40% on +14% sales revenues for the Mar '19 quarter. Volume and volatility often increase near earnings news. A rebound above the 50 DMA line ($125) is needed for its outlook to improve. Subsequent gains above the pivot point backed by at least +40% above average volume are needed to trigger a new (or add-on) technical buy signal.
>>> FEATURED STOCK ARTICLE : Rebound Above 50-Day Moving Average Line Needed - 4/23/2019 |
View all notes |
Set NEW NOTE alert |
Company Profile |
SEC
News |
Chart |
Request a new note
C
A
S
I |
ZBRA
-
NASDAQ
Zebra Tech Corp Cl A
COMPUTER HARDWARE - Computer Peripherals
|
$206.36
|
-0.10
-0.05% |
$206.50
|
769,665
169.90% of 50 DAV
50 DAV is 453,000
|
$237.15
-12.98%
|
2/14/2019
|
$198.10
|
PP = $184.85
|
|
MB = $194.09
|
Most Recent Note - 5/3/2019 8:02:43 PM
G - Violated its 50 DMA line ($214.71) with this week's damaging volume-driven losses after it reported earnings +14% on +9% sales revenues for the Mar '19 quarter, below the +25% minimum earnings guideline (C criteria). See the latest FSU analysis for more details and a new annotated graph.
>>> FEATURED STOCK ARTICLE : Violated 50-Day Moving Average Following Latest Earnings Report - 5/3/2019 |
View all notes |
Set NEW NOTE alert |
Company Profile |
SEC
News |
Chart |
Request a new note
C
A
S
I |
FTNT
-
NASDAQ
Fortinet Inc
Computer Sftwr-Security
|
$85.01
|
-0.95
-1.11% |
$85.20
|
2,344,502
135.99% of 50 DAV
50 DAV is 1,724,000
|
$96.96
-12.32%
|
4/10/2019
|
$89.76
|
PP = $88.70
|
|
MB = $93.14
|
Most Recent Note - 5/3/2019 12:40:02 PM
G - Reported earnings +39% on +18% sales revenues for the Mar '19 quarter versus the year ago period. Color code is changed to green after a gap down today violated prior highs in the $88 area and its 50 DMA line ($87.20) triggering a technical sell signal.
>>> FEATURED STOCK ARTICLE : Volume-Driven Gain Cleared Flat Base and Little Resistance Remains - 4/10/2019 |
View all notes |
Set NEW NOTE alert |
Company Profile |
SEC
News |
Chart |
Request a new note
C
A
S
I |
SPSC
-
NASDAQ
S P S Commerce Inc
COMPUTER SOFTWARE and SERVICES - Application Software
|
$107.01
|
+0.05
0.05% |
$107.91
|
148,279
102.26% of 50 DAV
50 DAV is 145,000
|
$115.00
-6.95%
|
3/26/2019
|
$107.12
|
PP = $113.41
|
|
MB = $119.08
|
Most Recent Note - 5/1/2019 7:01:31 PM
G - Posted a 3rd volume-driven gain in the span of 4 sessions but a rebound above its 50 DMA line ($105.75) is still needed for its outlook to improve. Reported earnings +54% on +13% sales revenues for the quarter ended March 31, 2019 versus the year ago period. Prior highs in the $98-100 area define important near-term support. See the latest FSU analysis for more details and a new annotated graph.
>>> FEATURED STOCK ARTICLE : Sputtering Near 50-Day Average Line Building Base-On-Base - 5/1/2019 |
View all notes |
Set NEW NOTE alert |
Company Profile |
SEC
News |
Chart |
Request a new note
C
A
S
I |
Symbol/Exchange
Company Name
Industry Group |
PRICE |
CHANGE
(%Change) |
Day High |
Volume
(% DAV)
(% 50 day avg vol) |
52 Wk Hi
% From Hi |
Featured
Date |
Price
Featured |
Pivot Featured |
|
Max Buy |
SSNC
-
NASDAQ
S S & C Technologies
COMPUTER SOFTWARE and SERVICES - Application Software
|
$60.50
|
+0.50
0.83% |
$60.59
|
1,050,169
64.15% of 50 DAV
50 DAV is 1,637,000
|
$67.73
-10.67%
|
2/15/2019
|
$59.73
|
PP = $61.07
|
|
MB = $64.12
|
Most Recent Note - 5/1/2019 1:44:01 PM
G - Reported earnings +72% on +170% sales revenues for the Mar '19 quarter and gapped down today violating its 50 DMA line, triggering a technical sell signal. Volume and volatility often increase near earnings news. A rebound above its 50 DMA line ($63.19) is needed for its outlook to improve.
>>> FEATURED STOCK ARTICLE : Hovering Near High With Volume Totals Cooling in Recent Weeks - 3/27/2019 |
View all notes |
Set NEW NOTE alert |
Company Profile |
SEC
News |
Chart |
Request a new note
C
A
S
I |
AUDC
-
NASDAQ
Audiocodes Ltd
ELECTRONICS - Scientific and Technical Instrum
|
$14.73
|
-0.04
-0.27% |
$15.10
|
278,482
126.58% of 50 DAV
50 DAV is 220,000
|
$17.44
-15.54%
|
3/20/2019
|
$13.66
|
PP = $15.06
|
|
MB = $15.81
|
Most Recent Note - 4/30/2019 10:12:38 AM
G - Abruptly retreated today undercutting the prior high ($14.96) and its 50 DMA line ($14.38). Reported earnings +38% on +10% sales revenues for the Mar '19 quarter. Volume and volatility often increase near earnings news. See the latest FSU analysis for more details and an annotated graph.
>>> FEATURED STOCK ARTICLE : Earnings News Due for Israel-Based VOIP Firm - 4/29/2019 |
View all notes |
Set NEW NOTE alert |
Company Profile |
SEC
News |
Chart |
Request a new note
C
A
S
I |
ENV
-
NYSE
Envestnet Inc
FINANCIAL SERVICES - Diversified Investments
|
$72.61
|
+0.16
0.22% |
$72.61
|
363,795
113.33% of 50 DAV
50 DAV is 321,000
|
$72.67
-0.08%
|
3/15/2019
|
$66.05
|
PP = $64.90
|
|
MB = $68.15
|
Most Recent Note - 5/1/2019 7:04:20 PM
G - Pulled back from its all-time high with today's 2nd consecutive loss with below average volume. The 50 DMA line ($65.39) and prior high ($64.80 on 9/14/18) define near-term support to watch on pullbacks.
>>> FEATURED STOCK ARTICLE : Negative Reversal After Another New High - 4/24/2019 |
View all notes |
Set NEW NOTE alert |
Company Profile |
SEC
News |
Chart |
Request a new note
C
A
S
I |
LHCG
-
NASDAQ
L H C Group Inc
HEALTH SERVICES - Home Health Care
|
$116.04
|
+1.22
1.06% |
$116.33
|
260,879
97.34% of 50 DAV
50 DAV is 268,000
|
$115.54
0.43%
|
4/29/2019
|
$110.94
|
PP = $115.64
|
|
MB = $121.42
|
Most Recent Note - 5/3/2019 8:09:39 PM
Y - Rose near the new pivot point cited based on its 3/22/19 high plus 10 cents. Subsequent gains above the pivot point backed by at least +40% above average volume may trigger a new (or add-on) technical buy signal. Found prompt support at its 200 DMA line.
>>> FEATURED STOCK ARTICLE : Sputtering Near 50-Day Moving Average Line - 4/1/2019 |
View all notes |
Set NEW NOTE alert |
Company Profile |
SEC
News |
Chart |
Request a new note
C
A
S
I |
ENSG
-
NASDAQ
Ensign Group Inc
HEALTH SERVICES - Long-Term Care Facilities
|
$52.03
|
+0.61
1.19% |
$52.42
|
273,137
98.61% of 50 DAV
50 DAV is 277,000
|
$54.56
-4.64%
|
4/30/2019
|
$51.46
|
PP = $53.30
|
|
MB = $55.97
|
Most Recent Note - 4/30/2019 10:22:15 AM
Y - Recently rebounded above its 50 DMA line ($50.51) helping its outlook improve. Color code is changed to yellow with new pivot point cited based on its 4/05/19 high while building on a double bottom base. Due to report earnings results after the close on Monday, May 6, 2019. Volume and volatility often increase near earnings news.
>>> FEATURED STOCK ARTICLE : Two Damaging Losses Hurt Outlook - 4/17/2019 |
View all notes |
Set NEW NOTE alert |
Company Profile |
SEC
News |
Chart |
Request a new note
C
A
S
I |
Symbol/Exchange
Company Name
Industry Group |
PRICE |
CHANGE
(%Change) |
Day High |
Volume
(% DAV)
(% 50 day avg vol) |
52 Wk Hi
% From Hi |
Featured
Date |
Price
Featured |
Pivot Featured |
|
Max Buy |
LULU
-
NASDAQ
Lululemon Athletica
MANUFACTURING - Textile Manufacturing
|
$177.69
|
-0.95
-0.53% |
$178.22
|
896,816
39.73% of 50 DAV
50 DAV is 2,257,000
|
$179.50
-1.01%
|
3/28/2019
|
$169.20
|
PP = $164.89
|
|
MB = $173.13
|
 Most Recent Note - 5/6/2019 6:27:50 PM
G - Still quietly hovering above the "max buy" level with volume totals cooling. Prior highs define initial support to watch above its 50 DMA line ($160.31).
>>> FEATURED STOCK ARTICLE : Breakway Gap Backed by More Than 6 Times Average Volume - 3/28/2019 |
View all notes |
Set NEW NOTE alert |
Company Profile |
SEC
News |
Chart |
Request a new note
C
A
S
I |
NXST
-
NASDAQ
Nexstar Media Group Cl A
MEDIA - Broadcasting - TV
|
$112.99
|
+1.89
1.70% |
$113.87
|
910,828
162.07% of 50 DAV
50 DAV is 562,000
|
$119.93
-5.79%
|
5/1/2019
|
$115.33
|
PP = $120.03
|
|
MB = $126.03
|
Most Recent Note - 5/6/2019 6:39:22 PM
Y - Posted a gain today with above average volume after slumping near its 50 DMA line ($109) which defines near-term support to watch. More damaging losses would raise greater concerns. Due to report earnings results before the market opens on Wednesday, May 8, 2019. Subsequent gains above the pivot point backed by at least +40% above average volume may trigger a new (or add-on) technical buy signal.
>>> FEATURED STOCK ARTICLE : Hitting New High and Very Extended From Prior Base - 4/4/2019 |
View all notes |
Set NEW NOTE alert |
Company Profile |
SEC
News |
Chart |
Request a new note
C
A
S
I |
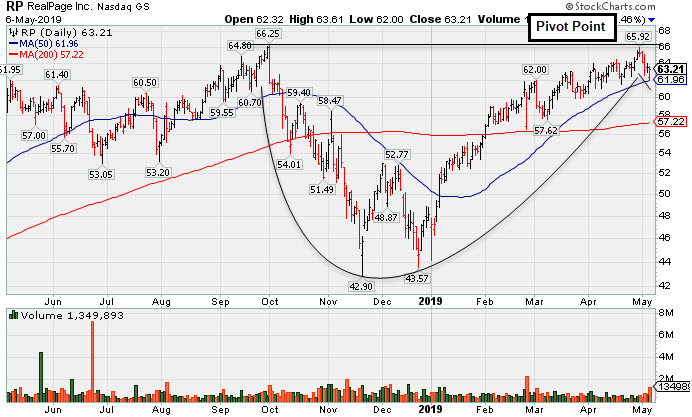
RP
-
NASDAQ
Realpage Inc
REAL ESTATE - REIT - Diversified/Industrial
|
$63.21
|
-0.29
-0.46% |
$63.61
|
1,349,719
214.24% of 50 DAV
50 DAV is 630,000
|
$66.25
-4.59%
|
5/6/2019
|
$62.97
|
PP = $65.92
|
|
MB = $69.22
|
Most Recent Note - 5/6/2019 6:32:04 PM
Y - After the close it reported earnings +8% on +16% sales revenues for the Mar '19 quarter, below the +25% minimum guideline (C criteria), raising fundamental concerns. Volume and volatility often increase near earnings news. It was highlighted in yellow with pivot point cited based on its 4/30/19 high in the earlier mid-day report perched near its 52-week high after a deep 7-month cup-with-handle shaped base. Dec '18 earnings +50% on +21% sales revenues versus the year ago period marked its 4th strong quarterly comparison above the +25% minimum guideline (C criteria). Annual earnings (A criteria) have improved since a downturn in FY '14. Completed a new Public Offering on 5/24/18. See the latest FSU analysis for more details and a new annotated graph.
>>> FEATURED STOCK ARTICLE : Latest Quarter Fell Short of Minimum Earnings Guideline - 5/6/2019 |
View all notes |
Set NEW NOTE alert |
Company Profile |
SEC
News |
Chart |
Request a new note
C
A
S
I |
ULTA
-
NASDAQ
Ulta Beauty Inc
SPECIALTY RETAIL - Specialty Retail, Other
|
$346.68
|
+4.72
1.38% |
$347.61
|
711,883
93.06% of 50 DAV
50 DAV is 765,000
|
$359.69
-3.62%
|
3/15/2019
|
$341.27
|
PP = $322.59
|
|
MB = $338.72
|
Most Recent Note - 5/2/2019 5:33:28 PM
G - Posted a gain today after testing its 50 DMA line ($335.25).which defines important near term support above prior highs.
>>> FEATURED STOCK ARTICLE : Volume Totals Cooling in Recent Weeks While Hovering Near High - 4/26/2019 |
View all notes |
Set NEW NOTE alert |
Company Profile |
SEC
News |
Chart |
Request a new note
C
A
S
I |
UBNT
-
NASDAQ
Ubiquiti Networks
TELECOMMUNICATIONS - Diversified Communication Serv
|
$170.52
|
-0.64
-0.37% |
$171.46
|
401,985
122.18% of 50 DAV
50 DAV is 329,000
|
$174.95
-2.53%
|
2/8/2019
|
$121.97
|
PP = $115.54
|
|
MB = $121.32
|
Most Recent Note - 5/6/2019 6:33:05 PM
G - Churned above average volume today yet remains perched near its all-time high, very extended from any sound base. Its 50 DMA line ($155) and prior high ($148.68 on 2/27/19) define near-term support to watch. Fundamentals remain strong.
>>> FEATURED STOCK ARTICLE : Extended From Any Sound Bass and Wedging to New Highs - 4/12/2019 |
View all notes |
Set NEW NOTE alert |
Company Profile |
SEC
News |
Chart |
Request a new note
C
A
S
I |
Symbol/Exchange
Company Name
Industry Group |
PRICE |
CHANGE
(%Change) |
Day High |
Volume
(% DAV)
(% 50 day avg vol) |
52 Wk Hi
% From Hi |
Featured
Date |
Price
Featured |
Pivot Featured |
|
Max Buy |
ESNT
-
NYSE
Essent Group Ltd
Finance-MrtgandRel Svc
|
$48.71
|
+0.81
1.69% |
$48.88
|
691,583
112.64% of 50 DAV
50 DAV is 614,000
|
$48.62
0.19%
|
3/18/2019
|
$45.84
|
PP = $45.06
|
|
MB = $47.31
|
Most Recent Note - 5/6/2019 6:37:57 PM
Y - Reported earnings +15% on +20% sales revenues for the Mar '19 quarter, below the +25% minimum earnings guideline (C criteria), raising fundamental concerns. Today it posted its 10th gain in the span of 11 sessions. Found support above its 50 DMA line ($45) reassuringly during the recent consolidation. Faces very little resistance due to overhead supply up to the $50 level.
>>> FEATURED STOCK ARTICLE : Perched Above Pivot Point With Earnings News Due May 3rd - 4/25/2019 |
View all notes |
Set NEW NOTE alert |
Company Profile |
SEC
News |
Chart |
Request a new note
C
A
S
I |
FIVE
-
NASDAQ
Five Below Inc
Retail-DiscountandVariety
|
$142.34
|
-3.74
-2.56% |
$142.87
|
1,131,521
100.05% of 50 DAV
50 DAV is 1,131,000
|
$148.22
-3.97%
|
4/11/2019
|
$132.05
|
PP = $133.75
|
|
MB = $140.44
|
Most Recent Note - 5/6/2019 6:34:25 PM
G - Pulled back today for a loss with near average volume. Recent gains lacked great volume conviction. Prior highs in the $133-136 area define initial support to watch.
>>> FEATURED STOCK ARTICLE : Finished Strong After Featured Again in Mid-Day Report - 4/11/2019 |
View all notes |
Set NEW NOTE alert |
Company Profile |
SEC
News |
Chart |
Request a new note
C
A
S
I |
NOW
-
NYSE
Servicenow Inc
Computer Sftwr-Enterprse
|
$269.75
|
+1.23
0.46% |
$270.97
|
1,231,240
66.27% of 50 DAV
50 DAV is 1,858,000
|
$273.82
-1.49%
|
4/22/2019
|
$242.64
|
PP = $251.75
|
|
MB = $264.34
|
Most Recent Note - 5/3/2019 8:11:16 PM
G - Color code is changed to green after rallying above its "max buy" level. Bullish action was noted last week after it reported earnings +20% on +34% sales revenues for the Mar '19 quarter, below the +25% minimum earnings guideline (C criteria), raising concerns, fundamentally. Prior high ($251.65 on 3/21/19) and its 50 DMA line ($244.54) define near-term support to watch.
>>> FEATURED STOCK ARTICLE : Found Recent Support at 50-Day Moving Average - 4/15/2019 |
View all notes |
Set NEW NOTE alert |
Company Profile |
SEC
News |
Chart |
Request a new note
C
A
S
I |
PANW
-
NYSE
Palo Alto Networks
Computer Sftwr-Security
|
$247.84
|
-2.93
-1.17% |
$249.00
|
704,236
53.68% of 50 DAV
50 DAV is 1,312,000
|
$260.63
-4.91%
|
2/25/2019
|
$233.54
|
PP = $239.60
|
|
MB = $251.58
|
Most Recent Note - 5/6/2019 6:26:44 PM
Y - Gapped down today but found support near its 50 DMA line ($242.31) and ended in the upper third of its intra-day range with a small loss on light volume. Below the 50 DMA line its prior low ($233.15 on 4/04/19) defines the next support to watch. Fundamentals remain strong.
>>> FEATURED STOCK ARTICLE : Consolidating Above Prior High and 50-Day Average - 4/3/2019 |
View all notes |
Set NEW NOTE alert |
Company Profile |
SEC
News |
Chart |
Request a new note
C
A
S
I |
QLYS
-
NASDAQ
Qualys Inc
Computer Sftwr-Security
|
$89.75
|
-1.95
-2.13% |
$91.23
|
395,071
122.31% of 50 DAV
50 DAV is 323,000
|
$98.30
-8.70%
|
5/2/2019
|
$91.25
|
PP = $98.40
|
|
MB = $103.32
|
Most Recent Note - 5/3/2019 1:25:51 PM
Y - On track today for a 4th consecutive volume-driven gain. Finished in the middle of a wider than usual intra-day trading range on the prior session after highlighted in yellow with pivot point cited still based on its 7/24/18 high plus 10 cents. Subsequent volume-driven gains above the pivot point may trigger a technical buy signal. Reported earnings +36% on +16% sales revenues for the Mar '19 quarter, continuing its strong earnings history. Perched near its 52-week and all-time high with today's 3rd consecutive volume-driven gain. Price action was choppy since dropped from the Featured Stocks list on 10/08/18 but fundamentals remain strong. See the latest FSU analysis for more details and an annotated graph.
>>> FEATURED STOCK ARTICLE : Rallying to Challenge Previously Stubborn Resistance - 5/2/2019 |
View all notes |
Set NEW NOTE alert |
Company Profile |
SEC
News |
Chart |
Request a new note
C
A
S
I |
Symbol/Exchange
Company Name
Industry Group |
PRICE |
CHANGE
(%Change) |
Day High |
Volume
(% DAV)
(% 50 day avg vol) |
52 Wk Hi
% From Hi |
Featured
Date |
Price
Featured |
Pivot Featured |
|
Max Buy |
ANET
-
NYSE
Arista Networks Inc
TELECOMMUNICATIONS - Communication Equipment
|
$273.31
|
-5.10
-1.83% |
$273.40
|
2,334,214
263.46% of 50 DAV
50 DAV is 886,000
|
$331.27
-17.50%
|
3/13/2019
|
$295.38
|
PP = $313.37
|
|
MB = $329.04
|
Most Recent Note - 5/6/2019 6:42:15 PM
Gapped down again today after violating its 50 DMA line ($304) on the prior session with a damaging volume-driven loss triggering a technical sell signal. A rebound above the 50 DMA line is needed for its outlook to improve. Weak action came after it report earnings +39% on +26% sales revenues for the Mar '19 quarter. It will be dropped from the Featured Stocks list tonight.
>>> FEATURED STOCK ARTICLE : Hovering Near High With Volume Totals Cooling - 4/22/2019 |
View all notes |
Set NEW NOTE alert |
Company Profile |
SEC
News |
Chart |
Request a new note
C
A
S
I |
PAYC
-
NYSE
Paycom Software Inc
COMPUTER SOFTWARE and SERVICES - Application Software
|
$207.46
|
+0.57
0.28% |
$208.21
|
884,056
148.83% of 50 DAV
50 DAV is 594,000
|
$207.15
0.15%
|
2/6/2019
|
$171.66
|
PP = $164.18
|
|
MB = $172.39
|
Most Recent Note - 5/3/2019 8:14:41 PM
G - Reported earnings +25% on +30% sales revenues for the Mar '19 quarter. Rallied to new highs with 3 gains in the past 4 session backed by above average volume. It is extended from any sound base. Held its ground at its 50 DMA line ($186.91) which defines important near-term support to watch above recent lows.
>>> FEATURED STOCK ARTICLE : Paycom Software Quietly Hovering Near All-Time High - 4/16/2019 |
View all notes |
Set NEW NOTE alert |
Company Profile |
SEC
News |
Chart |
Request a new note
C
A
S
I |
PYPL
-
NASDAQ
Paypal Holdings Inc
Finance-CrdtCard/PmtPr
|
$110.85
|
-1.11
-0.99% |
$111.12
|
4,719,495
72.46% of 50 DAV
50 DAV is 6,513,000
|
$113.69
-2.50%
|
1/24/2019
|
$92.56
|
PP = $93.80
|
|
MB = $98.49
|
Most Recent Note - 5/1/2019 7:13:53 PM
G - Pulled back today with light volume after hitting new all-time highs with a streak of 6 consecutive gains marked by higher volume. Very extended from any sound base and well above its 50 DMA line ($102.92) which defines support to watch. Recently reported earnings +37% on +12% sales revenues for the Mar '19 quarter, continuing its strong earnings track record.
>>> FEATURED STOCK ARTICLE : Extended From Base After Gains in Recent Weeks Lacking Volume - 4/2/2019 |
View all notes |
Set NEW NOTE alert |
Company Profile |
SEC
News |
Chart |
Request a new note
C
A
S
I |
ALRM
-
NASDAQ
Alarm.com Holdings Inc
Security/Sfty
|
$71.14
|
+0.14
0.20% |
$71.50
|
325,109
75.08% of 50 DAV
50 DAV is 433,000
|
$71.46
-0.45%
|
1/22/2019
|
$60.52
|
PP = $60.30
|
|
MB = $63.32
|
Most Recent Note - 5/6/2019 6:24:27 PM
G - Still holding its ground stubbornly after wedging to new highs with gains lacking great volume conviction. Due to report financial results after the market close on Thursday, May 9, 2019. Found prompt support near the 50 DMA line after it reported earnings +12% on +25% sales revenues for the Dec '18 quarter, below the +25% minimum earnings guideline (C criteria), raising fundamental concerns.
>>> FEATURED STOCK ARTICLE : Consolidating Near 50-Day Average Following Sub Par Report - 3/29/2019 |
View all notes |
Set NEW NOTE alert |
Company Profile |
SEC
News |
Chart |
Request a new note
C
A
S
I |
PLNT
-
NYSE
Planet Fitness Inc Cl A
Leisure-Services
|
$73.11
|
+0.44
0.61% |
$73.47
|
2,053,673
130.06% of 50 DAV
50 DAV is 1,579,000
|
$77.34
-5.47%
|
11/7/2018
|
$57.10
|
PP = $55.45
|
|
MB = $58.22
|
Most Recent Note - 5/3/2019 1:13:36 PM
G - Pulled back and tested support at its 50 DMA line ($68.55) today with a volume-driven loss after reporting earnings +30% on +23% sales revenues for its first quarter ended March 31, 2019. Volume and volatility often increase near earnings news. It remains very extended from any sound base.
>>> FEATURED STOCK ARTICLE : Perched Near High Very Extended From Prior Base - 4/5/2019 |
View all notes |
Set NEW NOTE alert |
Company Profile |
SEC
News |
Chart |
Request a new note
C
A
S
I |
Symbol/Exchange
Company Name
Industry Group |
PRICE |
CHANGE
(%Change) |
Day High |
Volume
(% DAV)
(% 50 day avg vol) |
52 Wk Hi
% From Hi |
Featured
Date |
Price
Featured |
Pivot Featured |
|
Max Buy |
TEAM
-
NASDAQ
Atlassian Corp Plc Cl A
Comp Sftwr-Spec Enterprs
|
$110.57
|
+0.16
0.14% |
$110.90
|
840,976
49.70% of 50 DAV
50 DAV is 1,692,000
|
$117.06
-5.54%
|
4/16/2019
|
$114.77
|
PP = $116.80
|
|
MB = $122.64
|
Most Recent Note - 5/1/2019 7:15:57 PM
G - Retreated quietly today to close just below the 50 DMA line ($109.19) after wedging higher. Recently reported earnings +133% on +38% sales revenues for the Mar '19 quarter, continuing its strong earnings track record.
>>> FEATURED STOCK ARTICLE : Perched Near High Enduring Distributional Pressure - 4/9/2019 |
View all notes |
Set NEW NOTE alert |
Company Profile |
SEC
News |
Chart |
Request a new note
C
A
S
I |
GLOB
-
NYSE
Globant SA
Computer-Tech Services
|
$82.79
|
-1.56
-1.85% |
$83.42
|
300,131
157.14% of 50 DAV
50 DAV is 191,000
|
$85.00
-2.60%
|
2/15/2019
|
$69.35
|
PP = $70.00
|
|
MB = $73.50
|
Most Recent Note - 4/30/2019 6:03:51 PM
G - Posted a big gain today with light volume for a best-ever close. Very extended from any sound base. Near-term support is at its prior high ($74) and its 50 DMA line ($73.92). Violations would raise concerns and trigger technical sell signals.
>>> FEATURED STOCK ARTICLE : Consolidating Near 50-Day Average Quietly Perched Near High - 3/26/2019 |
View all notes |
Set NEW NOTE alert |
Company Profile |
SEC
News |
Chart |
Request a new note
C
A
S
I |
TTD
-
NASDAQ
The Trade Desk Inc Cl A
Comml Svcs-Advertising
|
$225.59
|
-6.37
-2.75% |
$229.63
|
1,745,470
113.93% of 50 DAV
50 DAV is 1,532,000
|
$232.70
-3.06%
|
4/22/2019
|
$211.03
|
PP = $214.80
|
|
MB = $225.54
|
Most Recent Note - 5/3/2019 8:08:34 PM
G - Color code is changed to green after rallying above its "max buy" level. Disciplined investors will note that gains above the pivot point did not have the volume necessary to trigger a proper new (or add-on) technical buy signal. Its 50 DMA line ($202.76) defines initial support to watch above the prior low ($178.30 on 3/27/19). Due to report earnings news before the open on 5/09/19.
>>> FEATURED STOCK ARTICLE : Pulled Back Below "Max Buy" Level After Wedging Higher - 4/30/2019 |
View all notes |
Set NEW NOTE alert |
Company Profile |
SEC
News |
Chart |
Request a new note
C
A
S
I |