You are not logged in.
This means you
CAN ONLY VIEW reports that were published prior to Sunday, February 25, 2024.
You
MUST UPGRADE YOUR MEMBERSHIP if you want to see any current reports.
AFTER MARKET UPDATE - TUESDAY, MAY 5TH, 2020
Previous After Market Report Next After Market Report >>>
|
|
|
|
DOW |
+133.33 |
23,883.09 |
+0.56% |
|
Volume |
927,057,068 |
-4% |
|
Volume |
3,884,550,700 |
+15% |
|
NASDAQ |
+98.41 |
8,809.12 |
+1.13% |
|
Advancers |
1,613 |
56% |
|
Advancers |
1,734 |
54% |
|
S&P 500 |
+25.70 |
2,868.44 |
+0.90% |
|
Decliners |
1,285 |
44% |
|
Decliners |
1,471 |
46% |
|
Russell 2000 |
+9.54 |
1,273.51 |
+0.75% |
|
52 Wk Highs |
23 |
|
|
52 Wk Highs |
47 |
|
|
S&P 600 |
+2.69 |
738.71 |
+0.37% |
|
52 Wk Lows |
7 |
|
|
52 Wk Lows |
15 |
|
|
 |
Leadership Improves as Global Lockdown Measures Ease
Kenneth J. Gruneisen - Passed the CAN SLIM® Master's Exam
The S&P 500 rose 0.9%, halving an earlier advance of nearly 2%. The Dow added 133 points, while Nasdaq Composite was up 1.1%. Breadth was positive as advancers led decliners by an 8-7 margin on the NYSE and on the Nasdaq exchange. The reported volume totals were mixed, lighter than the prior session on the NYSE and higher on the Nasdaq exchange. There were 25 high-ranked companies from the Leaders List that hit new 52-week highs and were listed on the BreakOuts Page, versus 9 on the prior session. New 52-week highs outnumbered new lows on the NYSE and on the Nasdaq exchange. The major indices are in a confirmed uptrend (M criteria). Any sustainable rally requires a healthy crop of new leaders, so the latest improvement is a reassuring sign. Charts used courtesy of www.stockcharts.com
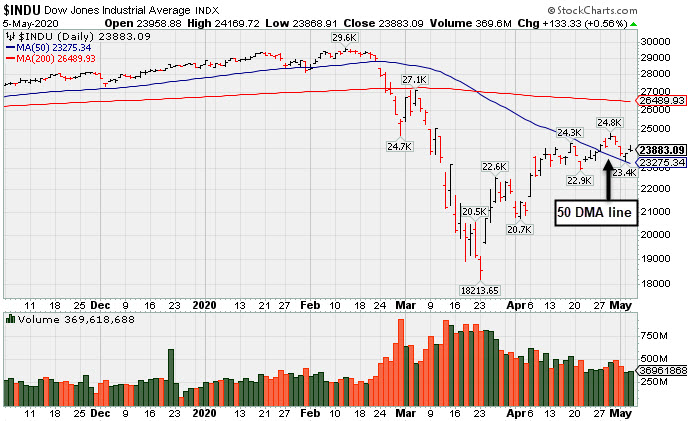
PICTURED: The Dow Jones Industrial Average has been consolidating above recently rebounding above its 50-day moving average (DMA) line.
Stocks finished higher on Tuesday as more U.S. states and global economies moved to ease coronavirus lockdown measures. Also bolstering sentiment was a rebound in oil prices. WTI crude rallied more than 20%, closing at $24.55/barrel, on its fifth-straight advance and longest stretch of gains in nine months. Tempering optimism, however, were comments from Fed Vice Chair Richard Clarida suggesting that more fiscal and monetary stimulus may be needed to support the U.S. economy.
Ten of 11 S&P 500 sectors closed in positive territory with Health Care shares leading the advance. Pfizer (PFE +2.37%) rose on news the drugmaker started conducting its first U.S. trial for its experimental coronavirus vaccine. In earnings, Regeneron Pharmaceuticals (REGN + 6.01%) rose after besting top and bottom line forecasts. Tech stocks also outperformed, while Financials edged lower. In other corporate news, Norwegian Cruise Line Holdings (NCLH -22.6%) sank after its management team shared doubts about the company’s ability to continue operations. Elsewhere, Starbucks (SBUX +1.40%) edged higher on plans to reopen 85% of U.S. stores by the end of this week.
On the data front, an update from the Institute for Supply Management showed that U.S. services sector activity contracted the most since 2009 in April, with the PMI reading falling to 41.8 from 52.5 the prior month. Treasuries declined with the yield on the 10-year note up two basis points to 0.65%. |
 Kenneth J. Gruneisen started out as a licensed stockbroker in August 1987, a couple of months prior to the historic stock market crash that took the Dow Jones Industrial Average down -22.6% in a single day. He has published daily fact-based fundamental and technical analysis on high-ranked stocks online for two decades. Through FACTBASEDINVESTING.COM, Kenneth provides educational articles, news, market commentary, and other information regarding proven investment systems that work in good times and bad.
Comments contained in the body of this report are technical opinions only and are not necessarily those of Gruneisen Growth Corp. The material herein has been obtained from sources believed to be reliable and accurate, however, its accuracy and completeness cannot be guaranteed. Our firm, employees, and customers may effect transactions, including transactions contrary to any recommendation herein, or have positions in the securities mentioned herein or options with respect thereto. Any recommendation contained in this report may not be suitable for all investors and it is not to be deemed an offer or solicitation on our part with respect to the purchase or sale of any securities. |
|
 |
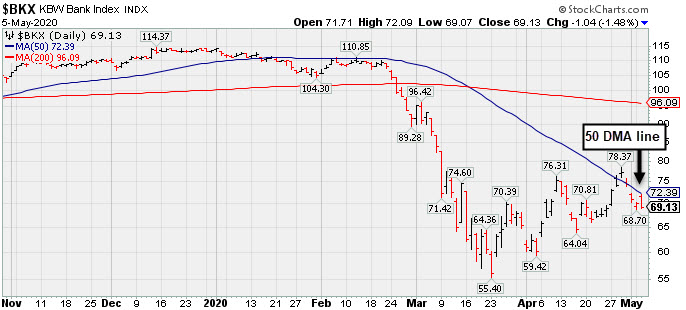
Tech, Retail, and Gold & Silver indexes Posted Gains
Kenneth J. Gruneisen - Passed the CAN SLIM® Master's Exam
The tech sector had a positive bias as the Semiconductor Index ($SOX +1.70%), Biotech Index ($BTK +1.36%), and the Networking Index ($NWX +1.76%) posted unanimous gains. The Retail Index ($RLX +0.43%) notched a modest gain. The Bank Index ($BKX -1.48%) fell and the Broker/Dealer Index ($XBD +0.01%) finished flat. Commodity-linked groups were mixed as the Oil Services Index ($OSX -1.66%) fell and the Integrated Oil Index ($XOI +0.37%) edged higher, and the Gold & Silver Index ($XAU +1.47%) also posted a modest gain. PICTURED: The Bank Index ($BKX -1.48%) recently met resistance near its 50-day moving average (DMA) line.
| Oil Services |
$OSX |
28.50 |
-0.48 |
-1.66% |
-63.60% |
| Integrated Oil |
$XOI |
764.62 |
+2.79 |
+0.37% |
-39.82% |
| Semiconductor |
$SOX |
1,689.50 |
+28.20 |
+1.70% |
-8.66% |
| Networking |
$NWX |
514.52 |
+8.90 |
+1.76% |
-11.81% |
| Broker/Dealer |
$XBD |
235.68 |
+0.03 |
+0.01% |
-18.84% |
| Retail |
$RLX |
2,585.04 |
+10.98 |
+0.43% |
+5.54% |
| Gold & Silver |
$XAU |
121.37 |
+1.75 |
+1.46% |
+13.51% |
| Bank |
$BKX |
69.13 |
-1.04 |
-1.48% |
-39.02% |
| Biotech |
$BTK |
5,256.03 |
+70.47 |
+1.36% |
+3.72% |
|
|
|
 |
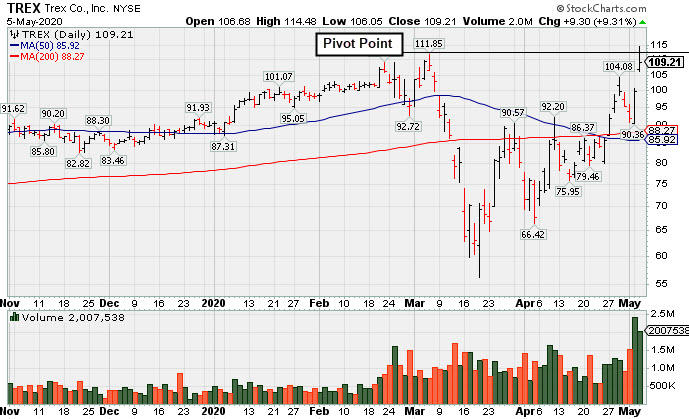
Gapped Up for Volume-Driven Gain and Hit a New All-Time High
Kenneth J. Gruneisen - Passed the CAN SLIM® Master's Exam
Trex Company Inc (TREX +$9.30 or +9.31% to $109.21) was highlighted in yellow with pivot point cited based on its 3/05/20 high plus 10 cents in the earlier mid-day report (read here). It touched a new all-time high with today's gap up and 2nd consecutive volume-driven gain. Subsequent gains and strong close above the pivot point backed by at least +40% above average volume may trigger a technical buy signal. It rebounded impressively after a deep slump below its 50-day and 200-day moving average (DMA) lines during the recent market correction.
It has earned the highest possible 99 Earnings Per Share Rating. TREX reported earnings +35% on +12% sales revenues for the Mar '20 quarter versus the year ago period, its 3rd consecutive quarterly comparison above the +25% minimum earnings guideline (C criteria). Annual earnings (A criteria) growth has been strong. However, the company hails from the General Building Materials industry group which currently has a Group Relative Strength Rating of C+.
It has a small supply (S criteria) of only 58.2 million shares outstanding. The number of top-rated funds owning its shares rose from 540 in Jun '19 to 622 in Mar '20, a reassuring sign concerning the I criteria. Its current Up/Down Volume Ratio of 1.1 is an unbiased indication its shares have been under slight accumulation over the past 50 days. It has a Timeliness rating of B and a Sponsorship Rating of C. |
|
|
Color Codes Explained :
Y - Better candidates highlighted by our
staff of experts.
G - Previously featured
in past reports as yellow but may no longer be buyable under the
guidelines.
***Last / Change / Volume data in this table is the closing quote data***
Symbol/Exchange
Company Name
Industry Group |
PRICE |
CHANGE
(%Change) |
Day High |
Volume
(% DAV)
(% 50 day avg vol) |
52 Wk Hi
% From Hi |
Featured
Date |
Price
Featured |
Pivot Featured |
|
Max Buy |
 EBS
-
NYSE
EBS
-
NYSE
Emergent Biosolutions
DRUGS - Biotechnology
|
$79.51
|
+0.01
0.01% |
$81.50
|
499,818
85.88% of 50 DAV
50 DAV is 582,000
|
$83.01
-4.22%
|
4/24/2020
|
$72.10
|
PP = $73.99
|
|
MB = $77.69
|
 Most Recent Note - 5/5/2020 5:17:10 PM
G - Perched near its all-time high today after its best ever close. Prior highs in the $71-73 area define initial support to watch on pullbacks.
>>> FEATURED STOCK ARTICLE : Volume-Driven Gain for Vaccine Maker With Great Earnings History - 4/24/2020 |
View all notes |
Set NEW NOTE alert |
Company Profile |
SEC
News |
Chart |
Request a new note
C
A
S
I |
TREX
-
NYSE
Trex Company Inc
MATERIALS and CONSTRUCTION - General Building Materials
|
$109.21
|
+9.30
9.31% |
$114.48
|
2,007,438
184.51% of 50 DAV
50 DAV is 1,088,000
|
$111.85
-2.36%
|
5/5/2020
|
$109.05
|
PP = $111.95
|
|
MB = $117.55
|
Most Recent Note - 5/5/2020 5:15:11 PM
Y - Finished in the middle of today's intra-day range after highlighted in yellow in the earlier mid-day report with pivot point cited based on its 3/05/20 high plus 10 cents. Hit a new all-time high as it gapped up for a 2nd consecutive volume-driven gain. Subsequent gains and strong close above the pivot point backed by at least +40% above average volume may trigger a technical buy signal. Rebounded impressively after a deep slump below its 50 and 200 DMA lines. Reported earnings +35% on +12% sales revenues for the Mar '20 quarter versus the year ago period, its 3rd consecutive quarterly comparison above the +25% minimum earnings guideline (C criteria). Annual earnings (A criteria) growth has been strong after a downturn in FY '14. See the latest FSU analysis for more details and a new annotated graph.
>>> FEATURED STOCK ARTICLE : Gapped Up for Volume-Driven Gain and Hit a New All-Time High - 5/5/2020 |
View all notes |
Set NEW NOTE alert |
Company Profile |
SEC
News |
Chart |
Request a new note
C
A
S
I |
NFLX
-
NASDAQ
Netflix Inc
SPECIALTY RETAIL - Music and Video Stores
|
$424.68
|
-3.47
-0.81% |
$431.00
|
6,252,550
64.10% of 50 DAV
50 DAV is 9,754,000
|
$449.52
-5.53%
|
4/13/2020
|
$393.60
|
PP = $393.62
|
|
MB = $413.30
|
Most Recent Note - 5/5/2020 1:37:06 PM
G - Color code is changed to green after rebounding above the "max buy" level with recent gains lacking great volume conviction. Prior highs in the $393 area acted as support. Fundamentals remain strong after it reported earnings +107% on +28% sales revenues for the Mar '20 quarter versus the year ago period.
>>> FEATURED STOCK ARTICLE : Netflix Reported Another Strong Quarter After Rally From Base - 4/21/2020 |
View all notes |
Set NEW NOTE alert |
Company Profile |
SEC
News |
Chart |
Request a new note
C
A
S
I |
NOW
-
NYSE
Servicenow Inc
Computer Sftwr-Enterprse
|
$370.64
|
+16.00
4.51% |
$376.18
|
2,946,595
105.95% of 50 DAV
50 DAV is 2,781,000
|
$362.95
2.12%
|
4/30/2020
|
$343.05
|
PP = $363.05
|
|
MB = $381.20
|
Most Recent Note - 5/5/2020 5:12:30 PM
Y - Hit a new high with today's big gain backed by near average volume. Subsequent gains above the pivot point backed by at least +40% above average volume are needed to clinch a proper technical buy signal.
>>> FEATURED STOCK ARTICLE : Fundamental Strength Continues; Volume Heavy Behind Big Gain - 4/30/2020 |
View all notes |
Set NEW NOTE alert |
Company Profile |
SEC
News |
Chart |
Request a new note
C
A
S
I |
QLYS
-
NASDAQ
Qualys Inc
Computer Sftwr-Security
|
$102.58
|
+1.34
1.32% |
$104.06
|
435,590
80.07% of 50 DAV
50 DAV is 544,000
|
$110.89
-7.49%
|
4/9/2020
|
$100.44
|
PP = $97.22
|
|
MB = $102.08
|
Most Recent Note - 5/5/2020 5:18:18 PM
Y - Perched near its "max buy" level. Prior highs in the $97 area define initial support to watch on pullbacks. Due to report earnings news after the close on 5/07/20. Volume and volatility often increase near earnings news.
>>> FEATURED STOCK ARTICLE : Volume Totals Cooling While Stubbornly Holding Ground Near High - 4/27/2020 |
View all notes |
Set NEW NOTE alert |
Company Profile |
SEC
News |
Chart |
Request a new note
C
A
S
I |
Symbol/Exchange
Company Name
Industry Group |
PRICE |
CHANGE
(%Change) |
Day High |
Volume
(% DAV)
(% 50 day avg vol) |
52 Wk Hi
% From Hi |
Featured
Date |
Price
Featured |
Pivot Featured |
|
Max Buy |
TEAM
-
NASDAQ
Atlassian Corp Plc Cl A
Comp Sftwr-Spec Enterprs
|
$169.58
|
+6.45
3.95% |
$173.87
|
3,357,459
161.96% of 50 DAV
50 DAV is 2,073,000
|
$163.69
3.60%
|
5/4/2020
|
$159.70
|
PP = $156.22
|
|
MB = $164.03
|
Most Recent Note - 5/5/2020 12:35:10 PM
G - Color code is changed to green after quickly rallying above its "max buy" level, getting extended from the previously noted base. Finished strong after highlighted in yellow with pivot point based on its 2/19/20 high plus 10 cents in the 5/04/20 mid-day report. Hit a new all-time high with a big gain and strong close above the pivot point backed by +61% above average volume clinching a convincing technical buy signal. It has a 98 Earnings Per Share rating, but last week it reported earnings +19% on +33% sales revenues for the Mar '20 quarter, breaking a strong track record of +25% earnings increases (C criteria). Rebounded from below its 200 DMA line in recent weeks and showed resilience since dropped from the Featured Stocks list on 3/11/20. See the latest FSU analysis for more details and an annotated graph.
>>> FEATURED STOCK ARTICLE : Volume-Driven Gain For New All-Time High - 5/4/2020 |
View all notes |
Set NEW NOTE alert |
Company Profile |
SEC
News |
Chart |
Request a new note
C
A
S
I |
|
|
|
THESE ARE NOT BUY RECOMMENDATIONS!
Comments contained in the body of this report are technical
opinions only. The material herein has been obtained
from sources believed to be reliable and accurate, however,
its accuracy and completeness cannot be guaranteed.
This site is not an investment advisor, hence it does
not endorse or recommend any securities or other investments.
Any recommendation contained in this report may not
be suitable for all investors and it is not to be deemed
an offer or solicitation on our part with respect to
the purchase or sale of any securities. All trademarks,
service marks and trade names appearing in this report
are the property of their respective owners, and are
likewise used for identification purposes only.
This report is a service available
only to active Paid Premium Members.
You may opt-out of receiving report notifications
at any time. Questions or comments may be submitted
by writing to Premium Membership Services 665 S.E. 10 Street, Suite 201 Deerfield Beach, FL 33441-5634 or by calling 1-800-965-8307
or 954-785-1121.
|
|
|