You are not logged in.
This means you
CAN ONLY VIEW reports that were published prior to Tuesday, February 20, 2024.
You
MUST UPGRADE YOUR MEMBERSHIP if you want to see any current reports.
AFTER MARKET UPDATE - TUESDAY, MAY 3RD, 2022
Previous After Market Report Next After Market Report >>>
|
|
|
|
DOW |
+67.29 |
33,128.79 |
+0.20% |
|
Volume |
975,752,966 |
-12% |
|
Volume |
4,475,451,600 |
-7% |
|
NASDAQ |
+27.74 |
12,563.76 |
+0.22% |
|
Advancers |
1,921 |
61% |
|
Advancers |
2,404 |
55% |
|
S&P 500 |
+20.10 |
4,175.48 |
+0.48% |
|
Decliners |
1,207 |
39% |
|
Decliners |
1,989 |
45% |
|
Russell 2000 |
+15.94 |
1,898.86 |
+0.85% |
|
52 Wk Highs |
27 |
|
|
52 Wk Highs |
37 |
|
|
S&P 600 |
+10.97 |
1,234.43 |
+0.90% |
|
52 Wk Lows |
279 |
|
|
52 Wk Lows |
287 |
|
|
Damage grew greater last week as the market correction (M criteria) saw more widespread losses. Reducing market exposure and raising cash is prudent until a new confirmed rally is noted.
|
 |
Major Averages Inched Higher With Lighter Volume Totals
Kenneth J. Gruneisen - Passed the CAN SLIM® Master's Exam
The Dow added 67 points, while the S&P 500 gained 0.5%. The Nasdaq Composite ticked up 0.2%. Volume totals reported were lighter than the prior session on the NYSE and on the Nasdaq exchange. Advancers led decliners by a 3-2 margin on the NYSE and by a 6-5 margin on the Nasdaq exchange. There were 5 high-ranked companies from the Leaders List that hit new 52-week highs and were listed on the BreakOuts Page, versus 1 on the prior session. New 52-week lows totals contracted yet still solidly outnumbered new 52-week highs on both the NYSE and the Nasdaq exchange. The major indices are in a noted market correction (M criteria). Strict followers of the fact-based investment system know to use great caution and always be prepared to reduce exposure by selling any weakening stocks on a case-by-case basis.
Chart courtesy of www.stockcharts.com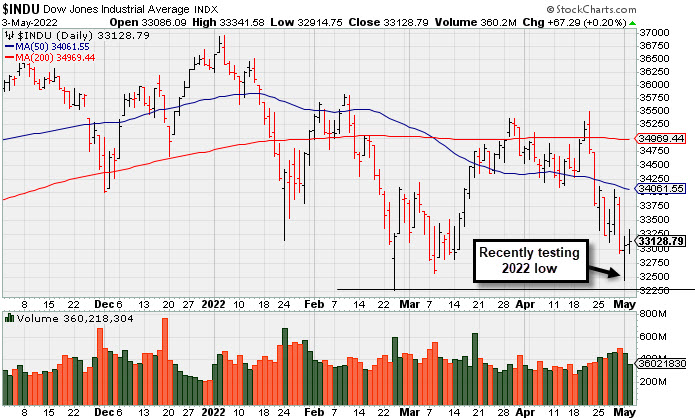 PICTURED: The Dow Jones Industrial Average has recently been testing near the 2022 low.
Stocks pushed higher during another volatile session on Tuesday with Wall Street awaiting tomorrow’s Federal Reserve policy decision. The first 50-basis point (0.50%) rate increase since 2000 is widely expected to be announced Wednesday afternoon as the U.S. central bank aims to calm the highest inflation in more than four decades. Treasuries stabilized, with the yield on the 10-year note down two basis points (0.02%) to 2.97% after yesterday breaching 3.00% for the first time since December 2018.
Nine of 11 S&P 500 sectors closed in positive territory, with Energy and Financials pacing gains. The Consumer Discretionary group lagged following disappointing earnings from travel-related companies. Hilton Worldwide Holdings Inc. (HLT -4.15%) fell on weak forward guidance, while Expedia Group Inc. (EXPE -14.02%) fell after its mixed results spurred a flurry of analyst price target reductions. Elsewhere, Clorox Co. (CLX +2.99%) following a top and bottom line beat. In other corporate news, Western Digital Corp. (WDC +14.47%) rose following reports activist investor Elliot Investment Management urged the company to evaluate the value of spinning off one of its two key businesses.
On the data front, factory orders climbed a larger-than-forecasted 2.2% in March, while final readings on both durable and capital goods orders for the period were upwardly revised. Separately, the Jobs Opening and Labor Turnover Survey (JOLTS) further underscored a tight labor market, with available positions surging to a record 11.5 million in March. In commodities, West Texas Intermediate crude lost 2.2% to $102.88/barrel.
|
 Kenneth J. Gruneisen started out as a licensed stockbroker in August 1987, a couple of months prior to the historic stock market crash that took the Dow Jones Industrial Average down -22.6% in a single day. He has published daily fact-based fundamental and technical analysis on high-ranked stocks online for two decades. Through FACTBASEDINVESTING.COM, Kenneth provides educational articles, news, market commentary, and other information regarding proven investment systems that work in good times and bad.
Comments contained in the body of this report are technical opinions only and are not necessarily those of Gruneisen Growth Corp. The material herein has been obtained from sources believed to be reliable and accurate, however, its accuracy and completeness cannot be guaranteed. Our firm, employees, and customers may effect transactions, including transactions contrary to any recommendation herein, or have positions in the securities mentioned herein or options with respect thereto. Any recommendation contained in this report may not be suitable for all investors and it is not to be deemed an offer or solicitation on our part with respect to the purchase or sale of any securities. |
|
 |
Commodity-Linked Groups Outpaced Tech and Financial Indexes
Kenneth J. Gruneisen - Passed the CAN SLIM® Master's Exam
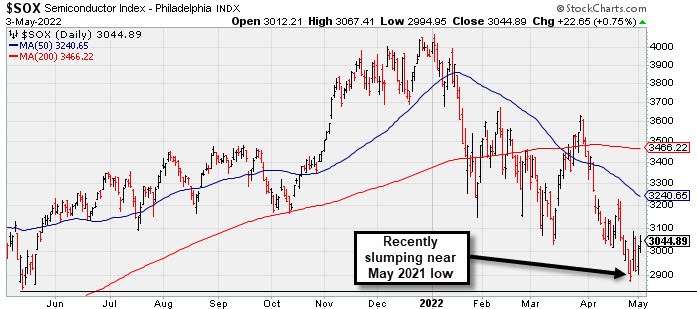
The Bank Index ($BKX +1.65%) posted an influential gain while the Broker/Dealer Index ($XBD +0.26%) edged higher and the Retail Index ($RLX -0.20%) edged lower. Commodity-linked groups had a positive bias as the Oil Services Index ($OSX +2.89%), Integrated Oil Index ($XOI +3.51%), and Gold & Silver Index ($XAU +1.83%) posted unanimous gains. The tech sector had a slight positive bias as the Semiconductor Index ($SOX +0.75%), Biotech Index ($BTK +0.58%), and Networking Index ($NWX +0.15%) each posted a small gain.
PICTURED: The Semiconductor Index ($SOX +0.75%) recently slumped to new 2022 lows, nearly testing its May 2021 low.
| Oil Services |
$OSX |
76.24 |
+2.14 |
+2.89% |
+44.61% |
| Integrated Oil |
$XOI |
1,621.73 |
+54.99 |
+3.51% |
+37.64% |
| Semiconductor |
$SOX |
3,044.89 |
+22.65 |
+0.75% |
-22.84% |
| Networking |
$NWX |
791.40 |
+1.20 |
+0.15% |
-18.50% |
| Broker/Dealer |
$XBD |
414.33 |
+1.06 |
+0.26% |
-14.90% |
| Retail |
$RLX |
3,298.57 |
-6.57 |
-0.20% |
-21.95% |
| Gold & Silver |
$XAU |
143.08 |
+2.57 |
+1.83% |
+8.03% |
| Bank |
$BKX |
113.12 |
+1.84 |
+1.65% |
-14.45% |
| Biotech |
$BTK |
4,749.79 |
+27.21 |
+0.58% |
-13.93% |
|
|
|
 |
Featured Stocks
Kenneth J. Gruneisen - Passed the CAN SLIM® Master's Exam
|
|
|
Color Codes Explained :
Y - Better candidates highlighted by our
staff of experts.
G - Previously featured
in past reports as yellow but may no longer be buyable under the
guidelines.
***Last / Change / Volume data in this table is the closing quote data***
Symbol/Exchange
Company Name
Industry Group |
PRICE |
CHANGE
(%Change) |
Day High |
Volume
(% DAV)
(% 50 day avg vol) |
52 Wk Hi
% From Hi |
Featured
Date |
Price
Featured |
Pivot Featured |
|
Max Buy |
 REGN
-
NASDAQ
REGN
-
NASDAQ
Regeneron Pharmaceutical
DRUGS - Biotechnology
|
$660.49
|
+8.47
1.30% |
$665.30
|
538,195
83.83% of 50 DAV
50 DAV is 642,000
|
$747.42
-11.63%
|
3/14/2022
|
$647.95
|
PP = $673.96
|
|
MB = $707.66
|
 Most Recent Note - 5/3/2022 2:05:44 PM
G - Due to report Mar '22 quarterly results on Wednesday, May 4th. Volume and volatility often increase near earnings news. Rebounding today with light volume after noted losses this week triggering a technical sell signal. Only a prompt rebound above the 50 DMA line ($672) would help its outlook improve.
>>> FEATURED STOCK ARTICLE : Testing Support at 50-Day Moving Average Line - 4/28/2022 |
View all notes |
Set NEW NOTE alert |
Company Profile |
SEC
News |
Chart |
Request a new note
C
A
S
I |
IMKTA
-
NASDAQ
Ingles Markets Inc Cl A
RETAIL - Grocery Stores
|
$95.12
|
+0.46
0.49% |
$96.90
|
113,604
97.93% of 50 DAV
50 DAV is 116,000
|
$101.98
-6.73%
|
4/11/2022
|
$96.25
|
PP = $95.75
|
|
MB = $100.54
|
Most Recent Note - 5/3/2022 2:01:24 PM
Y - Perched near its all-time high, sputtering in recent weeks after no gain backed by at least +40% above average volume to clinch a proper technical buy signal. Due to report Mar '22 quarterly results on 5/06/22. Volume and volatility often increase near earnings news.
>>> FEATURED STOCK ARTICLE : Closed Near Session Low and Below Pivot Point Cited - 4/11/2022 |
View all notes |
Set NEW NOTE alert |
Company Profile |
SEC
News |
Chart |
Request a new note
C
A
S
I |
WCC
-
NYSE
Wesco International Inc
WHOLESALE - Electronics Wholesale
|
$126.83
|
+4.21
3.43% |
$127.15
|
403,718
91.75% of 50 DAV
50 DAV is 440,000
|
$140.92
-10.00%
|
4/21/2022
|
$135.54
|
PP = $139.10
|
|
MB = $146.06
|
Most Recent Note - 5/3/2022 1:55:53 PM
Y - Color code is changed to yellow while inching above its 50 DMA line ($124.34) again, posting a gain today on lighter (below average) volume after recently testing its 200 DMA line ($122.67).
>>> FEATURED STOCK ARTICLE : Approaching Prior Highs Where it Met Resistance - 4/21/2022 |
View all notes |
Set NEW NOTE alert |
Company Profile |
SEC
News |
Chart |
Request a new note
C
A
S
I |
SMPL
-
NASDAQ
Simply Good Foods Co
Food-Confectionery
|
$40.05
|
-0.25
-0.62% |
$40.77
|
674,442
101.27% of 50 DAV
50 DAV is 666,000
|
$45.77
-12.50%
|
4/13/2022
|
$41.79
|
PP = $43.27
|
|
MB = $45.43
|
Most Recent Note - 5/3/2022 2:08:08 PM
Y - Today's 3rd consecutive loss is nearly testing its 50 DMA line ($39.37) which defines important near-term support. Any violation would raise greater concerns and trigger a technical sell signal. Reported Feb '22 quarterly earnings +44% on +29% sales revenues versus the year ago period, its 4th strong quarterly comparison.
>>> FEATURED STOCK ARTICLE : Simply Good Foods Had a Great Breakout - 4/14/2022 |
View all notes |
Set NEW NOTE alert |
Company Profile |
SEC
News |
Chart |
Request a new note
C
A
S
I |
IMXI
-
NASDAQ
International Money Exp
Financial Svcs-Specialty
|
$19.87
|
+0.41
2.11% |
$19.90
|
554,732
142.24% of 50 DAV
50 DAV is 390,000
|
$21.98
-9.60%
|
3/8/2022
|
$18.64
|
PP = $19.06
|
|
MB = $20.01
|
Most Recent Note - 5/3/2022 2:03:15 PM
Y - Due to report Mar '22 quarterly results on 5/04/22. Volume and volatility often increase near earnings news. Recently consolidating near its 50 DMA line ($19.39) which defines important near term support to watch. More damaging losses would raise concerns and trigger a technical sell signal.
>>> FEATURED STOCK ARTICLE : Consolidating After Rally From Previously Noted Base - 4/18/2022 |
View all notes |
Set NEW NOTE alert |
Company Profile |
SEC
News |
Chart |
Request a new note
C
A
S
I |
Symbol/Exchange
Company Name
Industry Group |
PRICE |
CHANGE
(%Change) |
Day High |
Volume
(% DAV)
(% 50 day avg vol) |
52 Wk Hi
% From Hi |
Featured
Date |
Price
Featured |
Pivot Featured |
|
Max Buy |
|
|
|
THESE ARE NOT BUY RECOMMENDATIONS!
Comments contained in the body of this report are technical
opinions only. The material herein has been obtained
from sources believed to be reliable and accurate, however,
its accuracy and completeness cannot be guaranteed.
This site is not an investment advisor, hence it does
not endorse or recommend any securities or other investments.
Any recommendation contained in this report may not
be suitable for all investors and it is not to be deemed
an offer or solicitation on our part with respect to
the purchase or sale of any securities. All trademarks,
service marks and trade names appearing in this report
are the property of their respective owners, and are
likewise used for identification purposes only.
This report is a service available
only to active Paid Premium Members.
You may opt-out of receiving report notifications
at any time. Questions or comments may be submitted
by writing to Premium Membership Services 665 S.E. 10 Street, Suite 201 Deerfield Beach, FL 33441-5634 or by calling 1-800-965-8307
or 954-785-1121.
|
|
|