***Last / Change / Volume data in this table is the closing quote data***
Symbol/Exchange
Company Name
Industry Group |
PRICE |
CHANGE
(%Change) |
Day High |
Volume
(% DAV)
(% 50 day avg vol) |
52 Wk Hi
% From Hi |
Featured
Date |
Price
Featured |
Pivot Featured |
|
Max Buy |
MLR
-
NYSE
Miller Industries Inc
AUTOMOTIVE - Auto Parts
|
$33.58
|
+0.50
1.51% |
$34.00
|
69,130
164.60% of 50 DAV
50 DAV is 42,000
|
$35.26
-4.76%
|
11/30/2018
|
$28.35
|
PP = $29.50
|
|
MB = $30.98
|
Most Recent Note - 4/30/2019 6:09:53 PM
G - Retreated near its 50 DMA line ($32.88) with today's big volume-driven loss. Prior low ($30.38 on 3/27/19) defines the next near-term support to watch. Reported earnings +17% on +13% sales revenues for the Dec '18 quarter, below the +25% minimum guideline (C criteria), raising fundamental concerns.
>>> FEATURED STOCK ARTICLE : Below 50-Day Average After Damaging Losses - 4/8/2019 |
View all notes |
Set NEW NOTE alert |
Company Profile |
SEC
News |
Chart |
Request a new note
C
A
S
I |
NSP
-
NYSE
Insperity Inc
Comml Svcs-Outsourcing
|
$118.52
|
-1.04
-0.87% |
$121.55
|
545,831
155.95% of 50 DAV
50 DAV is 350,000
|
$132.50
-10.55%
|
4/16/2019
|
$129.59
|
PP = $132.60
|
|
MB = $139.23
|
Most Recent Note - 4/30/2019 10:16:05 AM
G - Gapped up today. Violated the prior low ($118) and tested its 200 DMA line ($111) with a damaging volume-driven loss on the prior session following earnings news. Reported earnings +40% on +14% sales revenues for the Mar '19 quarter. Volume and volatility often increase near earnings news. A rebound above the 50 DMA line ($125) is needed for its outlook to improve. Subsequent gains above the pivot point backed by at least +40% above average volume are needed to trigger a new (or add-on) technical buy signal.
>>> FEATURED STOCK ARTICLE : Rebound Above 50-Day Moving Average Line Needed - 4/23/2019 |
View all notes |
Set NEW NOTE alert |
Company Profile |
SEC
News |
Chart |
Request a new note
C
A
S
I |
ZBRA
-
NASDAQ
Zebra Tech Corp Cl A
COMPUTER HARDWARE - Computer Peripherals
|
$205.12
|
-6.02
-2.85% |
$214.40
|
1,096,947
251.59% of 50 DAV
50 DAV is 436,000
|
$237.15
-13.51%
|
2/14/2019
|
$198.10
|
PP = $184.85
|
|
MB = $194.09
|
Most Recent Note - 4/30/2019 1:15:07 PM
G - Undercutting its 50 DMA line ($214.35) with today's 4th consecutive loss on ever-increasing volume. Reported earnings +14% on +9% sales revenues for the Mar '19 quarter. Volume and volatility often increase near earnings news.
>>> FEATURED STOCK ARTICLE : Zebra Extended From Prior Base - 3/25/2019 |
View all notes |
Set NEW NOTE alert |
Company Profile |
SEC
News |
Chart |
Request a new note
C
A
S
I |
FTNT
-
NASDAQ
Fortinet Inc
Computer Sftwr-Security
|
$91.89
|
-1.53
-1.64% |
$93.64
|
1,517,599
92.20% of 50 DAV
50 DAV is 1,646,000
|
$96.96
-5.23%
|
4/10/2019
|
$89.76
|
PP = $88.70
|
|
MB = $93.14
|
 Most Recent Note - 5/1/2019 7:17:27 PM
Y - Pulled back today with higher (near average) volume, still consolidating above its pivot point and below its "max buy" level. Tested prior highs in the $88 area defining near-term support above its 50 DMA line ($87.03).
>>> FEATURED STOCK ARTICLE : Volume-Driven Gain Cleared Flat Base and Little Resistance Remains - 4/10/2019 |
View all notes |
Set NEW NOTE alert |
Company Profile |
SEC
News |
Chart |
Request a new note
C
A
S
I |
SPSC
-
NASDAQ
S P S Commerce Inc
COMPUTER SOFTWARE and SERVICES - Application Software
|
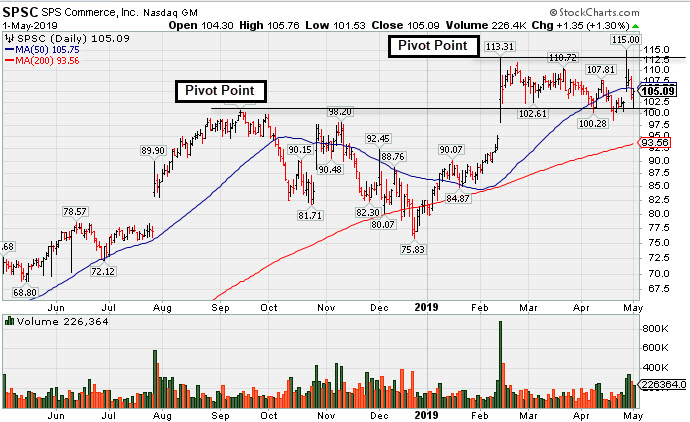
$105.09
|
+1.35
1.30% |
$105.76
|
232,764
159.43% of 50 DAV
50 DAV is 146,000
|
$115.00
-8.62%
|
3/26/2019
|
$107.12
|
PP = $113.41
|
|
MB = $119.08
|
Most Recent Note - 5/1/2019 7:01:31 PM
G - Posted a 3rd volume-driven gain in the span of 4 sessions but a rebound above its 50 DMA line ($105.75) is still needed for its outlook to improve. Reported earnings +54% on +13% sales revenues for the quarter ended March 31, 2019 versus the year ago period. Prior highs in the $98-100 area define important near-term support. See the latest FSU analysis for more details and a new annotated graph.
>>> FEATURED STOCK ARTICLE : Sputtering Near 50-Day Average Line Building Base-On-Base - 5/1/2019 |
View all notes |
Set NEW NOTE alert |
Company Profile |
SEC
News |
Chart |
Request a new note
C
A
S
I |
Symbol/Exchange
Company Name
Industry Group |
PRICE |
CHANGE
(%Change) |
Day High |
Volume
(% DAV)
(% 50 day avg vol) |
52 Wk Hi
% From Hi |
Featured
Date |
Price
Featured |
Pivot Featured |
|
Max Buy |
SSNC
-
NASDAQ
S S & C Technologies
COMPUTER SOFTWARE and SERVICES - Application Software
|
$59.84
|
-7.82
-11.56% |
$61.77
|
9,377,912
620.64% of 50 DAV
50 DAV is 1,511,000
|
$67.73
-11.65%
|
2/15/2019
|
$59.73
|
PP = $61.07
|
|
MB = $64.12
|
Most Recent Note - 5/1/2019 1:44:01 PM
G - Reported earnings +72% on +170% sales revenues for the Mar '19 quarter and gapped down today violating its 50 DMA line, triggering a technical sell signal. Volume and volatility often increase near earnings news. A rebound above its 50 DMA line ($63.19) is needed for its outlook to improve.
>>> FEATURED STOCK ARTICLE : Hovering Near High With Volume Totals Cooling in Recent Weeks - 3/27/2019 |
View all notes |
Set NEW NOTE alert |
Company Profile |
SEC
News |
Chart |
Request a new note
C
A
S
I |
AUDC
-
NASDAQ
Audiocodes Ltd
ELECTRONICS - Scientific and Technical Instrum
|
$14.55
|
+0.46
3.26% |
$14.78
|
522,450
244.14% of 50 DAV
50 DAV is 214,000
|
$17.44
-16.57%
|
3/20/2019
|
$13.66
|
PP = $15.06
|
|
MB = $15.81
|
Most Recent Note - 4/30/2019 10:12:38 AM
G - Abruptly retreated today undercutting the prior high ($14.96) and its 50 DMA line ($14.38). Reported earnings +38% on +10% sales revenues for the Mar '19 quarter. Volume and volatility often increase near earnings news. See the latest FSU analysis for more details and an annotated graph.
>>> FEATURED STOCK ARTICLE : Earnings News Due for Israel-Based VOIP Firm - 4/29/2019 |
View all notes |
Set NEW NOTE alert |
Company Profile |
SEC
News |
Chart |
Request a new note
C
A
S
I |
ENV
-
NYSE
Envestnet Inc
FINANCIAL SERVICES - Diversified Investments
|
$69.86
|
-1.13
-1.59% |
$71.46
|
247,324
77.53% of 50 DAV
50 DAV is 319,000
|
$72.39
-3.49%
|
3/15/2019
|
$66.05
|
PP = $64.90
|
|
MB = $68.15
|
Most Recent Note - 5/1/2019 7:04:20 PM
G - Pulled back from its all-time high with today's 2nd consecutive loss with below average volume. The 50 DMA line ($65.39) and prior high ($64.80 on 9/14/18) define near-term support to watch on pullbacks.
>>> FEATURED STOCK ARTICLE : Negative Reversal After Another New High - 4/24/2019 |
View all notes |
Set NEW NOTE alert |
Company Profile |
SEC
News |
Chart |
Request a new note
C
A
S
I |
LHCG
-
NASDAQ
L H C Group Inc
HEALTH SERVICES - Home Health Care
|
$110.77
|
-0.34
-0.31% |
$112.07
|
513,244
195.89% of 50 DAV
50 DAV is 262,000
|
$115.54
-4.13%
|
4/29/2019
|
$110.94
|
PP = $115.64
|
|
MB = $121.42
|
Most Recent Note - 4/29/2019 5:44:20 PM
Y - Rebound above the 50 DMA line ($108.70) helped its outlook improve and its color code is changed to yellow with new pivot point cited based on its 3/22/19 high plus 10 cents. Subsequent gains above the pivot point backed by at least +40% above average volume may trigger a new (or add-on) technical buy signal. Found prompt support at its 200 DMA line.
>>> FEATURED STOCK ARTICLE : Sputtering Near 50-Day Moving Average Line - 4/1/2019 |
View all notes |
Set NEW NOTE alert |
Company Profile |
SEC
News |
Chart |
Request a new note
C
A
S
I |
ENSG
-
NASDAQ
Ensign Group Inc
HEALTH SERVICES - Long-Term Care Facilities
|
$50.88
|
-0.64
-1.24% |
$51.75
|
490,435
169.70% of 50 DAV
50 DAV is 289,000
|
$54.56
-6.74%
|
4/30/2019
|
$51.46
|
PP = $53.30
|
|
MB = $55.97
|
Most Recent Note - 4/30/2019 10:22:15 AM
Y - Recently rebounded above its 50 DMA line ($50.51) helping its outlook improve. Color code is changed to yellow with new pivot point cited based on its 4/05/19 high while building on a double bottom base. Due to report earnings results after the close on Monday, May 6, 2019. Volume and volatility often increase near earnings news.
>>> FEATURED STOCK ARTICLE : Two Damaging Losses Hurt Outlook - 4/17/2019 |
View all notes |
Set NEW NOTE alert |
Company Profile |
SEC
News |
Chart |
Request a new note
C
A
S
I |
Symbol/Exchange
Company Name
Industry Group |
PRICE |
CHANGE
(%Change) |
Day High |
Volume
(% DAV)
(% 50 day avg vol) |
52 Wk Hi
% From Hi |
Featured
Date |
Price
Featured |
Pivot Featured |
|
Max Buy |
LULU
-
NASDAQ
Lululemon Athletica
MANUFACTURING - Textile Manufacturing
|
$175.67
|
-0.68
-0.39% |
$178.27
|
1,306,846
57.34% of 50 DAV
50 DAV is 2,279,000
|
$179.50
-2.13%
|
3/28/2019
|
$169.20
|
PP = $164.89
|
|
MB = $173.13
|
Most Recent Note - 4/29/2019 5:38:52 PM
G - Quietly hovering above the "max buy" level and its color code is changed to green. Prior highs define initial support to watch above its 50 DMA line ($157.50).
>>> FEATURED STOCK ARTICLE : Breakway Gap Backed by More Than 6 Times Average Volume - 3/28/2019 |
View all notes |
Set NEW NOTE alert |
Company Profile |
SEC
News |
Chart |
Request a new note
C
A
S
I |
NXST
-
NASDAQ
Nexstar Media Group Cl A
MEDIA - Broadcasting - TV
|
$115.33
|
-1.72
-1.47% |
$118.70
|
472,772
85.49% of 50 DAV
50 DAV is 553,000
|
$119.93
-3.84%
|
5/1/2019
|
$115.33
|
PP = $120.03
|
|
MB = $126.03
|
Most Recent Note - 5/1/2019 7:27:09 PM
Y - Due to earnings results before the market opens on Wednesday, May 8, 2019. Retreated from its all-time high today. Color code is changed to yellow as it has formed an advanced "3-weeks tight" base and a new pivot point is cited based on its 4/17/19 high plus 10 cents. Subsequent gains backed by at least +40% above average volume may trigger a new (or add-on) technical buy signal. Its 50 DMA line ($107.76) defines near-term support to watch on pullbacks.
>>> FEATURED STOCK ARTICLE : Hitting New High and Very Extended From Prior Base - 4/4/2019 |
View all notes |
Set NEW NOTE alert |
Company Profile |
SEC
News |
Chart |
Request a new note
C
A
S
I |
ULTA
-
NASDAQ
Ulta Beauty Inc
SPECIALTY RETAIL - Specialty Retail, Other
|
$334.94
|
-14.04
-4.02% |
$348.33
|
1,151,328
152.70% of 50 DAV
50 DAV is 754,000
|
$359.69
-6.88%
|
3/15/2019
|
$341.27
|
PP = $322.59
|
|
MB = $338.72
|
Most Recent Note - 5/1/2019 7:29:39 PM
G - Pulled back today for a big loss on above average volume ending near the session low and testing its 50 DMA line ($334.50).which defines important near term support above prior highs.
>>> FEATURED STOCK ARTICLE : Volume Totals Cooling in Recent Weeks While Hovering Near High - 4/26/2019 |
View all notes |
Set NEW NOTE alert |
Company Profile |
SEC
News |
Chart |
Request a new note
C
A
S
I |
UBNT
-
NASDAQ
Ubiquiti Networks
TELECOMMUNICATIONS - Diversified Communication Serv
|
$169.74
|
-0.71
-0.42% |
$171.99
|
217,048
64.22% of 50 DAV
50 DAV is 338,000
|
$174.95
-2.98%
|
2/8/2019
|
$121.97
|
PP = $115.54
|
|
MB = $121.32
|
Most Recent Note - 4/29/2019 5:51:03 PM
G - Hovering near its all-time high, very extended from any sound base. Its 50 DMA line ($152) and prior high ($148.68 on 2/27/19) define near-term support to watch. Fundamentals remain strong.
>>> FEATURED STOCK ARTICLE : Extended From Any Sound Bass and Wedging to New Highs - 4/12/2019 |
View all notes |
Set NEW NOTE alert |
Company Profile |
SEC
News |
Chart |
Request a new note
C
A
S
I |
ESNT
-
NYSE
Essent Group Ltd
Finance-MrtgandRel Svc
|
$47.29
|
-0.16
-0.34% |
$48.13
|
558,786
92.51% of 50 DAV
50 DAV is 604,000
|
$47.94
-1.36%
|
3/18/2019
|
$45.84
|
PP = $45.06
|
|
MB = $47.31
|
Most Recent Note - 5/1/2019 7:21:17 PM
Y - Due to report earnings news before the open on May 3rd. Volume and volatility often increase near earnings news. Pulled back today with near average volume breaking a streak of 7 consecutive gains with lighter than average volume. Found support above its 50 DMA line ($44.78) reassuringly during the recent consolidation. Faces very little resistance due to overhead supply up to the $50 level.
>>> FEATURED STOCK ARTICLE : Perched Above Pivot Point With Earnings News Due May 3rd - 4/25/2019 |
View all notes |
Set NEW NOTE alert |
Company Profile |
SEC
News |
Chart |
Request a new note
C
A
S
I |
Symbol/Exchange
Company Name
Industry Group |
PRICE |
CHANGE
(%Change) |
Day High |
Volume
(% DAV)
(% 50 day avg vol) |
52 Wk Hi
% From Hi |
Featured
Date |
Price
Featured |
Pivot Featured |
|
Max Buy |
FIVE
-
NASDAQ
Five Below Inc
Retail-DiscountandVariety
|
$142.30
|
-4.09
-2.79% |
$146.99
|
1,000,577
89.50% of 50 DAV
50 DAV is 1,118,000
|
$148.22
-3.99%
|
4/11/2019
|
$132.05
|
PP = $133.75
|
|
MB = $140.44
|
Most Recent Note - 5/1/2019 7:06:22 PM
G - Pulled back today for a 2nd consecutive loss with lighter than average volume. Recent gains lacked great volume conviction. Prior highs in the $133-136 area define initial support to watch.
>>> FEATURED STOCK ARTICLE : Finished Strong After Featured Again in Mid-Day Report - 4/11/2019 |
View all notes |
Set NEW NOTE alert |
Company Profile |
SEC
News |
Chart |
Request a new note
C
A
S
I |
NOW
-
NYSE
Servicenow Inc
Computer Sftwr-Enterprse
|
$270.40
|
-1.11
-0.41% |
$273.16
|
1,518,122
82.87% of 50 DAV
50 DAV is 1,832,000
|
$273.82
-1.25%
|
4/22/2019
|
$242.64
|
PP = $251.75
|
|
MB = $264.34
|
Most Recent Note - 5/1/2019 7:31:46 PM
G - Volume totals have been cooling while stubbornly holding its ground near its all-time high. The gap up and big gain above the pivot point on 4/25/19 triggered a new (or add-on) technical buy signal. Reported earnings +20% on +34% sales revenues for the Mar '19 quarter, below the +25% minimum earnings guideline (C criteria) raising concerns, fundamentally. Found support prompt near the 50 DMA line. Prior lows ($230.14 on 4/04/19 and $226.71 on 3/08/19) define near-term support to watch.
>>> FEATURED STOCK ARTICLE : Found Recent Support at 50-Day Moving Average - 4/15/2019 |
View all notes |
Set NEW NOTE alert |
Company Profile |
SEC
News |
Chart |
Request a new note
C
A
S
I |
PANW
-
NYSE
Palo Alto Networks
Computer Sftwr-Security
|
$246.39
|
-2.44
-0.98% |
$249.96
|
621,517
46.56% of 50 DAV
50 DAV is 1,335,000
|
$260.63
-5.46%
|
2/25/2019
|
$233.54
|
PP = $239.60
|
|
MB = $251.58
|
Most Recent Note - 4/29/2019 5:45:54 PM
Y - Posted a 6th consecutive small gain today with lighter than average volume. Found support near its 50 DMA line ($240) and the prior low ($233.15 on 4/04/19). Fundamentals remain strong.
>>> FEATURED STOCK ARTICLE : Consolidating Above Prior High and 50-Day Average - 4/3/2019 |
View all notes |
Set NEW NOTE alert |
Company Profile |
SEC
News |
Chart |
Request a new note
C
A
S
I |
ANET
-
NYSE
Arista Networks Inc
TELECOMMUNICATIONS - Communication Equipment
|
$310.46
|
-1.83
-0.59% |
$316.22
|
853,395
106.94% of 50 DAV
50 DAV is 798,000
|
$331.27
-6.28%
|
3/13/2019
|
$295.38
|
PP = $313.37
|
|
MB = $329.04
|
Most Recent Note - 4/30/2019 12:18:18 PM
Y - Slumping below the pivot point and back into the previous base with a big loss today on higher volume raising concerns. Its 50 DMA line ($302.55)defines important near-term support to watch. Due to report earnings news on May 2nd after the close. Volume and volatility often increase near earnings news.
>>> FEATURED STOCK ARTICLE : Hovering Near High With Volume Totals Cooling - 4/22/2019 |
View all notes |
Set NEW NOTE alert |
Company Profile |
SEC
News |
Chart |
Request a new note
C
A
S
I |
PAYC
-
NYSE
Paycom Software Inc
COMPUTER SOFTWARE and SERVICES - Application Software
|
$201.46
|
-1.07
-0.53% |
$203.20
|
1,263,774
221.33% of 50 DAV
50 DAV is 571,000
|
$203.04
-0.78%
|
2/6/2019
|
$171.66
|
PP = $164.18
|
|
MB = $172.39
|
Most Recent Note - 4/29/2019 12:41:40 PM
G - Due to report earnings for the Mar '19 quarter after the market closes on Tuesday, April 30. Recently wedged higher with gains lacking great volume conviction while it did not form a sound new base of sufficient length. Held its ground at its 50 DMA line ($185) which defines important near-term support to watch above recent lows.
>>> FEATURED STOCK ARTICLE : Paycom Software Quietly Hovering Near All-Time High - 4/16/2019 |
View all notes |
Set NEW NOTE alert |
Company Profile |
SEC
News |
Chart |
Request a new note
C
A
S
I |
Symbol/Exchange
Company Name
Industry Group |
PRICE |
CHANGE
(%Change) |
Day High |
Volume
(% DAV)
(% 50 day avg vol) |
52 Wk Hi
% From Hi |
Featured
Date |
Price
Featured |
Pivot Featured |
|
Max Buy |
PYPL
-
NASDAQ
Paypal Holdings Inc
Finance-CrdtCard/PmtPr
|
$110.94
|
-1.83
-1.62% |
$113.69
|
5,442,176
81.74% of 50 DAV
50 DAV is 6,658,000
|
$113.22
-2.01%
|
1/24/2019
|
$92.56
|
PP = $93.80
|
|
MB = $98.49
|
Most Recent Note - 5/1/2019 7:13:53 PM
G - Pulled back today with light volume after hitting new all-time highs with a streak of 6 consecutive gains marked by higher volume. Very extended from any sound base and well above its 50 DMA line ($102.92) which defines support to watch. Recently reported earnings +37% on +12% sales revenues for the Mar '19 quarter, continuing its strong earnings track record.
>>> FEATURED STOCK ARTICLE : Extended From Base After Gains in Recent Weeks Lacking Volume - 4/2/2019 |
View all notes |
Set NEW NOTE alert |
Company Profile |
SEC
News |
Chart |
Request a new note
C
A
S
I |
ALRM
-
NASDAQ
Alarm.com Holdings Inc
Security/Sfty
|
$70.23
|
-0.65
-0.92% |
$71.34
|
394,630
91.35% of 50 DAV
50 DAV is 432,000
|
$71.46
-1.72%
|
1/22/2019
|
$60.52
|
PP = $60.30
|
|
MB = $63.32
|
Most Recent Note - 4/29/2019 5:34:37 PM
G - Holding its ground stubbornly after wedging to new highs with gains lacking great volume conviction. Found prompt support near the 50 DMA line after it reported earnings +12% on +25% sales revenues for the Dec '18 quarter, below the +25% minimum earnings guideline (C criteria), raising fundamental concerns.
>>> FEATURED STOCK ARTICLE : Consolidating Near 50-Day Average Following Sub Par Report - 3/29/2019 |
View all notes |
Set NEW NOTE alert |
Company Profile |
SEC
News |
Chart |
Request a new note
C
A
S
I |
PLNT
-
NYSE
Planet Fitness Inc Cl A
Leisure-Services
|
$75.38
|
-0.32
-0.42% |
$76.48
|
1,206,752
82.65% of 50 DAV
50 DAV is 1,460,000
|
$77.34
-2.53%
|
11/7/2018
|
$57.10
|
PP = $55.45
|
|
MB = $58.22
|
Most Recent Note - 5/1/2019 7:10:11 PM
G - Due to report results for its first quarter ended March 31, 2019 after the market closes on Thursday, May 2, 2019. Volume and volatility often increase near earnings news. Hovering near its all-time high with today's 3rd consecutive small loss on lighter than average volume. Very extended from any sound base. Its 50 DMA line (67.92) defines near-term support to watch on pullbacks.
>>> FEATURED STOCK ARTICLE : Perched Near High Very Extended From Prior Base - 4/5/2019 |
View all notes |
Set NEW NOTE alert |
Company Profile |
SEC
News |
Chart |
Request a new note
C
A
S
I |
TEAM
-
NASDAQ
Atlassian Corp Plc Cl A
Comp Sftwr-Spec Enterprs
|
$108.59
|
-1.56
-1.42% |
$110.99
|
1,092,108
63.87% of 50 DAV
50 DAV is 1,710,000
|
$117.06
-7.24%
|
4/16/2019
|
$114.77
|
PP = $116.80
|
|
MB = $122.64
|
Most Recent Note - 5/1/2019 7:15:57 PM
G - Retreated quietly today to close just below the 50 DMA line ($109.19) after wedging higher. Recently reported earnings +133% on +38% sales revenues for the Mar '19 quarter, continuing its strong earnings track record.
>>> FEATURED STOCK ARTICLE : Perched Near High Enduring Distributional Pressure - 4/9/2019 |
View all notes |
Set NEW NOTE alert |
Company Profile |
SEC
News |
Chart |
Request a new note
C
A
S
I |
GLOB
-
NYSE
Globant SA
Computer-Tech Services
|
$82.92
|
-1.07
-1.27% |
$85.00
|
108,161
56.04% of 50 DAV
50 DAV is 193,000
|
$84.19
-1.51%
|
2/15/2019
|
$69.35
|
PP = $70.00
|
|
MB = $73.50
|
Most Recent Note - 4/30/2019 6:03:51 PM
G - Posted a big gain today with light volume for a best-ever close. Very extended from any sound base. Near-term support is at its prior high ($74) and its 50 DMA line ($73.92). Violations would raise concerns and trigger technical sell signals.
>>> FEATURED STOCK ARTICLE : Consolidating Near 50-Day Average Quietly Perched Near High - 3/26/2019 |
View all notes |
Set NEW NOTE alert |
Company Profile |
SEC
News |
Chart |
Request a new note
C
A
S
I |
Symbol/Exchange
Company Name
Industry Group |
PRICE |
CHANGE
(%Change) |
Day High |
Volume
(% DAV)
(% 50 day avg vol) |
52 Wk Hi
% From Hi |
Featured
Date |
Price
Featured |
Pivot Featured |
|
Max Buy |
TTD
-
NASDAQ
The Trade Desk Inc Cl A
Comml Svcs-Advertising
|
$221.22
|
-0.26
-0.12% |
$225.64
|
1,032,161
63.09% of 50 DAV
50 DAV is 1,636,000
|
$226.38
-2.28%
|
4/22/2019
|
$211.03
|
PP = $214.80
|
|
MB = $225.54
|
Most Recent Note - 4/30/2019 6:00:02 PM
Y - Color code is changed to yellow after pulling back below its "max buy" level. Disciplined investors will note that gains above the pivot point did not have the volume necessary to trigger a proper new (or add-on) technical buy signal. Its 50 DMA line ($198.44) defines initial support to watch above the prior low ($178.30 on 3/27/19). Due to report earnings news before the open on 5/09/19. See the latest FSU analysis for more details and a new annotated graph.
>>> FEATURED STOCK ARTICLE : Pulled Back Below "Max Buy" Level After Wedging Higher - 4/30/2019 |
View all notes |
Set NEW NOTE alert |
Company Profile |
SEC
News |
Chart |
Request a new note
C
A
S
I |